| Param | Original file | Final file |
|---|---|---|
| Filename | modeM0/AS1A09_038T12_9000003880_26891cztM0_level2.evt | modeM0/AS1A09_038T12_9000003880_26891cztM0_level2_quad_clean.evt |
| Size (bytes) | 424,990,080 | 70,902,720 |
| Size | 405.3 MB | 67.6 MB |
| Events in quadrant A | 3,329,905 | 476,318 |
| Events in quadrant B | 4,385,445 | 440,089 |
| Events in quadrant C | 1,902,356 | 479,424 |
| Events in quadrant D | 2,972,170 | 459,308 |
| Mode M9 | |||
|---|---|---|---|
| Quadrant | BADHDUFLAG | Total packets | Discarded packets |
| A | 0 | 1 | 0 |
| B | 0 | 2 | 0 |
| C | 0 | 2 | 0 |
| D | 0 | 2 | 0 |
| Mode M0 | |||
|---|---|---|---|
| Quadrant | BADHDUFLAG | Total packets | Discarded packets |
| A | 0 | 12757 | 1 |
| B | 0 | 15794 | 1 |
| C | 0 | 8409 | 1 |
| D | 0 | 11728 | 1 |
| Mode SS | |||
|---|---|---|---|
| Quadrant | BADHDUFLAG | Total packets | Discarded packets |
| A | 0 | 82 | 0 |
| B | 0 | 82 | 0 |
| C | 0 | 82 | 0 |
| D | 0 | 82 | 0 |
| Quadrant | Total seconds | Saturated seconds | Saturation percentage |
|---|---|---|---|
| A | 4137 | 204 | 4.931109% |
| B | 4137 | 885 | 21.392313% |
| C | 4137 | 17 | 0.410926% |
| D | 4137 | 169 | 4.085086% |
Noise dominated data is calculated using 1-second bins in cleaned event files. If a bin has >2000 counts, and if more than 50% of those come from <1% of pixels, then it is considered to be noise-dominated and hence unusable.
| Quadrant | # 1 sec bins | Bins with >0 counts | Bins with >2000 counts | High rate bins dominated by noise | Noise dominated (total time) | Noise dominated (detector-on time) | Marked lightcurve |
|---|---|---|---|---|---|---|---|
| A | 4137 | 4137 | 131 | 131 | 3.17% | 3.17% | 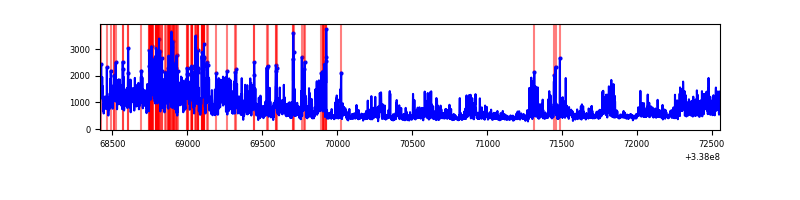 |
| B | 4137 | 4137 | 773 | 773 | 18.69% | 18.69% | 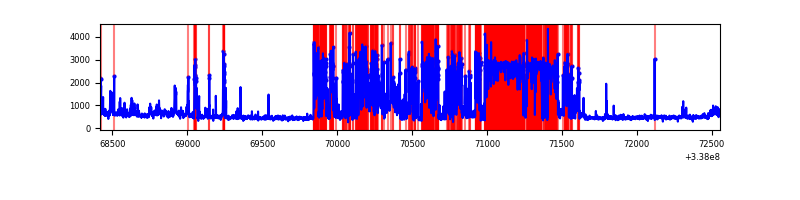 |
| C | 4137 | 4137 | 3 | 3 | 0.07% | 0.07% | 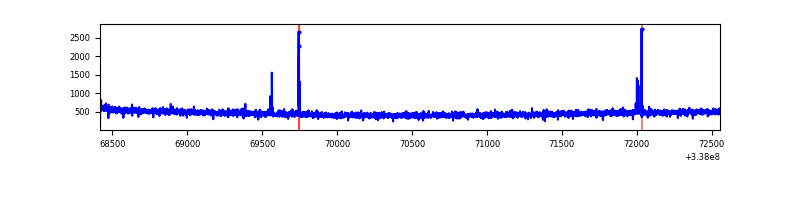 |
| D | 4137 | 4137 | 169 | 169 | 4.09% | 4.09% | 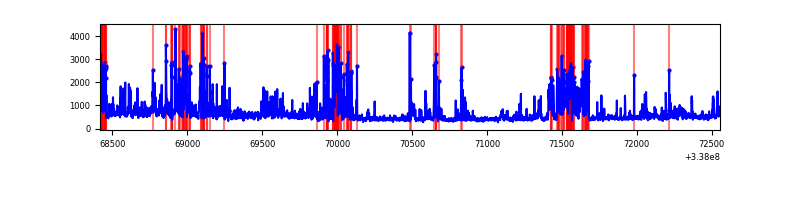 |
Top three noisy pixels from each quadrant. If the there are fewer than three noisy pixels in the level2.evt file, extra rows are filled as -1
| Pixel properties | Quadrant properties | ||||||
|---|---|---|---|---|---|---|---|
| Quadrant | DetID | PixID | Counts | Sigma | Mean | Median | Sigma |
| A | 0 | 13 | 983539 | 10348.1 | 468 | 460 | 95.0 |
| A | 6 | 16 | 537665 | 5654.73 | 468 | 460 | 95.0 |
| A | 13 | 254 | 6764 | 66.36 | 468 | 460 | 95.0 |
| B | 3 | 64 | 2561713 | 30856.9 | 437 | 425 | 83.0 |
| B | 0 | 190 | 59960 | 717.24 | 437 | 425 | 83.0 |
| B | 10 | 246 | 35582 | 423.55 | 437 | 425 | 83.0 |
| C | 14 | 238 | 75321 | 689.93 | 463 | 465 | 108.5 |
| C | 15 | 208 | 21550 | 194.34 | 463 | 465 | 108.5 |
| C | 13 | 61 | 3059 | 23.91 | 463 | 465 | 108.5 |
| D | 1 | 52 | 975324 | 9140.31 | 452 | 442 | 106.7 |
| D | 2 | 250 | 169548 | 1585.51 | 452 | 442 | 106.7 |
| D | 11 | 176 | 58437 | 543.75 | 452 | 442 | 106.7 |
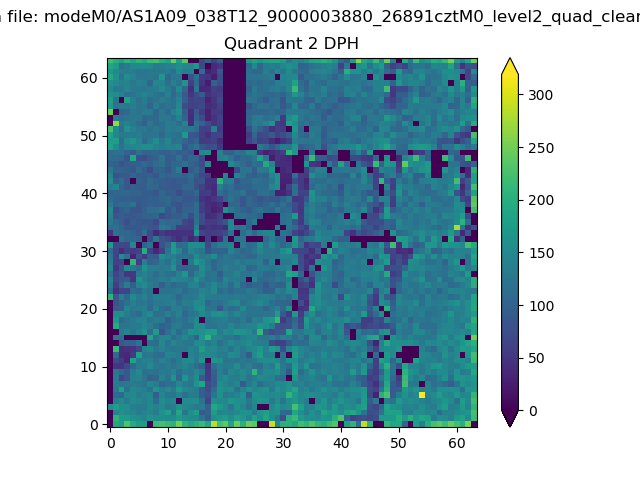
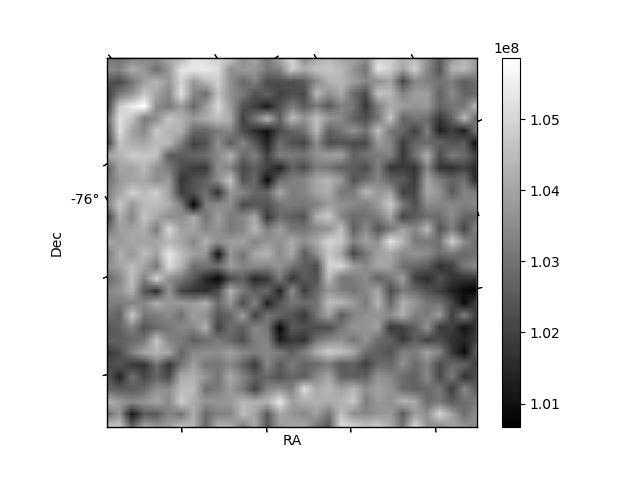
Histogram calculated using DETX and DETY for each event in the final _common_clean file
| Quadrant A | 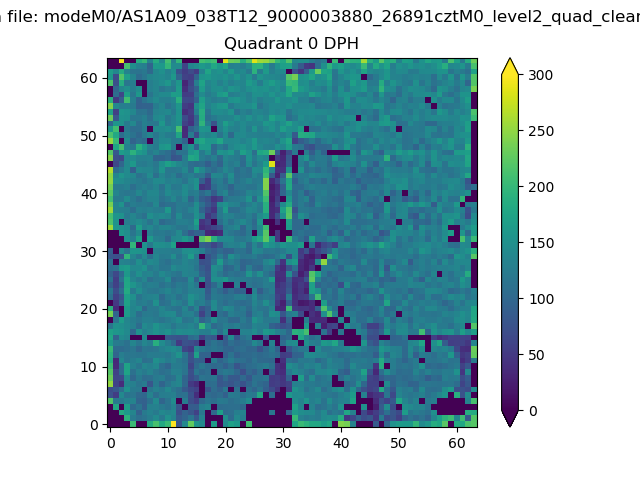 |
 |
Quadrant B |
|---|---|---|---|
| Quadrant D |  |
 |
Quadrant C |
| Plot type | Count rate plots | Images |
|---|---|---|
| Comparison with Poisson distribution Blue bars denote a histogram of data divided into 1 sec bins. Red curve is a Poisson curve with rate = median count rate of data. |
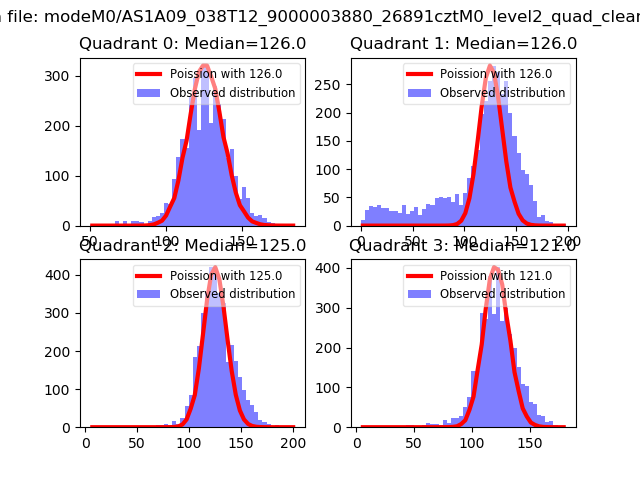 |
 |
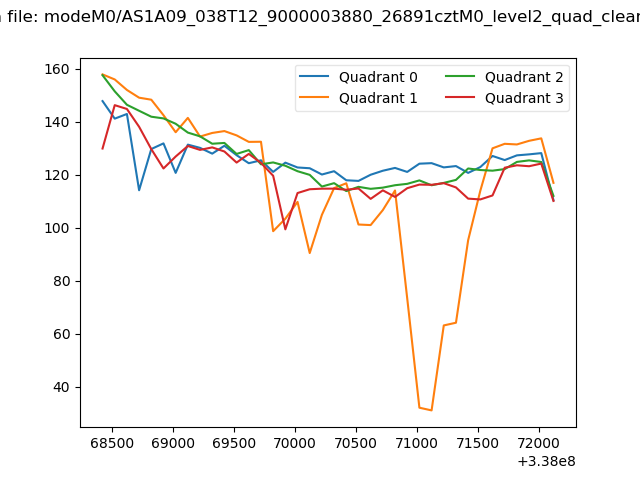
| Quadrant-wise count rates Data is divided into 100 sec bins |
 |
|
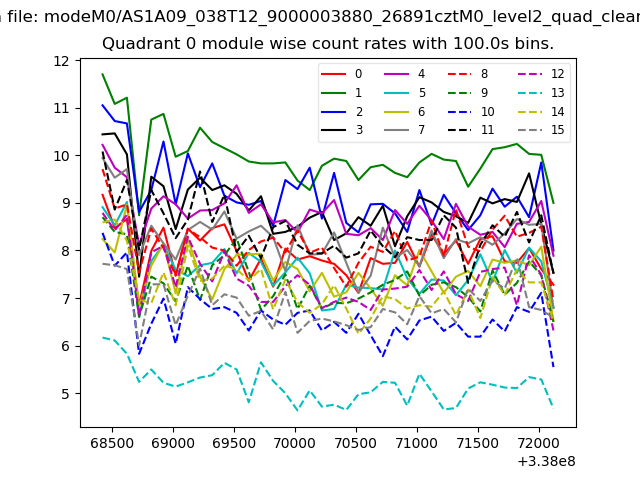
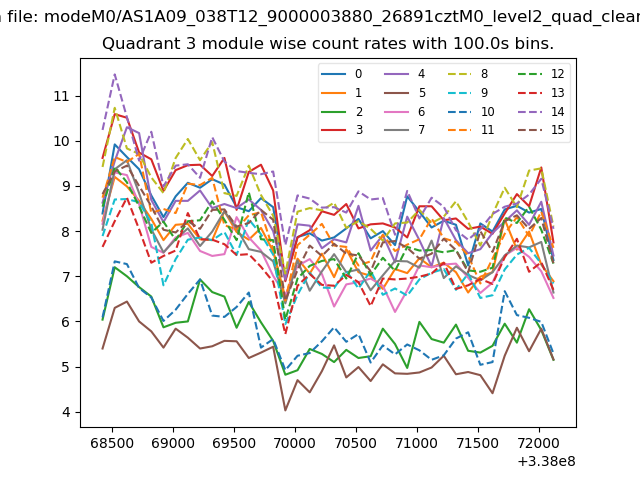
| Module-wise count rates for Quadrant A Data is divided into 100 sec bins |
 |
 |
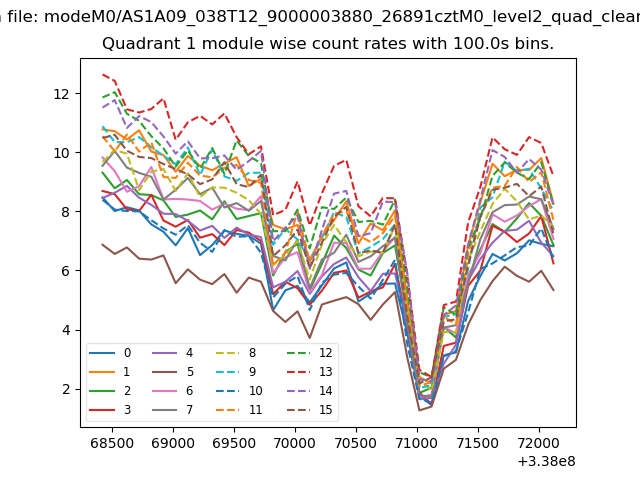
| Module-wise count rates for Quadrant B Data is divided into 100 sec bins |
 |
 |
| Module-wise count rates for Quadrant C Data is divided into 100 sec bins |
 |
 |
| Module-wise count rates for Quadrant D Data is divided into 100 sec bins |
 |
 |
| Parameter | Plot |
|---|---|
| CZT HV Monitor |  |
| D_VDD | 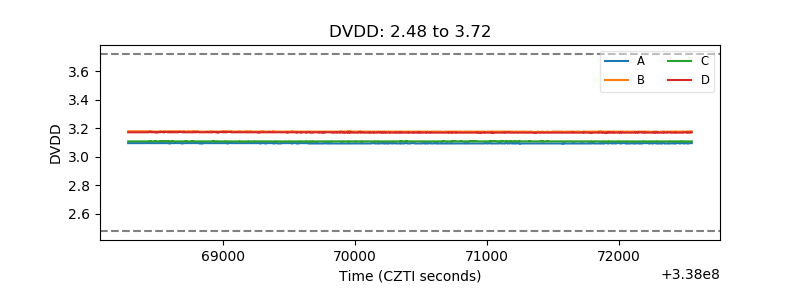 |
| Temperature 1 | 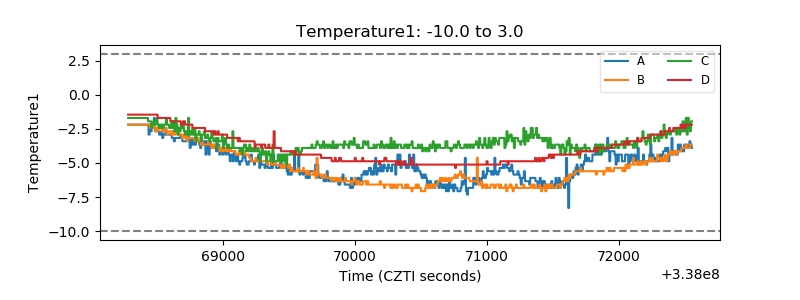 |
| Veto HV Monitor | 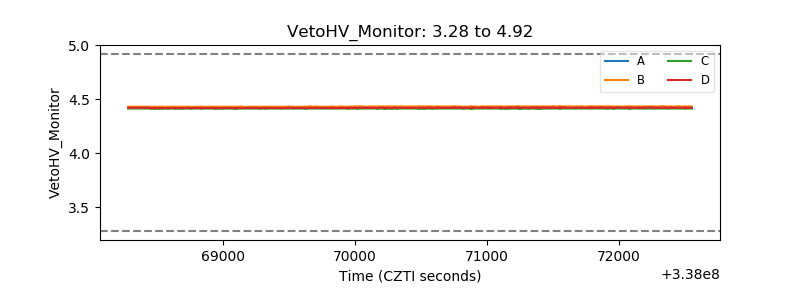 |
| Veto LLD | 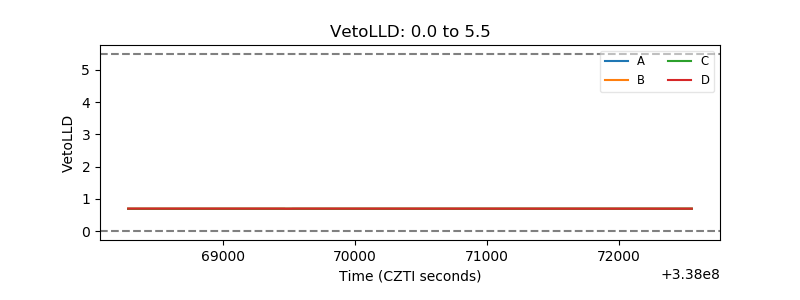 |
| Alpha Counter | 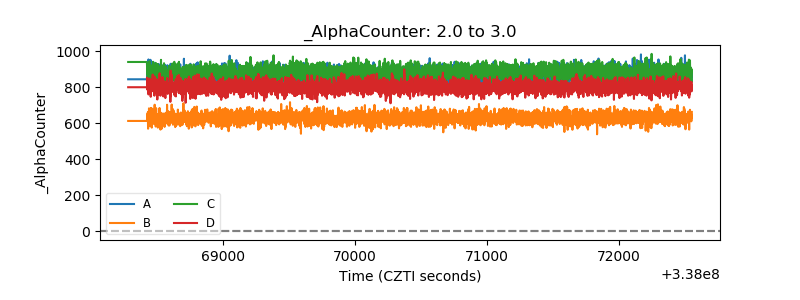 |
| _CPM_Rate | 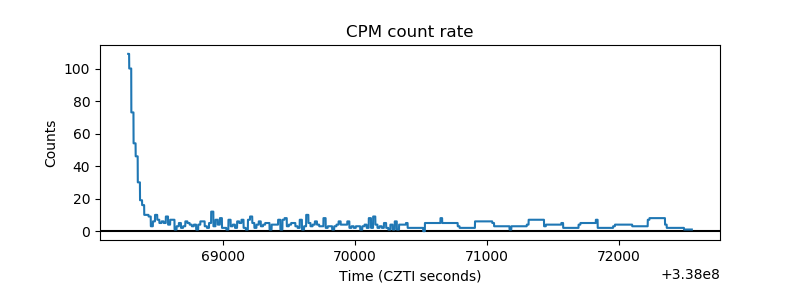 |
| CZT Counter | 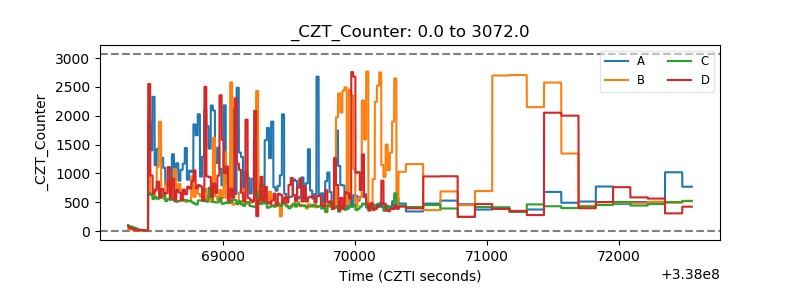 |
| +2.5 Volts monitor |  |
| +5 Volts monitor | 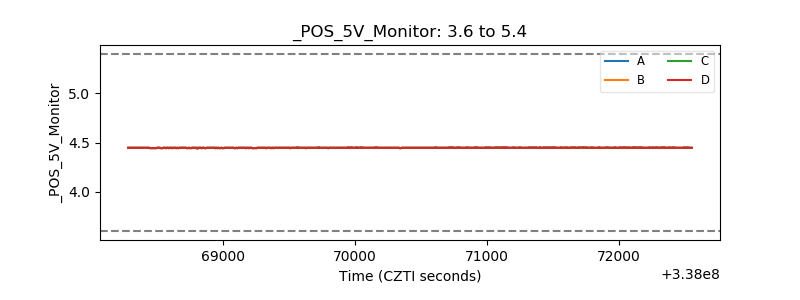 |
| _ROLL_ROT | 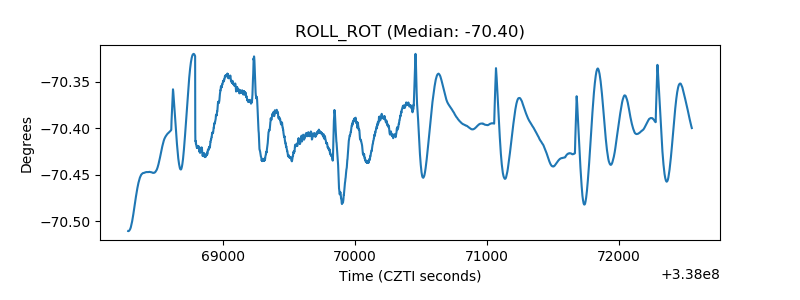 |
| _Roll_DEC | 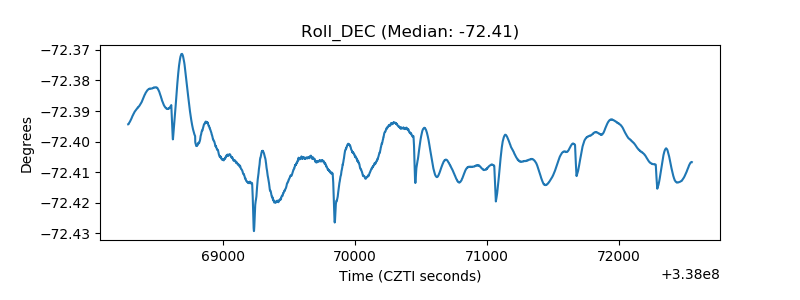 |
| _Roll_RA | 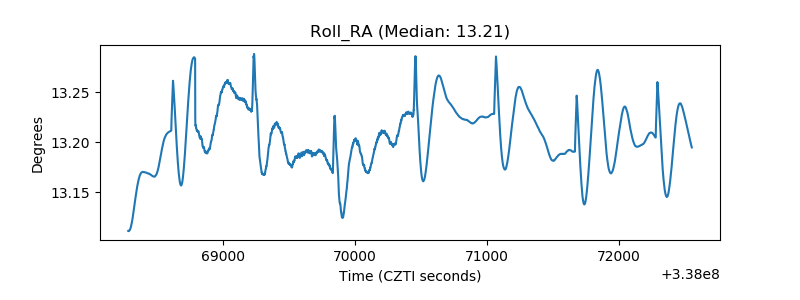 |
| Veto Counter | 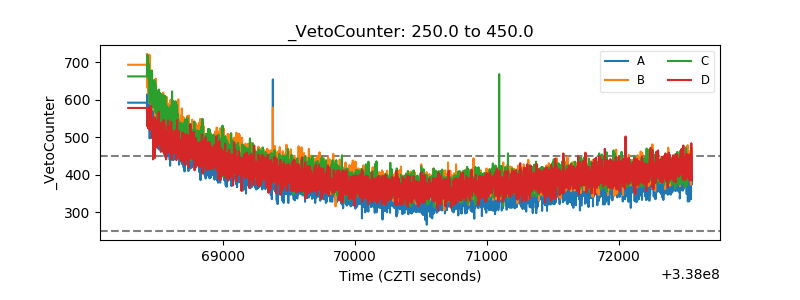 |