| Param | Original file | Final file |
|---|---|---|
| Filename | modeM0/AS1A09_038T17_9000003884cztM0_level2.fits | modeM0/AS1A09_038T17_9000003884cztM0_level2_quad_clean.evt |
| Size (bytes) | 358,295,040 | 253,362,240 |
| Size | 341.7 MB | 241.6 MB |
| Events in quadrant A | 2,245,914 | 1,413,934 |
| Events in quadrant B | 2,124,834 | 1,431,106 |
| Events in quadrant C | 2,269,751 | 1,413,367 |
| Events in quadrant D | 1,851,382 | 1,054,889 |
| Mode SS | |||
|---|---|---|---|
| Quadrant | BADHDUFLAG | Total packets | Discarded packets |
| A | 0 | 816 | 0 |
| B | 0 | 816 | 0 |
| C | 0 | 816 | 0 |
| D | 0 | 816 | 0 |
| Mode M0 | |||
|---|---|---|---|
| Quadrant | BADHDUFLAG | Total packets | Discarded packets |
| A | 0 | 78854 | 0 |
| B | 0 | 83162 | 0 |
| C | 0 | 71799 | 0 |
| D | 0 | 111296 | 0 |
| Mode M9 | |||
|---|---|---|---|
| Quadrant | BADHDUFLAG | Total packets | Discarded packets |
| A | 0 | 77 | 0 |
| B | 0 | 77 | 0 |
| C | 0 | 77 | 0 |
| D | 0 | 77 | 0 |
| Quadrant | Total seconds | Saturated seconds | Saturation percentage |
|---|---|---|---|
| A | 33881 | 537 | 1.584959% |
| B | 33873 | 1784 | 5.266732% |
| C | 33880 | 640 | 1.889020% |
| D | 33988 | 4560 | 13.416500% |
Noise dominated data is calculated using 1-second bins in cleaned event files. If a bin has >2000 counts, and if more than 50% of those come from <1% of pixels, then it is considered to be noise-dominated and hence unusable.
| Quadrant | # 1 sec bins | Bins with >0 counts | Bins with >2000 counts | High rate bins dominated by noise | Noise dominated (total time) | Noise dominated (detector-on time) | Marked lightcurve |
|---|---|---|---|---|---|---|---|
| A | 41696 | 33880 | 0 | 0 | 0.00% | 0.00% |  |
| B | 41696 | 33824 | 0 | 0 | 0.00% | 0.00% |  |
| C | 41696 | 33887 | 0 | 0 | 0.00% | 0.00% |  |
| D | 41696 | 33879 | 0 | 0 | 0.00% | 0.00% |  |
Top three noisy pixels from each quadrant. If the there are fewer than three noisy pixels in the level2.evt file, extra rows are filled as -1
| Pixel properties | Quadrant properties | ||||||
|---|---|---|---|---|---|---|---|
| Quadrant | DetID | PixID | Counts | Sigma | Mean | Median | Sigma |
| A | 0 | 29 | 1901 | 9.44 | 585 | 555 | 142.5 |
| A | 7 | 110 | 1807 | 8.78 | 585 | 555 | 142.5 |
| A | 9 | 19 | 1629 | 7.54 | 585 | 555 | 142.5 |
| B | 2 | 9 | 1628 | 9.9 | 562 | 540 | 109.9 |
| B | 2 | 8 | 1419 | 8.0 | 562 | 540 | 109.9 |
| B | 5 | 255 | 1394 | 7.77 | 562 | 540 | 109.9 |
| C | 1 | 80 | 1747 | 7.84 | 599 | 569 | 150.2 |
| C | 1 | 81 | 1747 | 7.84 | 599 | 569 | 150.2 |
| C | 12 | 241 | 1593 | 6.82 | 599 | 569 | 150.2 |
| D | 10 | 189 | 1329 | 5.97 | 529 | 486 | 141.1 |
| D | 3 | 14 | 1325 | 5.94 | 529 | 486 | 141.1 |
| D | 6 | 231 | 1314 | 5.87 | 529 | 486 | 141.1 |
Histogram calculated using DETX and DETY for each event in the final _common_clean file
| Quadrant A | 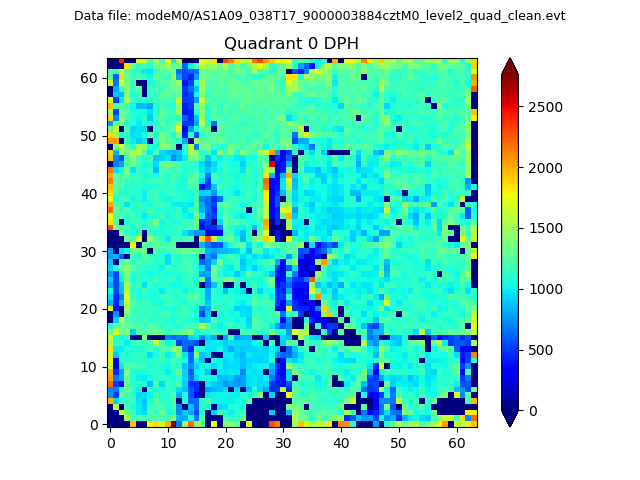 |
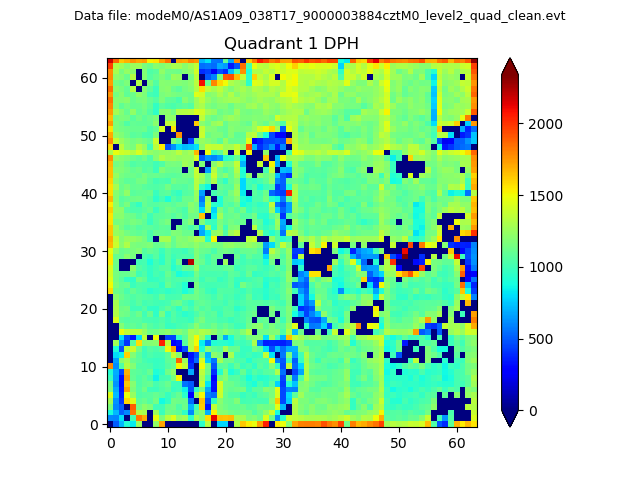 |
Quadrant B |
|---|---|---|---|
| Quadrant D |  |
 |
Quadrant C |
| Plot type | Count rate plots | Images |
|---|---|---|
| Comparison with Poisson distribution Blue bars denote a histogram of data divided into 1 sec bins. Red curve is a Poisson curve with rate = median count rate of data. |
 |
 |
| Quadrant-wise count rates Data is divided into 100 sec bins |
 |
|
| Module-wise count rates for Quadrant A Data is divided into 100 sec bins |
 |
 |
| Module-wise count rates for Quadrant B Data is divided into 100 sec bins |
 |
 |
| Module-wise count rates for Quadrant C Data is divided into 100 sec bins |
 |
 |
| Module-wise count rates for Quadrant D Data is divided into 100 sec bins |
 |
 |
| Parameter | Plot |
|---|---|
| CZT HV Monitor |  |
| D_VDD |  |
| Temperature 1 |  |
| Veto HV Monitor |  |
| Veto LLD |  |
| Alpha Counter |  |
| _CPM_Rate |  |
| CZT Counter |  |
| +2.5 Volts monitor |  |
| +5 Volts monitor |  |
| _ROLL_ROT |  |
| _Roll_DEC |  |
| _Roll_RA |  |
| Veto Counter |  |