| Param | Original file | Final file |
|---|---|---|
| Filename | modeM0/AS1A09_038T17_9000003884_26892cztM0_level2.evt | modeM0/AS1A09_038T17_9000003884_26892cztM0_level2_quad_clean.evt |
| Size (bytes) | 254,724,480 | 56,450,880 |
| Size | 242.9 MB | 53.8 MB |
| Events in quadrant A | 1,826,372 | 374,338 |
| Events in quadrant B | 2,173,333 | 381,100 |
| Events in quadrant C | 1,569,254 | 381,308 |
| Events in quadrant D | 1,945,254 | 363,868 |
| Mode M0 | |||
|---|---|---|---|
| Quadrant | BADHDUFLAG | Total packets | Discarded packets |
| A | 0 | 7341 | 0 |
| B | 0 | 8353 | 0 |
| C | 0 | 6353 | 0 |
| D | 0 | 7675 | 0 |
| Mode M9 | |||
|---|---|---|---|
| Quadrant | BADHDUFLAG | Total packets | Discarded packets |
| A | 0 | 12 | 0 |
| B | 0 | 12 | 0 |
| C | 0 | 12 | 0 |
| D | 0 | 12 | 0 |
| Quadrant | Total seconds | Saturated seconds | Saturation percentage |
|---|---|---|---|
| A | 2925 | 20 | 0.683761% |
| B | 2925 | 184 | 6.290598% |
| C | 2925 | 20 | 0.683761% |
| D | 2925 | 49 | 1.675214% |
Noise dominated data is calculated using 1-second bins in cleaned event files. If a bin has >2000 counts, and if more than 50% of those come from <1% of pixels, then it is considered to be noise-dominated and hence unusable.
| Quadrant | # 1 sec bins | Bins with >0 counts | Bins with >2000 counts | High rate bins dominated by noise | Noise dominated (total time) | Noise dominated (detector-on time) | Marked lightcurve |
|---|---|---|---|---|---|---|---|
| A | 4175 | 2926 | 7 | 7 | 0.17% | 0.24% | 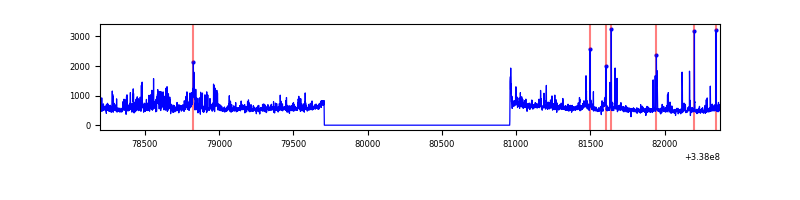 |
| B | 4175 | 2926 | 89 | 89 | 2.13% | 3.04% | 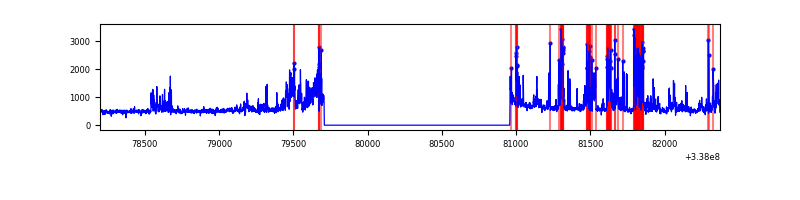 |
| C | 4175 | 2926 | 0 | 0 | 0.00% | 0.00% | 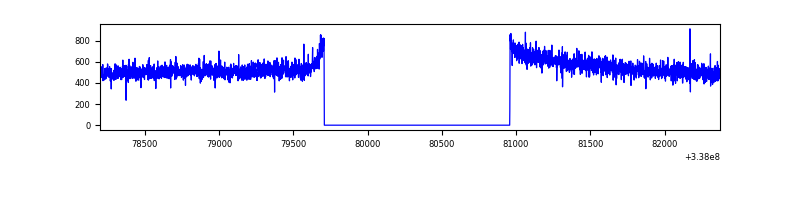 |
| D | 4175 | 2926 | 44 | 44 | 1.05% | 1.50% | 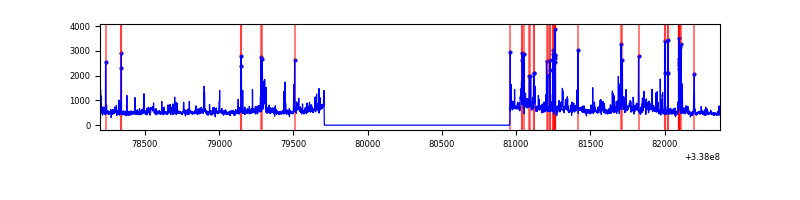 |
Top three noisy pixels from each quadrant. If the there are fewer than three noisy pixels in the level2.evt file, extra rows are filled as -1
| Pixel properties | Quadrant properties | ||||||
|---|---|---|---|---|---|---|---|
| Quadrant | DetID | PixID | Counts | Sigma | Mean | Median | Sigma |
| A | 0 | 13 | 246349 | 3109.01 | 391 | 383 | 79.1 |
| A | 6 | 16 | 67447 | 847.69 | 391 | 383 | 79.1 |
| A | 13 | 254 | 4746 | 55.15 | 391 | 383 | 79.1 |
| B | 3 | 64 | 403047 | 5513.84 | 389 | 380 | 73.0 |
| B | 0 | 190 | 130259 | 1778.47 | 389 | 380 | 73.0 |
| B | 10 | 246 | 70102 | 954.72 | 389 | 380 | 73.0 |
| C | 14 | 238 | 62669 | 686.34 | 386 | 389 | 90.7 |
| C | 13 | 61 | 2688 | 25.34 | 386 | 389 | 90.7 |
| C | 8 | 222 | 1013 | 6.88 | 386 | 389 | 90.7 |
| D | 1 | 52 | 319250 | 3528.89 | 381 | 373 | 90.4 |
| D | 2 | 250 | 88154 | 971.44 | 381 | 373 | 90.4 |
| D | 7 | 80 | 52799 | 580.18 | 381 | 373 | 90.4 |
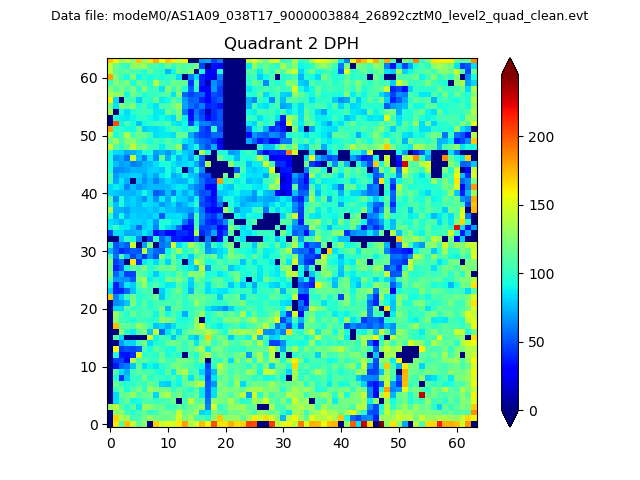
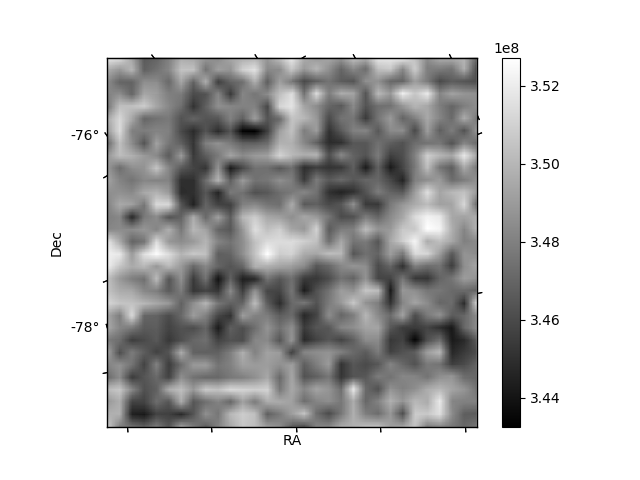
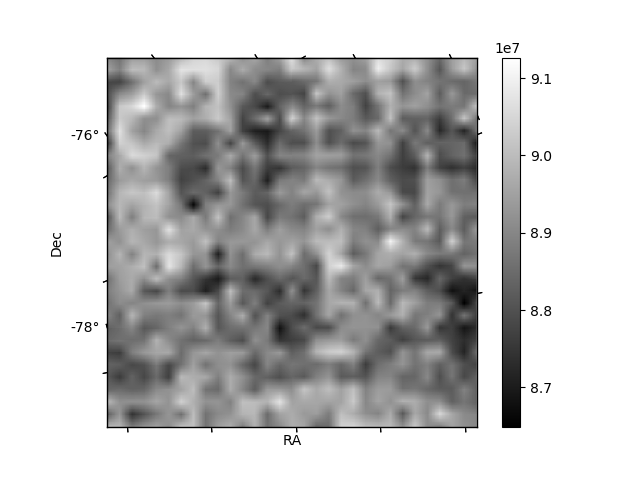
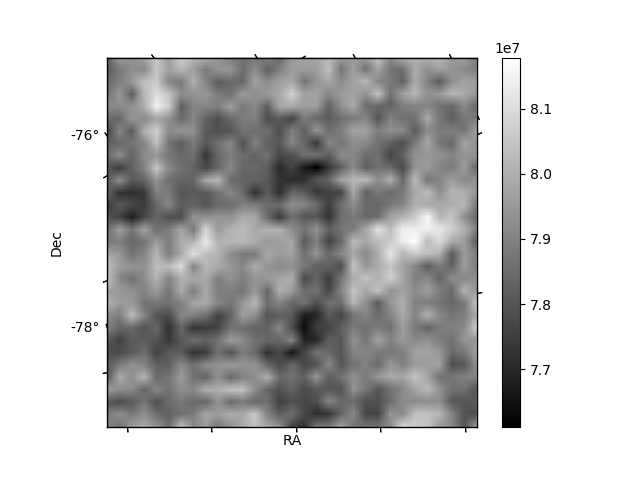
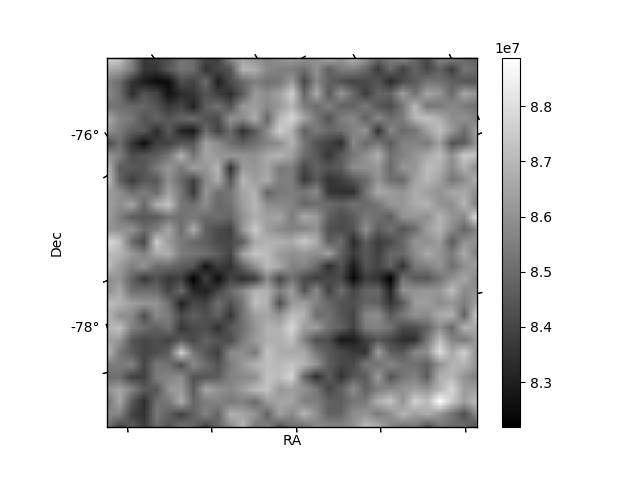
Histogram calculated using DETX and DETY for each event in the final _common_clean file
| Quadrant A | 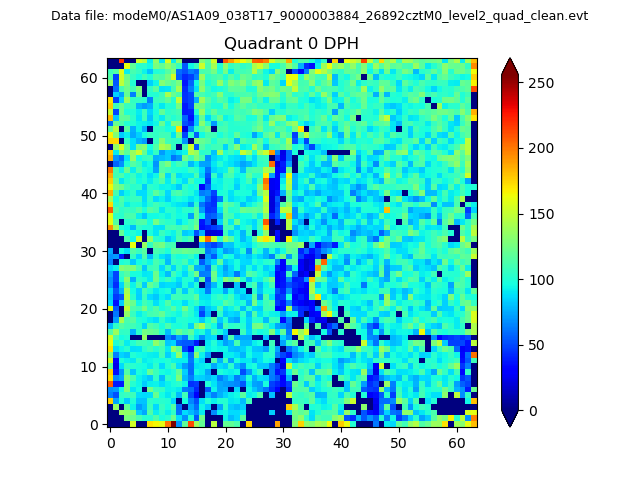 |
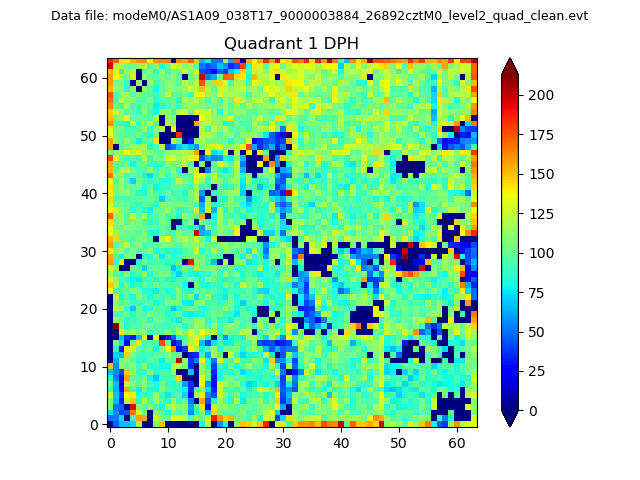 |
Quadrant B |
|---|---|---|---|
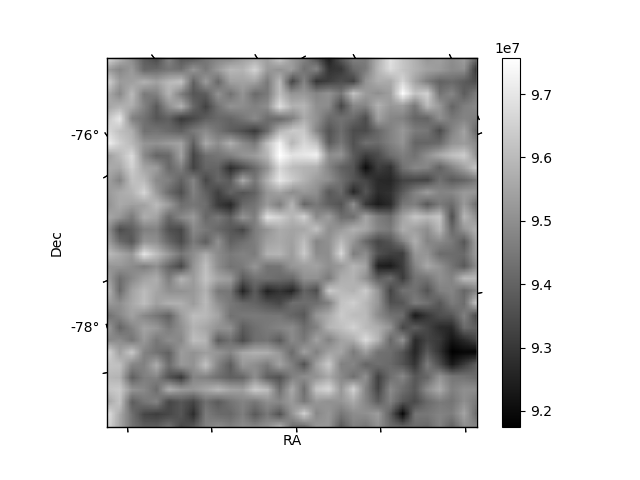
| Quadrant D | 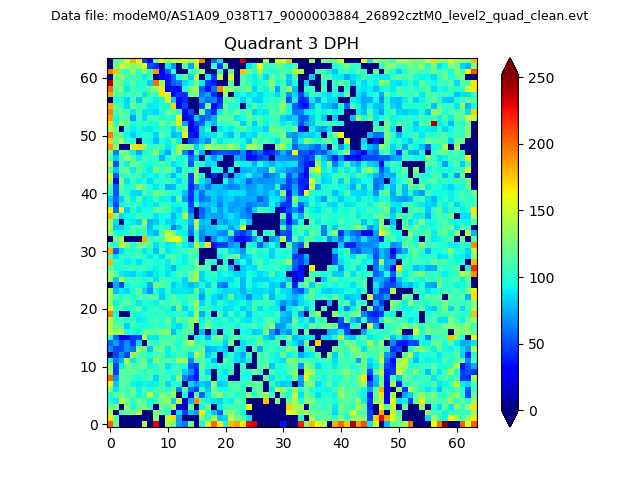 |
 |
Quadrant C |
| Plot type | Count rate plots | Images |
|---|---|---|
| Comparison with Poisson distribution Blue bars denote a histogram of data divided into 1 sec bins. Red curve is a Poisson curve with rate = median count rate of data. |
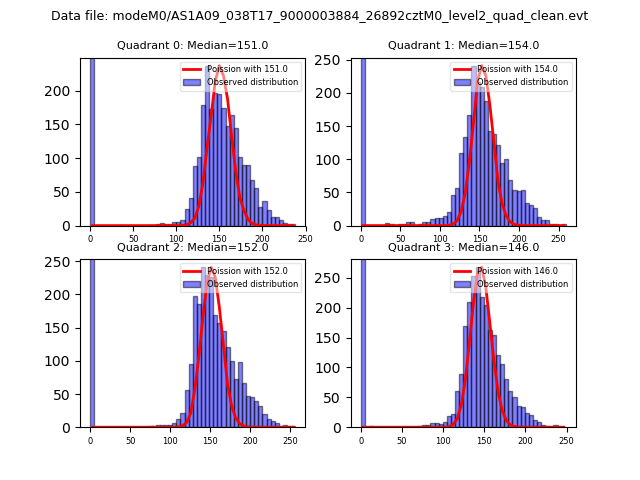 |
 |
| Quadrant-wise count rates Data is divided into 100 sec bins |
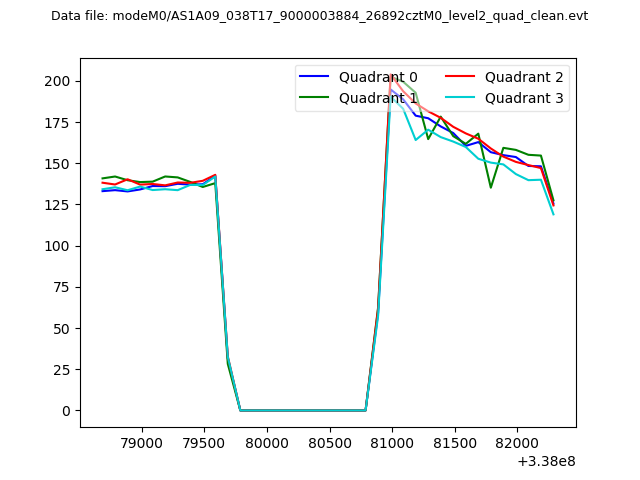 |
|
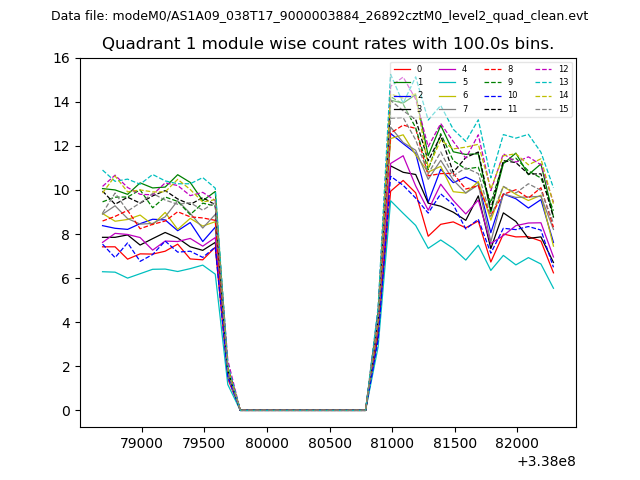
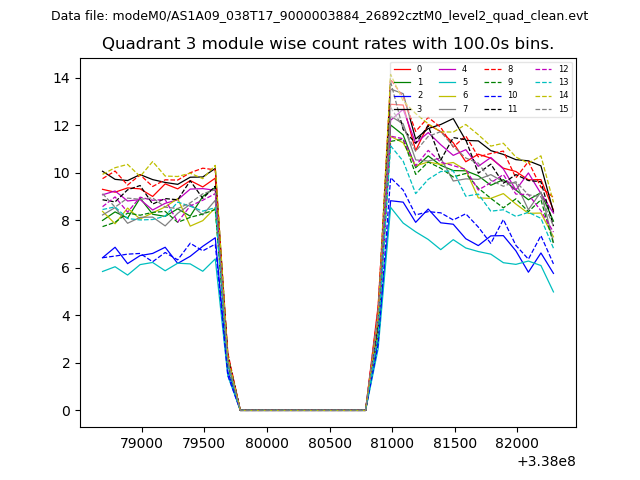
| Module-wise count rates for Quadrant A Data is divided into 100 sec bins |
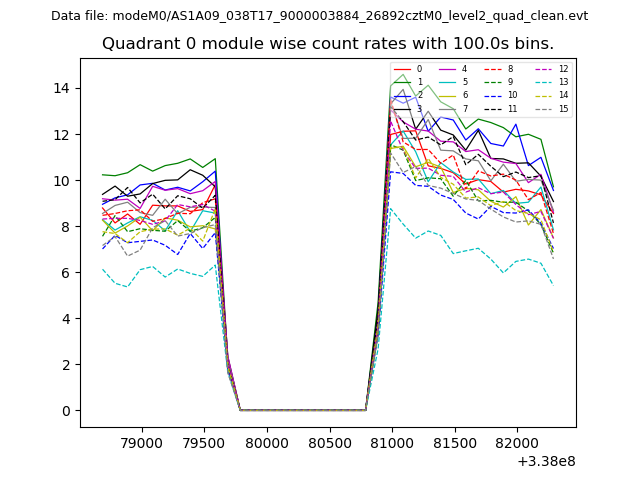 |
 |
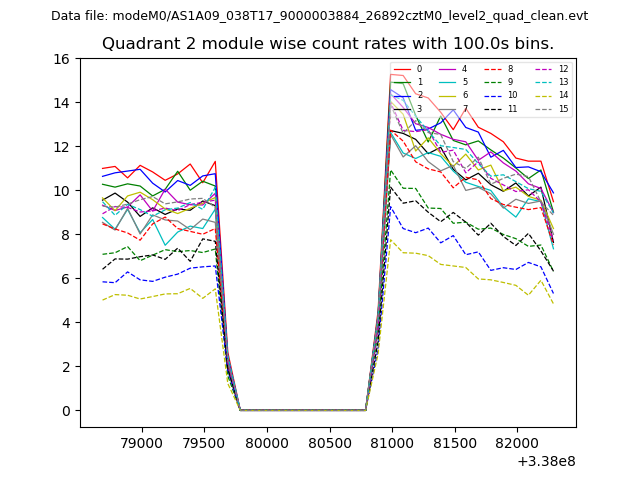
| Module-wise count rates for Quadrant B Data is divided into 100 sec bins |
 |
 |
| Module-wise count rates for Quadrant C Data is divided into 100 sec bins |
 |
 |
| Module-wise count rates for Quadrant D Data is divided into 100 sec bins |
 |
 |
| Parameter | Plot |
|---|---|
| CZT HV Monitor | 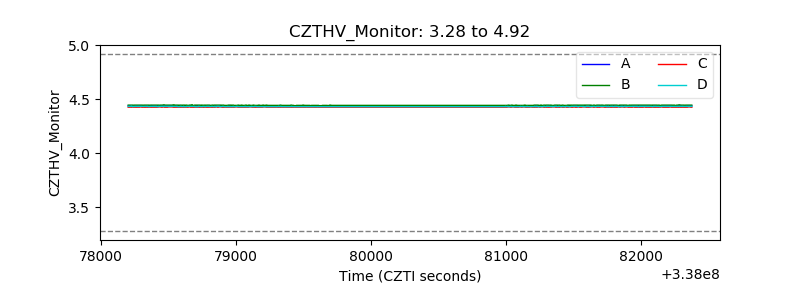 |
| D_VDD | 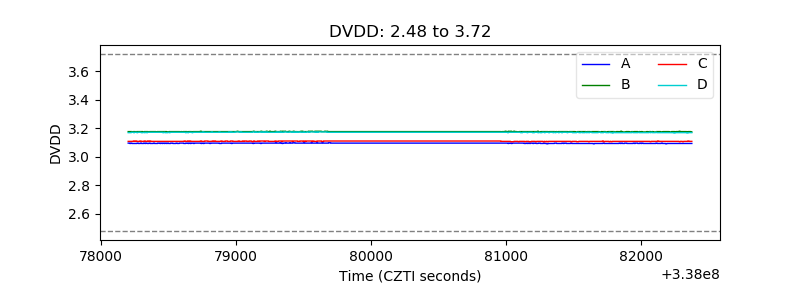 |
| Temperature 1 | 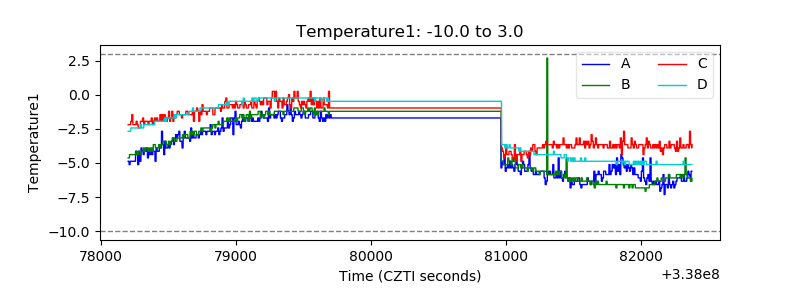 |
| Veto HV Monitor | 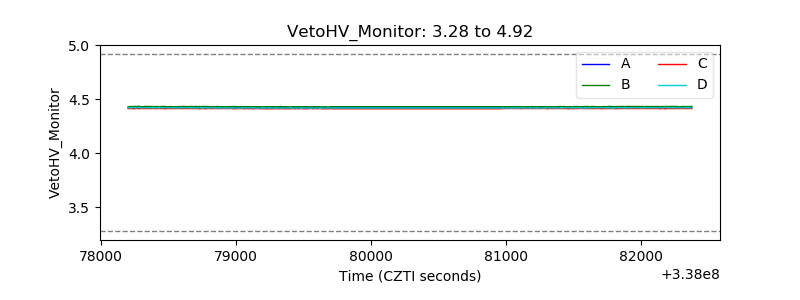 |
| Veto LLD | 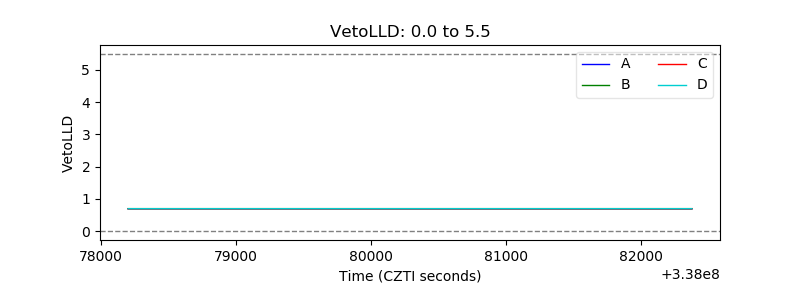 |
| Alpha Counter | 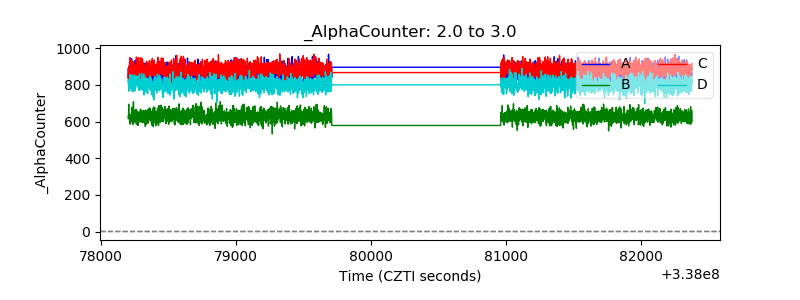 |
| _CPM_Rate | 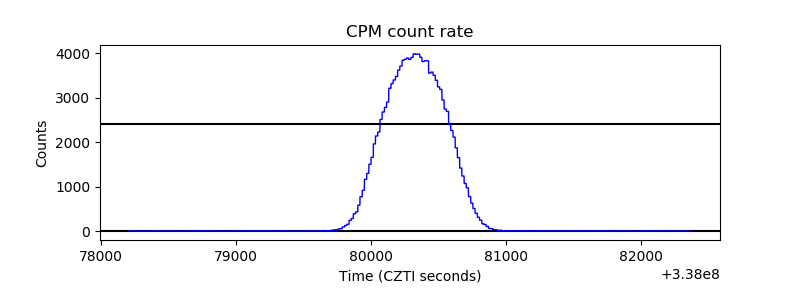 |
| CZT Counter | 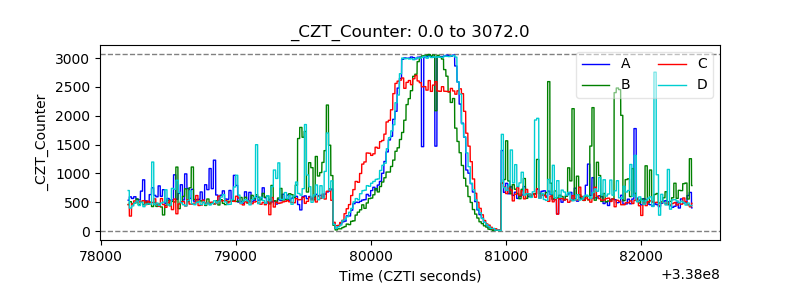 |
| +2.5 Volts monitor | 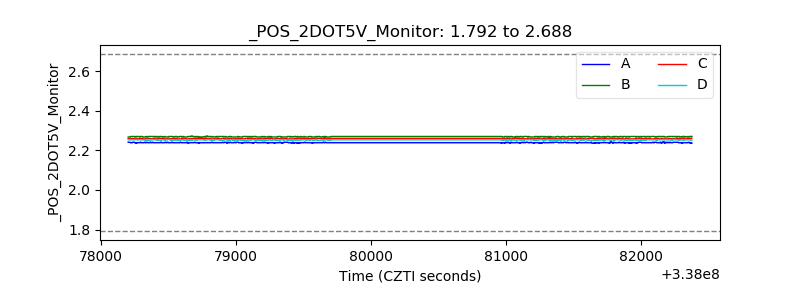 |
| +5 Volts monitor |  |
| _ROLL_ROT | 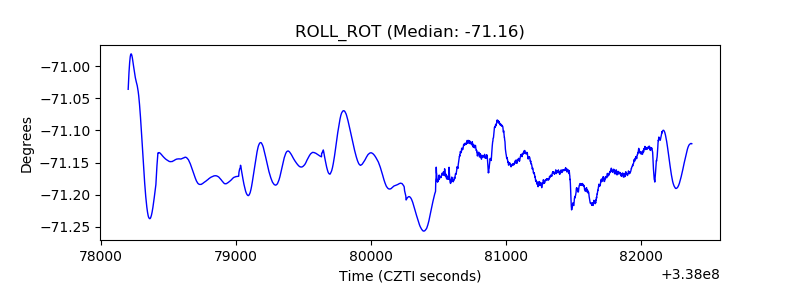 |
| _Roll_DEC | 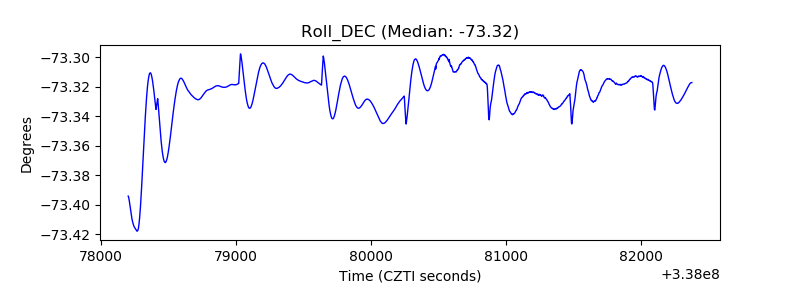 |
| _Roll_RA | 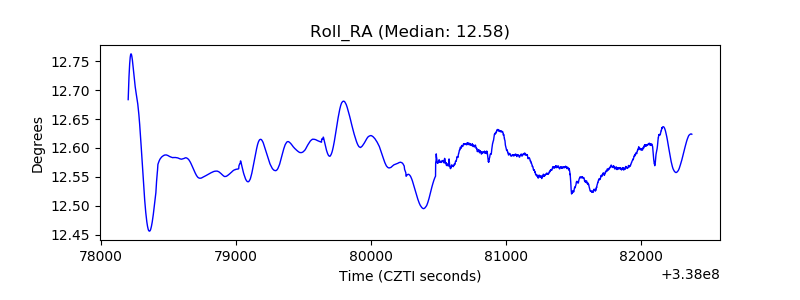 |
| Veto Counter | 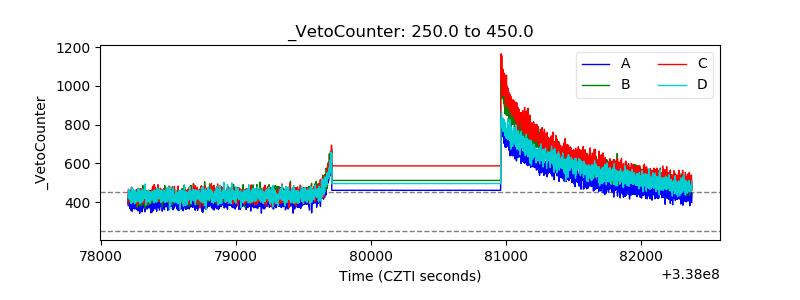 |