| Param | Original file | Final file |
|---|---|---|
| Filename | modeM0/AS1A09_038T17_9000003884_26893cztM0_level2.evt | modeM0/AS1A09_038T17_9000003884_26893cztM0_level2_quad_clean.evt |
| Size (bytes) | 523,607,040 | 136,039,680 |
| Size | 499.4 MB | 129.7 MB |
| Events in quadrant A | 3,682,225 | 913,044 |
| Events in quadrant B | 4,247,080 | 946,553 |
| Events in quadrant C | 3,435,038 | 926,942 |
| Events in quadrant D | 4,056,858 | 885,082 |
| Mode M0 | |||
|---|---|---|---|
| Quadrant | BADHDUFLAG | Total packets | Discarded packets |
| A | 0 | 14927 | 0 |
| B | 0 | 16725 | 0 |
| C | 0 | 14049 | 0 |
| D | 0 | 16205 | 0 |
| Mode M9 | |||
|---|---|---|---|
| Quadrant | BADHDUFLAG | Total packets | Discarded packets |
| A | 0 | 21 | 0 |
| B | 0 | 22 | 0 |
| C | 0 | 22 | 0 |
| D | 0 | 22 | 0 |
| Quadrant | Total seconds | Saturated seconds | Saturation percentage |
|---|---|---|---|
| A | 6438 | 35 | 0.543647% |
| B | 6438 | 220 | 3.417210% |
| C | 6438 | 51 | 0.792171% |
| D | 6438 | 123 | 1.910531% |
Noise dominated data is calculated using 1-second bins in cleaned event files. If a bin has >2000 counts, and if more than 50% of those come from <1% of pixels, then it is considered to be noise-dominated and hence unusable.
| Quadrant | # 1 sec bins | Bins with >0 counts | Bins with >2000 counts | High rate bins dominated by noise | Noise dominated (total time) | Noise dominated (detector-on time) | Marked lightcurve |
|---|---|---|---|---|---|---|---|
| A | 7773 | 6439 | 8 | 8 | 0.10% | 0.12% | 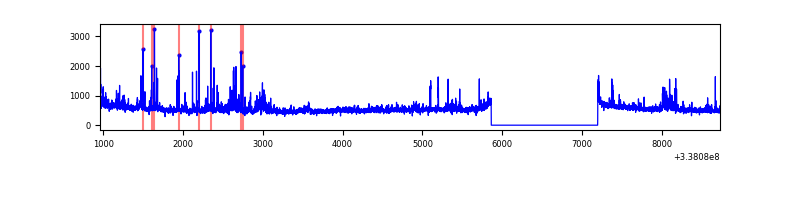 |
| B | 7773 | 6438 | 113 | 113 | 1.45% | 1.76% | 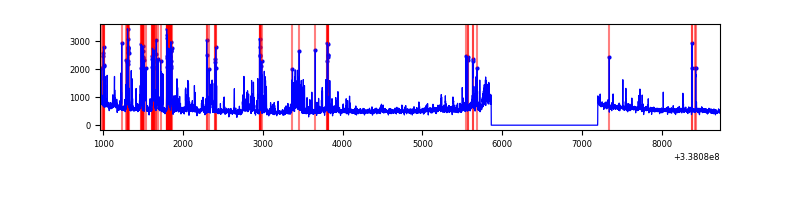 |
| C | 7773 | 6439 | 0 | 0 | 0.00% | 0.00% | 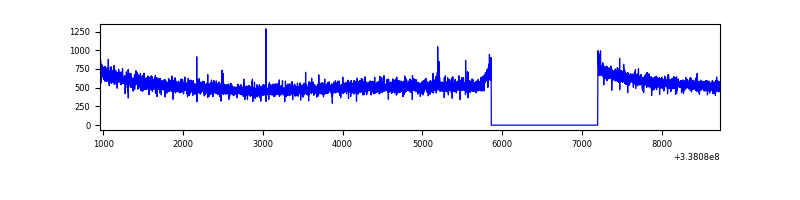 |
| D | 7773 | 6438 | 111 | 111 | 1.43% | 1.72% | 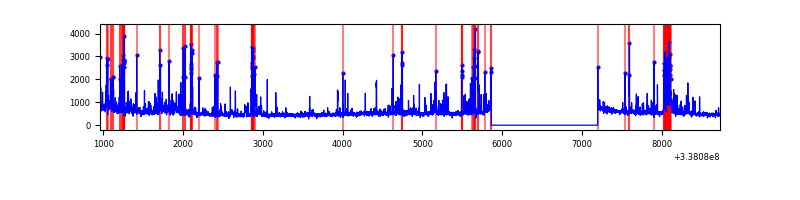 |
Top three noisy pixels from each quadrant. If the there are fewer than three noisy pixels in the level2.evt file, extra rows are filled as -1
| Pixel properties | Quadrant properties | ||||||
|---|---|---|---|---|---|---|---|
| Quadrant | DetID | PixID | Counts | Sigma | Mean | Median | Sigma |
| A | 0 | 13 | 288313 | 1737.94 | 842 | 828 | 165.4 |
| A | 6 | 16 | 144828 | 870.53 | 842 | 828 | 165.4 |
| A | 13 | 254 | 10319 | 57.38 | 842 | 828 | 165.4 |
| B | 3 | 64 | 734778 | 4718.59 | 850 | 831 | 155.5 |
| B | 0 | 190 | 114973 | 733.83 | 850 | 831 | 155.5 |
| B | 10 | 246 | 75126 | 477.65 | 850 | 831 | 155.5 |
| C | 14 | 238 | 137936 | 702.11 | 845 | 851 | 195.2 |
| C | 15 | 208 | 6654 | 29.72 | 845 | 851 | 195.2 |
| C | 13 | 61 | 5691 | 24.79 | 845 | 851 | 195.2 |
| D | 1 | 52 | 492684 | 2578.93 | 822 | 805 | 190.7 |
| D | 11 | 176 | 261923 | 1369.04 | 822 | 805 | 190.7 |
| D | 2 | 250 | 101107 | 525.88 | 822 | 805 | 190.7 |
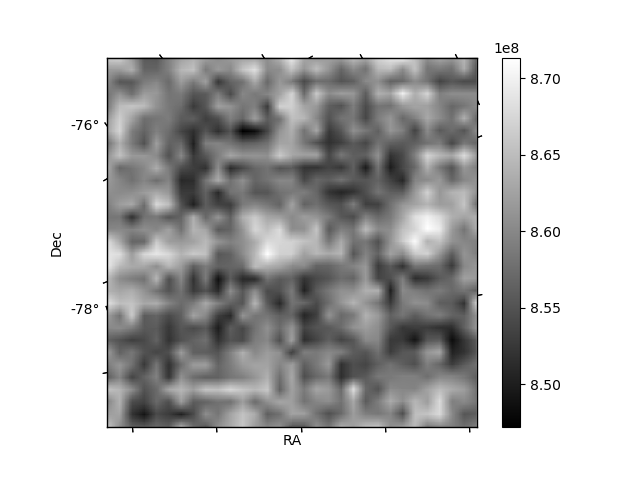
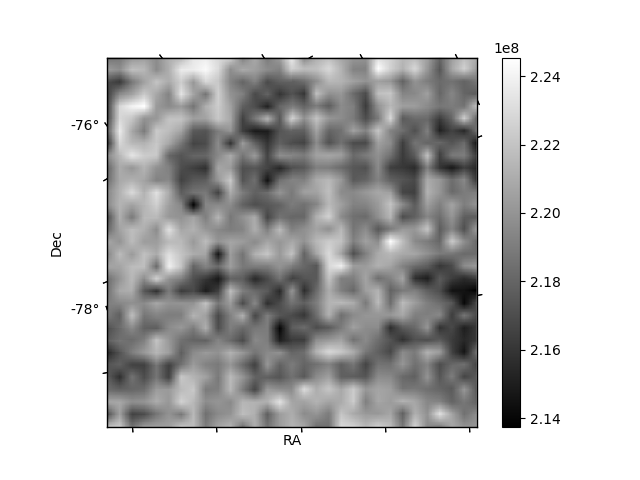
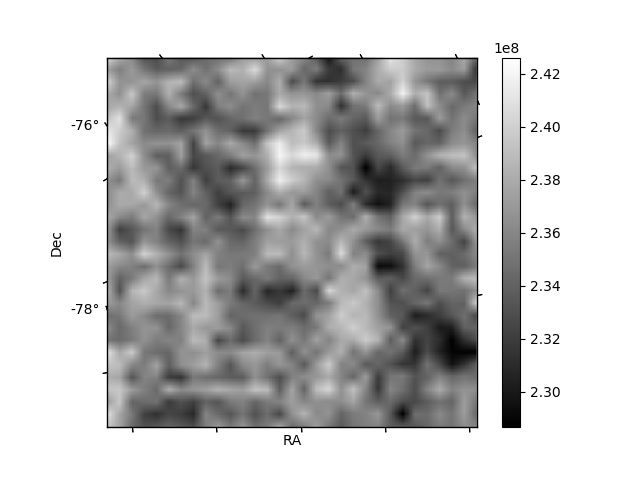
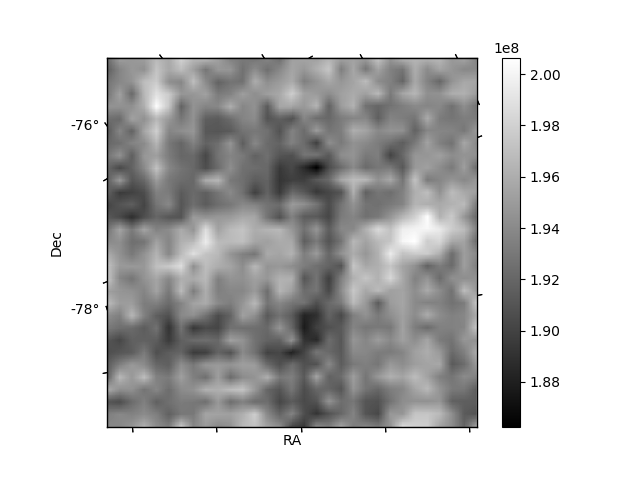
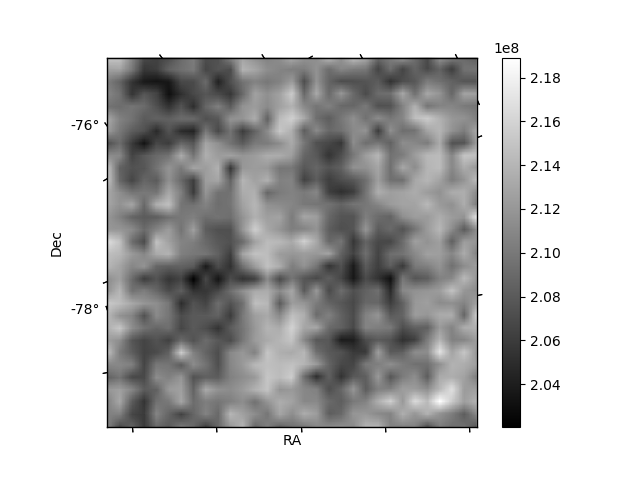
Histogram calculated using DETX and DETY for each event in the final _common_clean file
| Quadrant A | 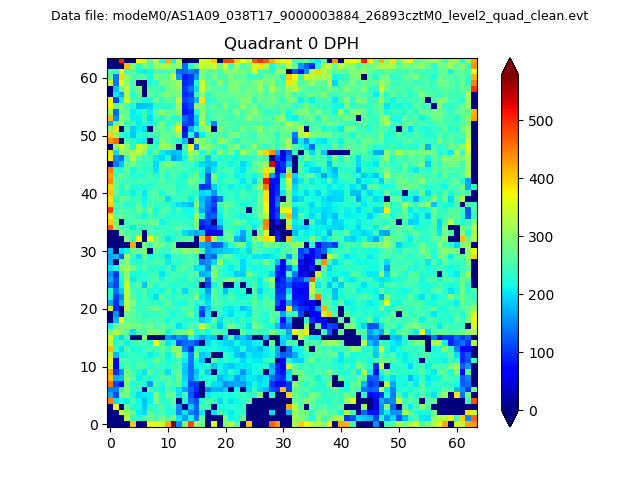 |
 |
Quadrant B |
|---|---|---|---|
| Quadrant D | 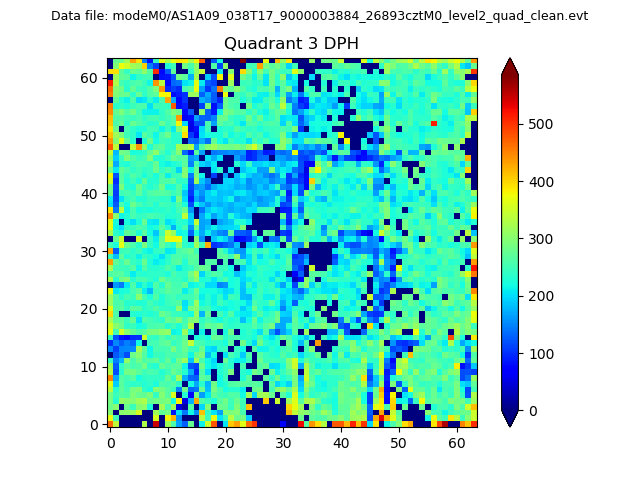 |
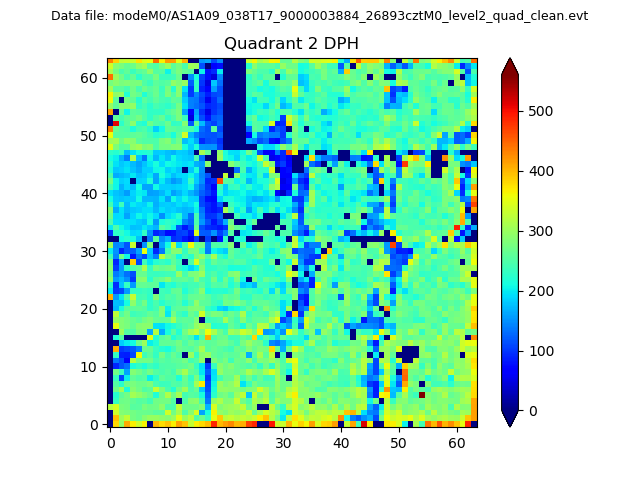 |
Quadrant C |
| Plot type | Count rate plots | Images |
|---|---|---|
| Comparison with Poisson distribution Blue bars denote a histogram of data divided into 1 sec bins. Red curve is a Poisson curve with rate = median count rate of data. |
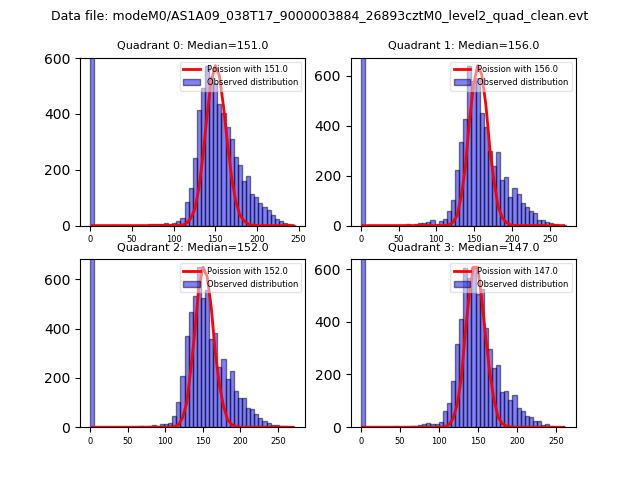 |
 |
| Quadrant-wise count rates Data is divided into 100 sec bins |
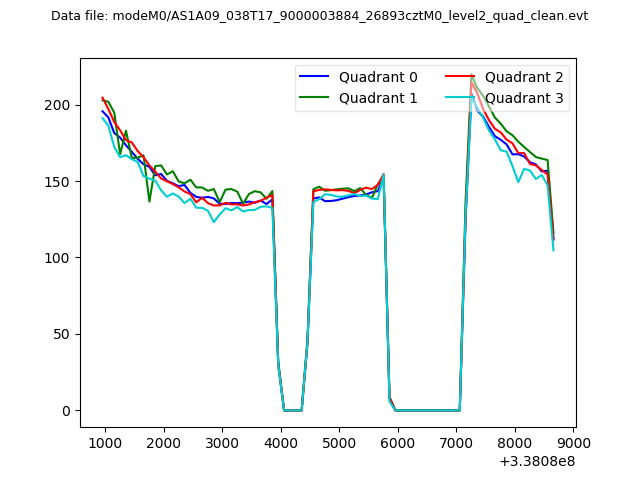 |
|
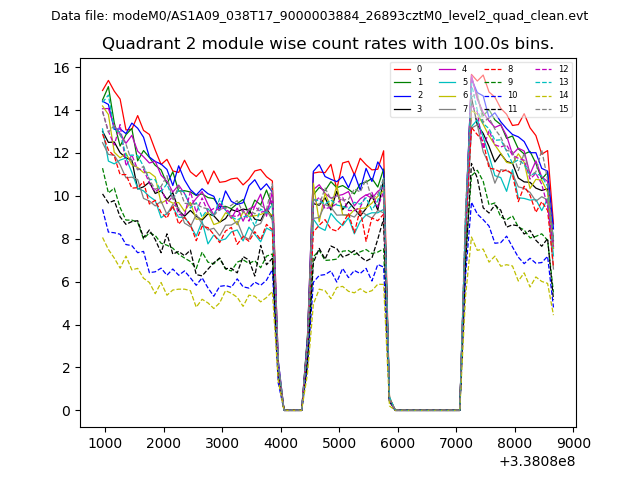
| Module-wise count rates for Quadrant A Data is divided into 100 sec bins |
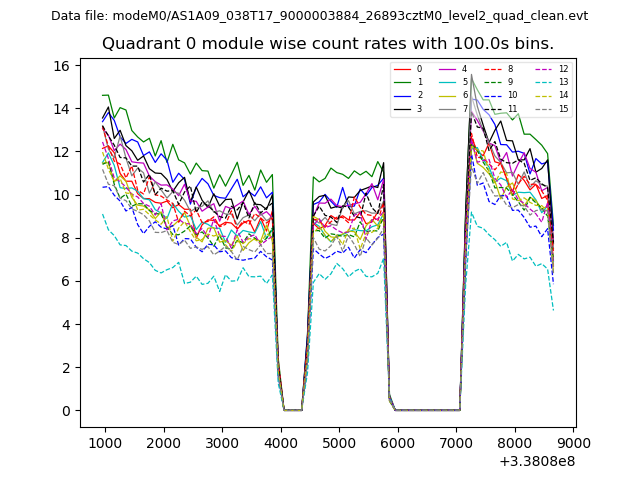 |
 |
| Module-wise count rates for Quadrant B Data is divided into 100 sec bins |
 |
 |
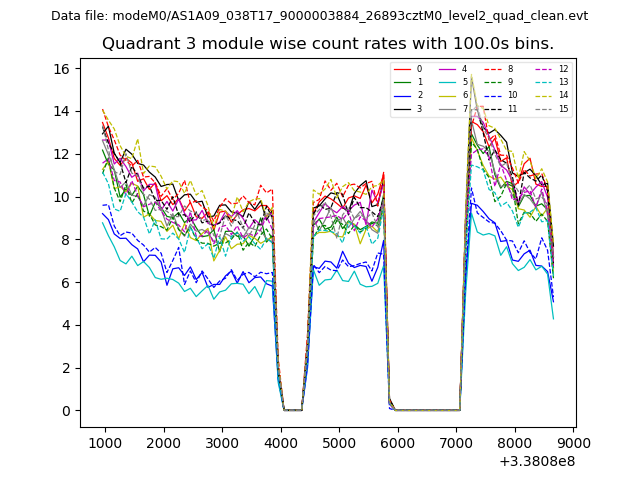
| Module-wise count rates for Quadrant C Data is divided into 100 sec bins |
 |
 |
| Module-wise count rates for Quadrant D Data is divided into 100 sec bins |
 |
 |
| Parameter | Plot |
|---|---|
| CZT HV Monitor | 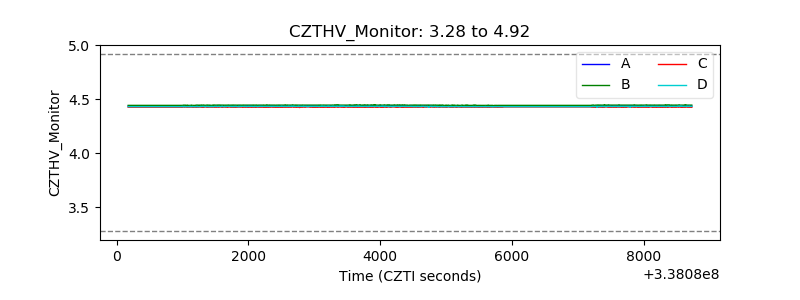 |
| D_VDD | 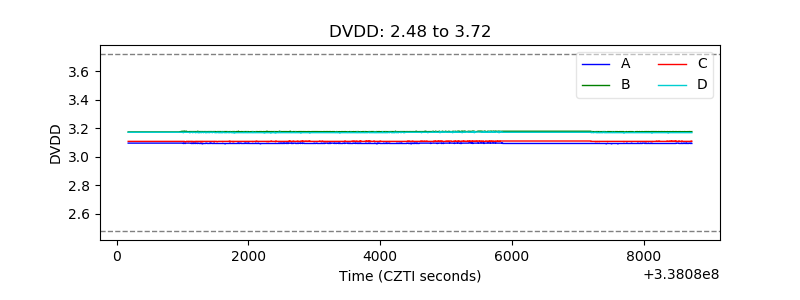 |
| Temperature 1 | 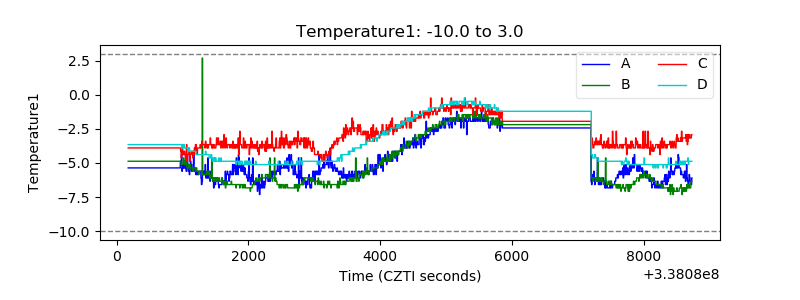 |
| Veto HV Monitor | 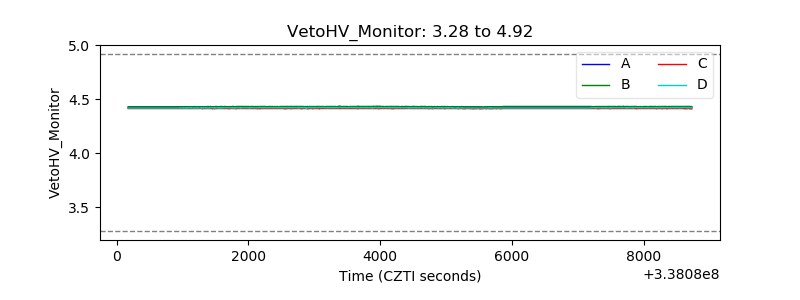 |
| Veto LLD | 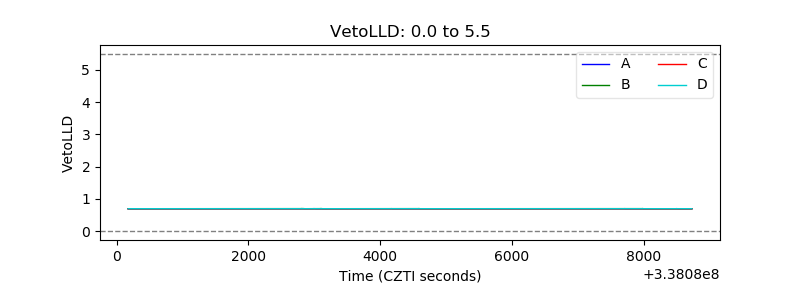 |
| Alpha Counter | 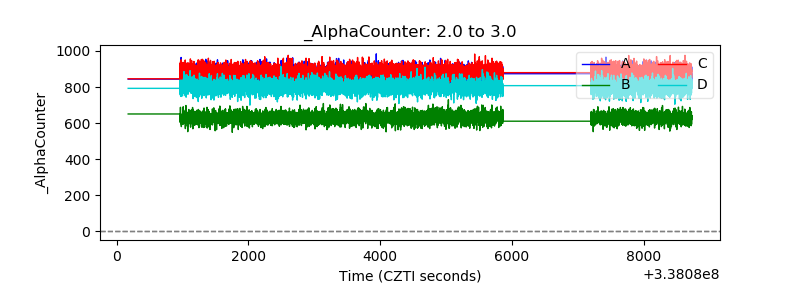 |
| _CPM_Rate | 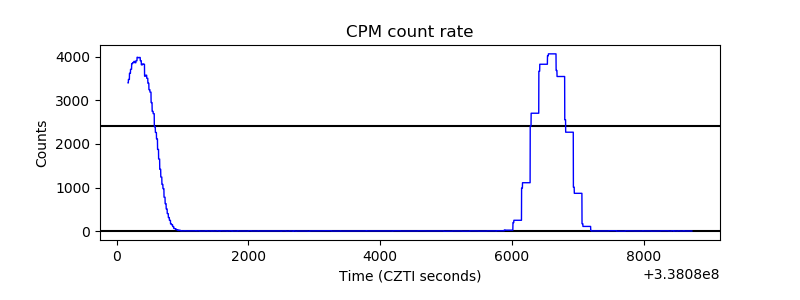 |
| CZT Counter | 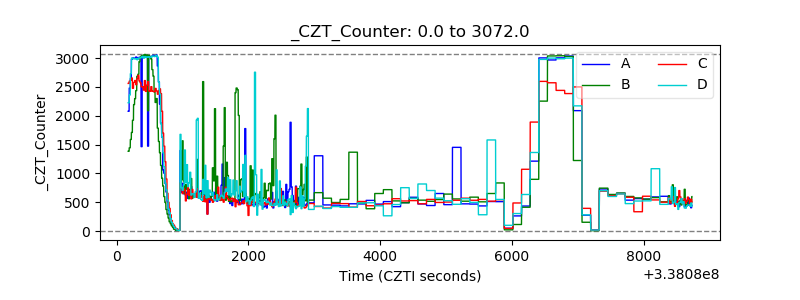 |
| +2.5 Volts monitor |  |
| +5 Volts monitor |  |
| _ROLL_ROT | 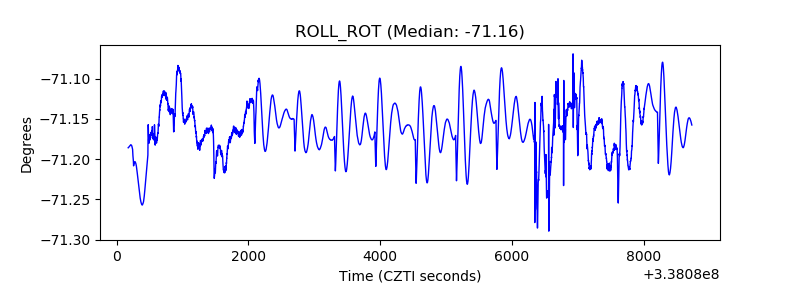 |
| _Roll_DEC | 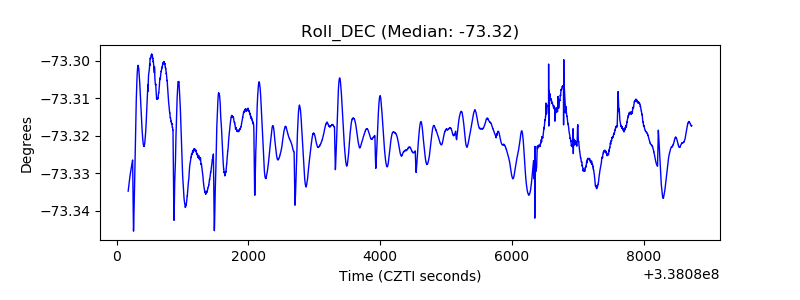 |
| _Roll_RA | 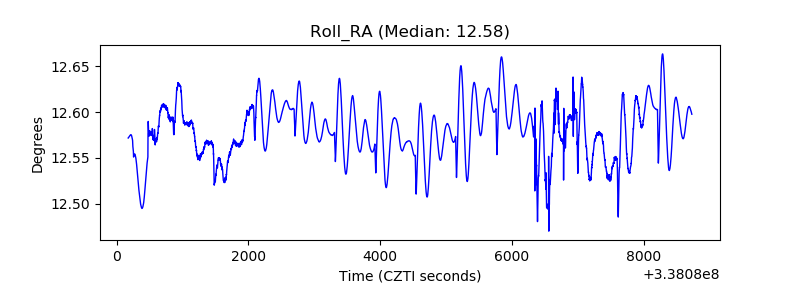 |
| Veto Counter | 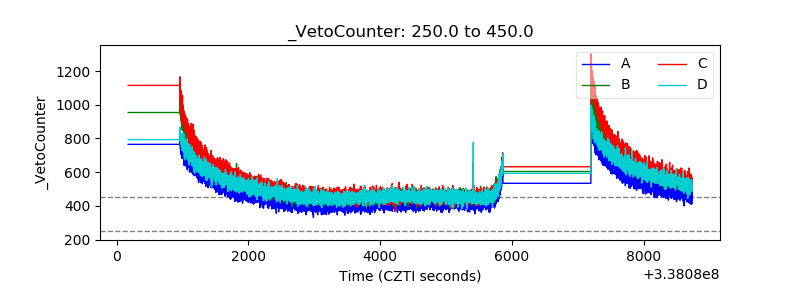 |