| Param | Original file | Final file |
|---|---|---|
| Filename | modeM0/AS1A09_038T17_9000003884_26894cztM0_level2.evt | modeM0/AS1A09_038T17_9000003884_26894cztM0_level2_quad_clean.evt |
| Size (bytes) | 493,755,840 | 139,599,360 |
| Size | 470.9 MB | 133.1 MB |
| Events in quadrant A | 3,645,678 | 934,282 |
| Events in quadrant B | 3,511,799 | 981,177 |
| Events in quadrant C | 3,537,452 | 953,857 |
| Events in quadrant D | 3,827,978 | 916,339 |
| Mode M0 | |||
|---|---|---|---|
| Quadrant | BADHDUFLAG | Total packets | Discarded packets |
| A | 0 | 14689 | 0 |
| B | 0 | 14284 | 0 |
| C | 0 | 14236 | 0 |
| D | 0 | 15340 | 0 |
| Mode M9 | |||
|---|---|---|---|
| Quadrant | BADHDUFLAG | Total packets | Discarded packets |
| A | 0 | 20 | 0 |
| B | 0 | 21 | 0 |
| C | 0 | 21 | 0 |
| D | 0 | 21 | 0 |
| Quadrant | Total seconds | Saturated seconds | Saturation percentage |
|---|---|---|---|
| A | 6350 | 28 | 0.440945% |
| B | 6350 | 55 | 0.866142% |
| C | 6350 | 79 | 1.244094% |
| D | 6350 | 104 | 1.637795% |
Noise dominated data is calculated using 1-second bins in cleaned event files. If a bin has >2000 counts, and if more than 50% of those come from <1% of pixels, then it is considered to be noise-dominated and hence unusable.
| Quadrant | # 1 sec bins | Bins with >0 counts | Bins with >2000 counts | High rate bins dominated by noise | Noise dominated (total time) | Noise dominated (detector-on time) | Marked lightcurve |
|---|---|---|---|---|---|---|---|
| A | 7740 | 6351 | 4 | 4 | 0.05% | 0.06% | 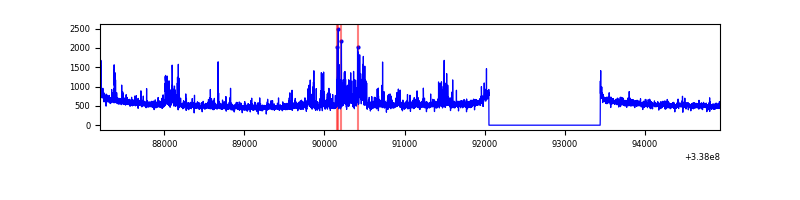 |
| B | 7740 | 6351 | 5 | 5 | 0.06% | 0.08% | 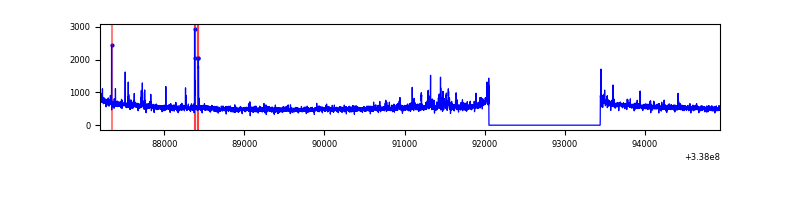 |
| C | 7740 | 6351 | 2 | 2 | 0.03% | 0.03% | 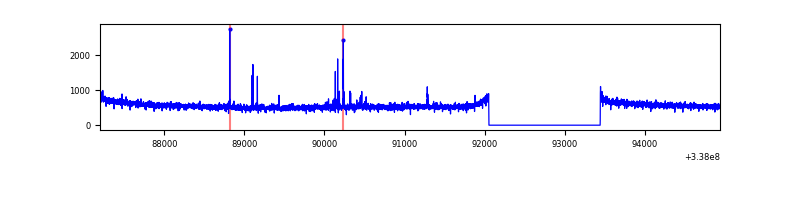 |
| D | 7740 | 6351 | 79 | 79 | 1.02% | 1.24% | 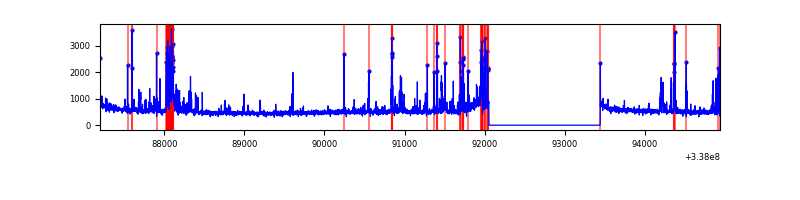 |
Top three noisy pixels from each quadrant. If the there are fewer than three noisy pixels in the level2.evt file, extra rows are filled as -1
| Pixel properties | Quadrant properties | ||||||
|---|---|---|---|---|---|---|---|
| Quadrant | DetID | PixID | Counts | Sigma | Mean | Median | Sigma |
| A | 0 | 13 | 358207 | 2141.36 | 852 | 839 | 166.9 |
| A | 13 | 254 | 9780 | 53.57 | 852 | 839 | 166.9 |
| A | 0 | 226 | 7130 | 37.7 | 852 | 839 | 166.9 |
| B | 3 | 64 | 67676 | 424.5 | 866 | 847 | 157.4 |
| B | 0 | 190 | 61145 | 383.01 | 866 | 847 | 157.4 |
| B | 12 | 111 | 17951 | 108.64 | 866 | 847 | 157.4 |
| C | 14 | 238 | 140487 | 709.31 | 861 | 870 | 196.8 |
| C | 15 | 208 | 24541 | 120.26 | 861 | 870 | 196.8 |
| C | 14 | 176 | 18821 | 91.2 | 861 | 870 | 196.8 |
| D | 1 | 52 | 280511 | 1435.34 | 844 | 827 | 194.9 |
| D | 11 | 176 | 228857 | 1170.25 | 844 | 827 | 194.9 |
| D | 2 | 250 | 88027 | 447.51 | 844 | 827 | 194.9 |
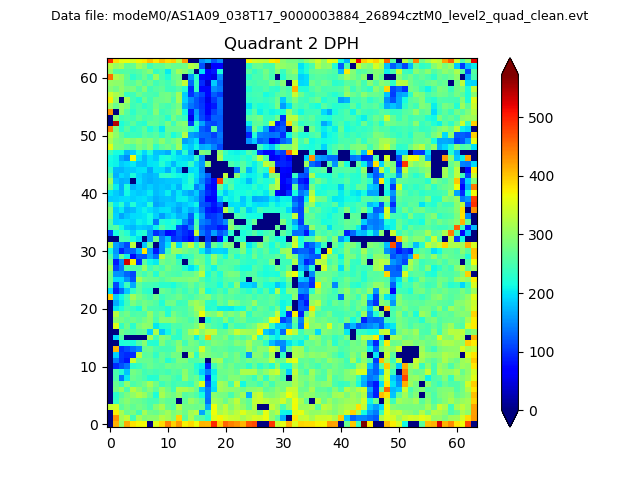
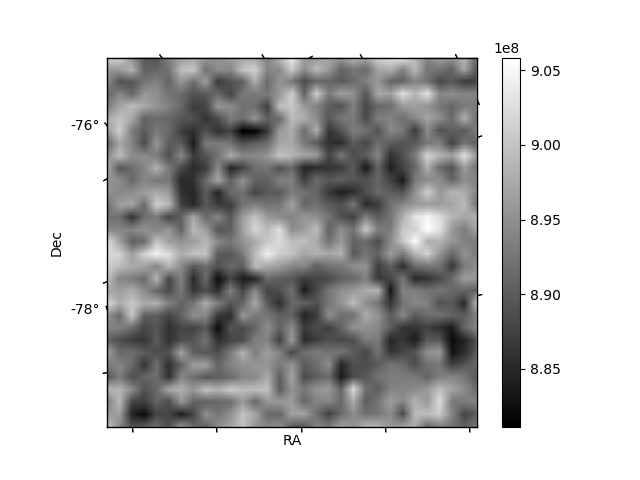
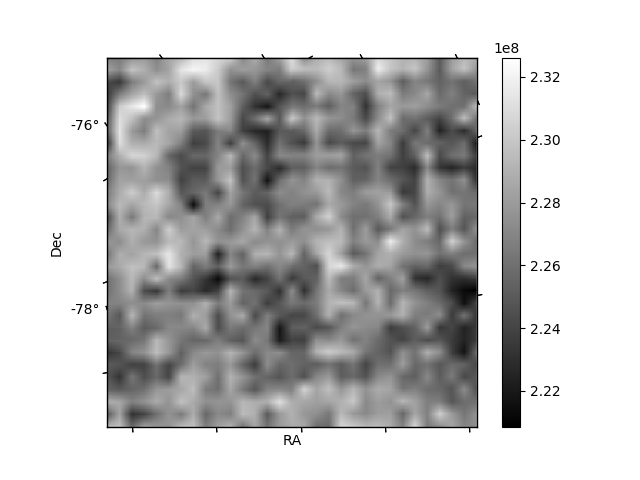
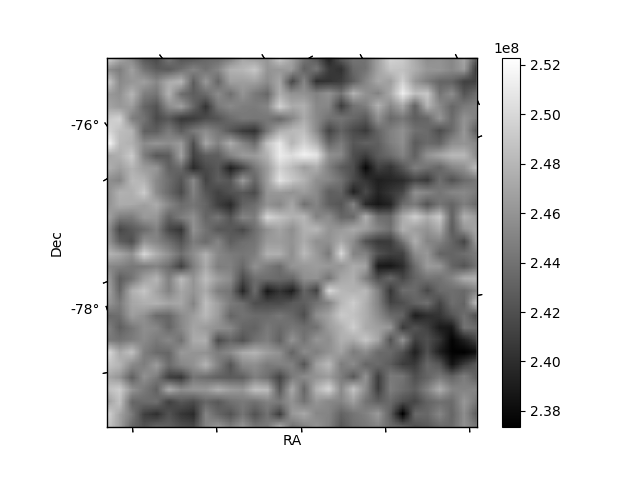
Histogram calculated using DETX and DETY for each event in the final _common_clean file
| Quadrant A | 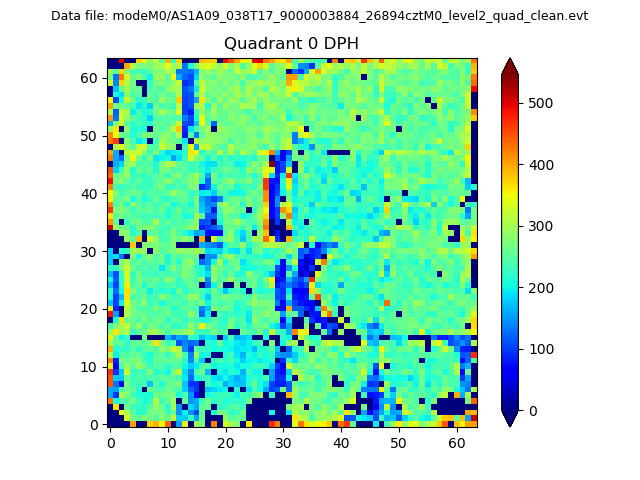 |
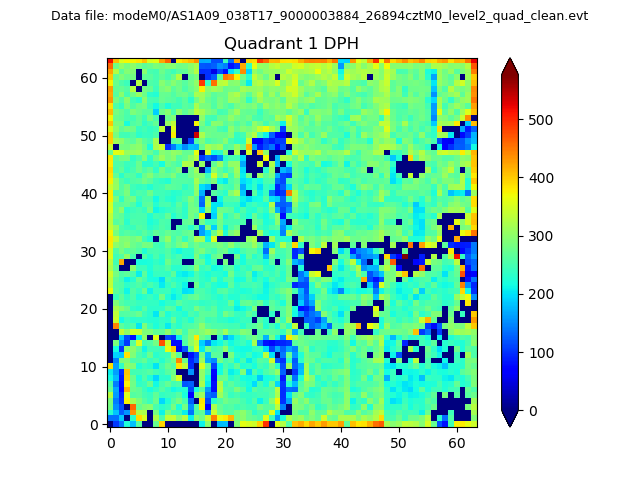 |
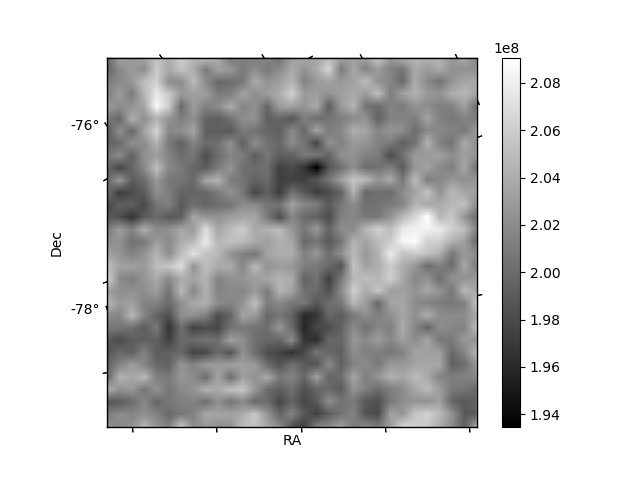
Quadrant B |
|---|---|---|---|
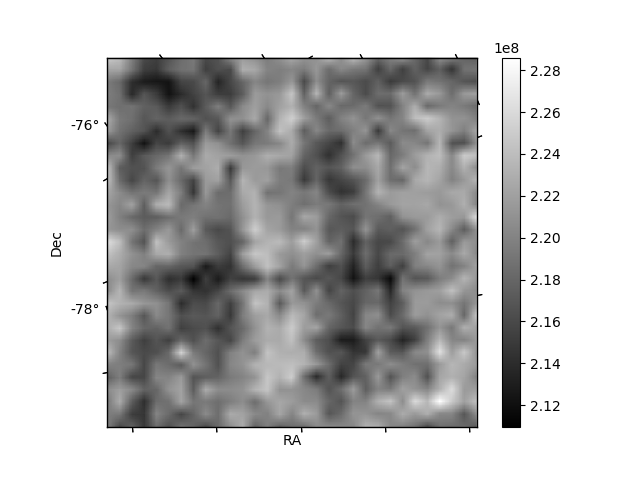
| Quadrant D | 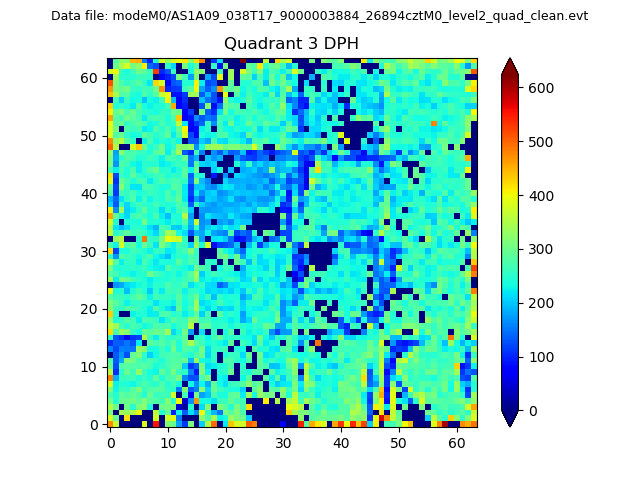 |
 |
Quadrant C |
| Plot type | Count rate plots | Images |
|---|---|---|
| Comparison with Poisson distribution Blue bars denote a histogram of data divided into 1 sec bins. Red curve is a Poisson curve with rate = median count rate of data. |
 |
 |
| Quadrant-wise count rates Data is divided into 100 sec bins |
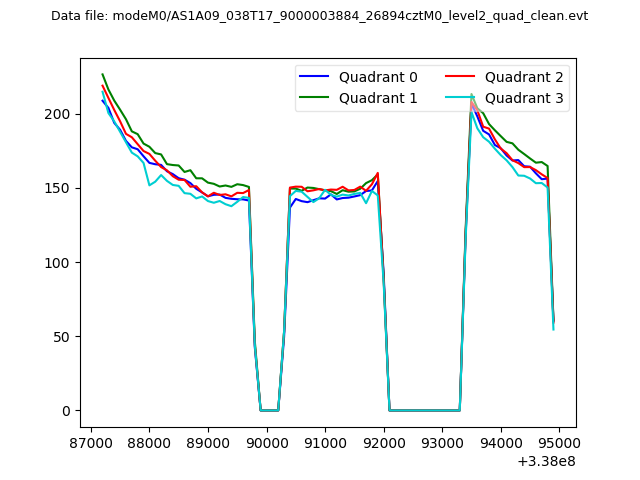 |
|
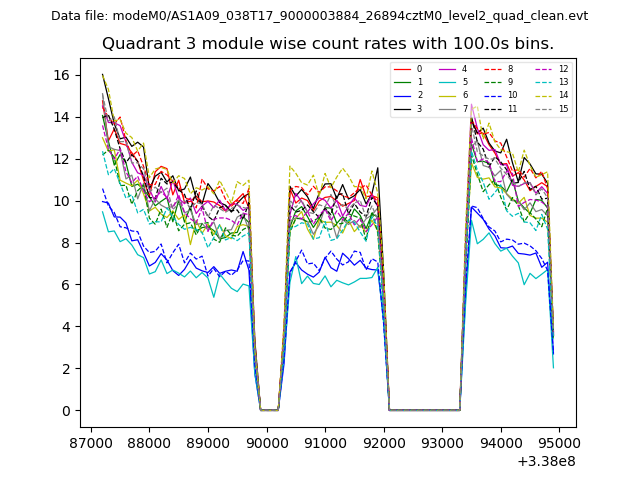
| Module-wise count rates for Quadrant A Data is divided into 100 sec bins |
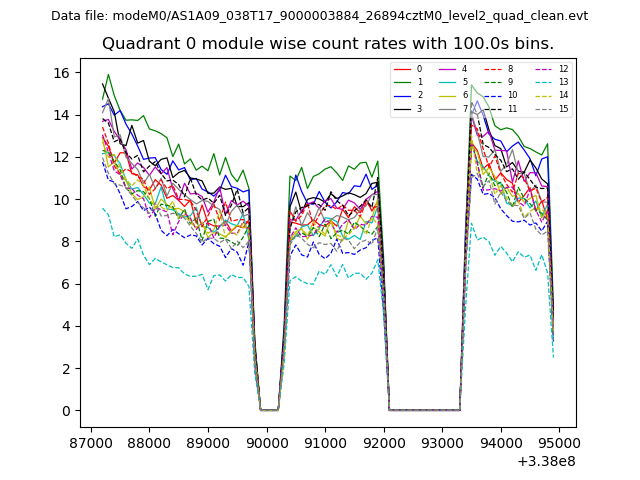 |
 |
| Module-wise count rates for Quadrant B Data is divided into 100 sec bins |
 |
 |
| Module-wise count rates for Quadrant C Data is divided into 100 sec bins |
 |
 |
| Module-wise count rates for Quadrant D Data is divided into 100 sec bins |
 |
 |
| Parameter | Plot |
|---|---|
| CZT HV Monitor |  |
| D_VDD | 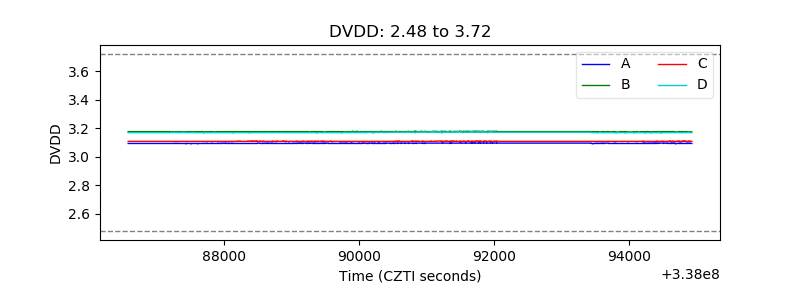 |
| Temperature 1 | 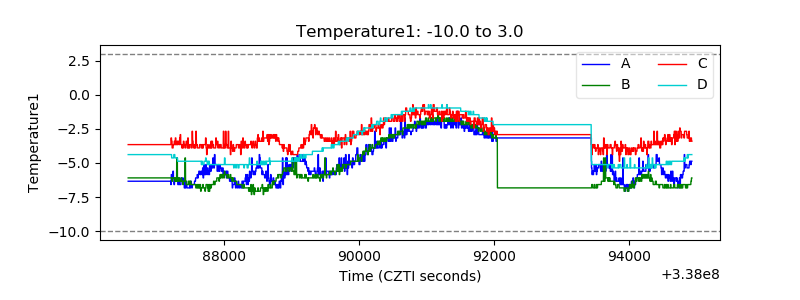 |
| Veto HV Monitor | 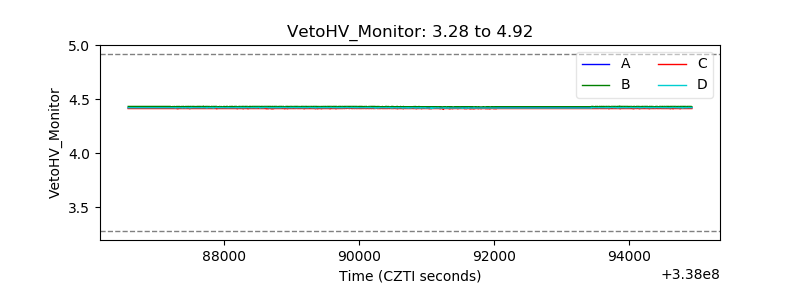 |
| Veto LLD | 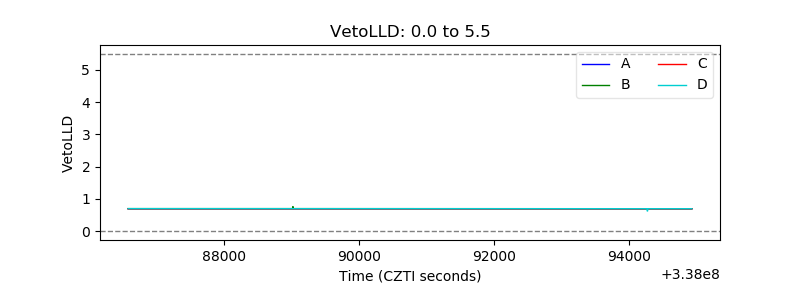 |
| Alpha Counter | 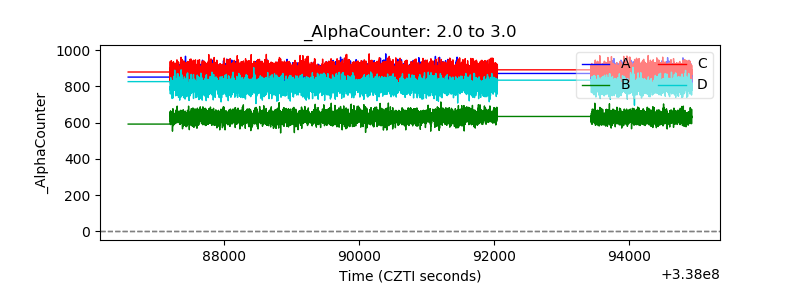 |
| _CPM_Rate | 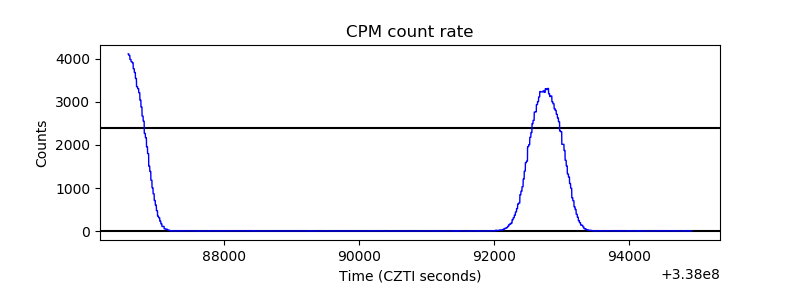 |
| CZT Counter | 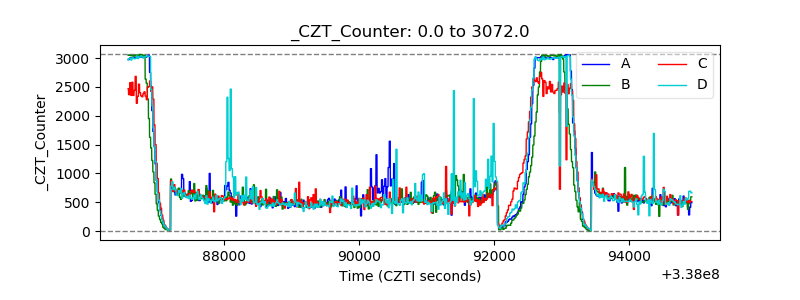 |
| +2.5 Volts monitor |  |
| +5 Volts monitor |  |
| _ROLL_ROT |  |
| _Roll_DEC | 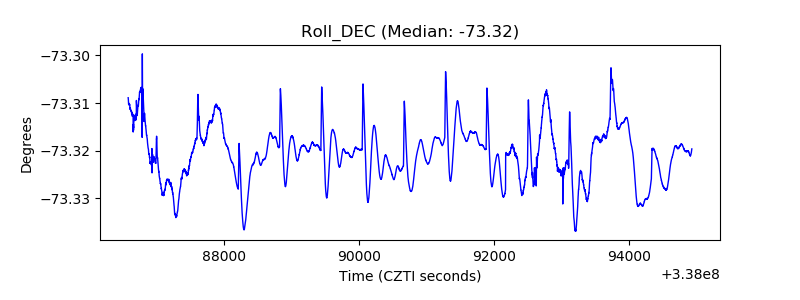 |
| _Roll_RA | 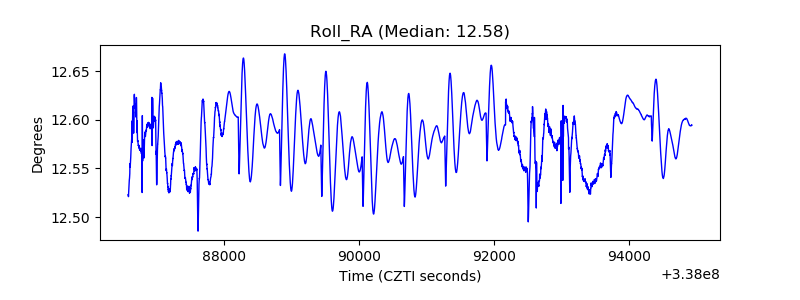 |
| Veto Counter |  |