| Param | Original file | Final file |
|---|---|---|
| Filename | modeM0/AS1A09_038T17_9000003884_26896cztM0_level2.evt | modeM0/AS1A09_038T17_9000003884_26896cztM0_level2_quad_clean.evt |
| Size (bytes) | 528,765,120 | 116,144,640 |
| Size | 504.3 MB | 110.8 MB |
| Events in quadrant A | 3,886,911 | 790,809 |
| Events in quadrant B | 3,937,460 | 764,793 |
| Events in quadrant C | 3,054,084 | 803,563 |
| Events in quadrant D | 4,733,851 | 744,559 |
| Mode M0 | |||
|---|---|---|---|
| Quadrant | BADHDUFLAG | Total packets | Discarded packets |
| A | 0 | 15218 | 0 |
| B | 0 | 15185 | 0 |
| C | 0 | 12401 | 0 |
| D | 0 | 17859 | 0 |
| Mode M9 | |||
|---|---|---|---|
| Quadrant | BADHDUFLAG | Total packets | Discarded packets |
| A | 0 | 12 | 0 |
| B | 0 | 12 | 0 |
| C | 0 | 12 | 0 |
| D | 0 | 12 | 0 |
| Quadrant | Total seconds | Saturated seconds | Saturation percentage |
|---|---|---|---|
| A | 5915 | 95 | 1.606086% |
| B | 5910 | 583 | 9.864636% |
| C | 5918 | 82 | 1.385603% |
| D | 5909 | 495 | 8.377052% |
Noise dominated data is calculated using 1-second bins in cleaned event files. If a bin has >2000 counts, and if more than 50% of those come from <1% of pixels, then it is considered to be noise-dominated and hence unusable.
| Quadrant | # 1 sec bins | Bins with >0 counts | Bins with >2000 counts | High rate bins dominated by noise | Noise dominated (total time) | Noise dominated (detector-on time) | Marked lightcurve |
|---|---|---|---|---|---|---|---|
| A | 7317 | 5923 | 51 | 51 | 0.70% | 0.86% | 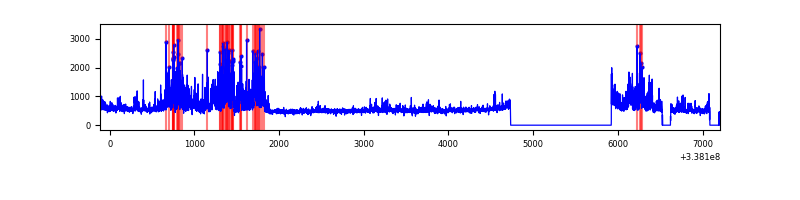 |
| B | 7319 | 5921 | 331 | 331 | 4.52% | 5.59% | 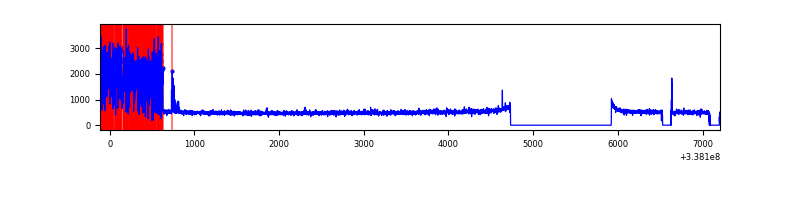 |
| C | 7318 | 5929 | 0 | 0 | 0.00% | 0.00% | 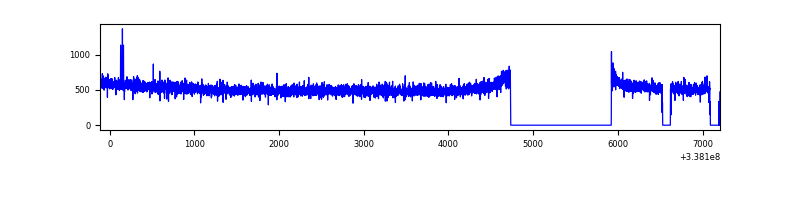 |
| D | 7202 | 5915 | 400 | 400 | 5.55% | 6.76% | 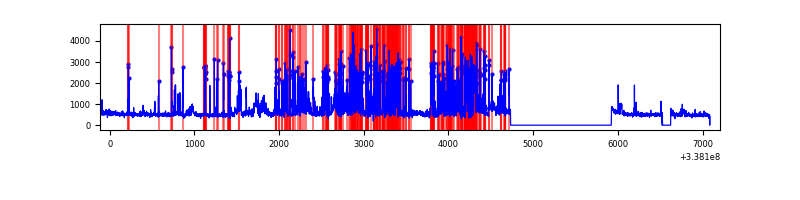 |
Top three noisy pixels from each quadrant. If the there are fewer than three noisy pixels in the level2.evt file, extra rows are filled as -1
| Pixel properties | Quadrant properties | ||||||
|---|---|---|---|---|---|---|---|
| Quadrant | DetID | PixID | Counts | Sigma | Mean | Median | Sigma |
| A | 0 | 13 | 932868 | 6224.29 | 755 | 740 | 149.8 |
| A | 5 | 168 | 40857 | 267.88 | 755 | 740 | 149.8 |
| A | 13 | 254 | 8864 | 54.25 | 755 | 740 | 149.8 |
| B | 3 | 64 | 1120210 | 8446.27 | 714 | 698 | 132.5 |
| B | 12 | 111 | 15310 | 110.24 | 714 | 698 | 132.5 |
| B | 11 | 111 | 13907 | 99.66 | 714 | 698 | 132.5 |
| C | 14 | 238 | 121913 | 702.06 | 750 | 756 | 172.6 |
| C | 15 | 208 | 9272 | 49.35 | 750 | 756 | 172.6 |
| C | 13 | 61 | 5174 | 25.6 | 750 | 756 | 172.6 |
| D | 1 | 52 | 1854239 | 11166.25 | 719 | 704 | 166.0 |
| D | 11 | 176 | 65240 | 388.78 | 719 | 704 | 166.0 |
| D | 2 | 250 | 42490 | 251.73 | 719 | 704 | 166.0 |
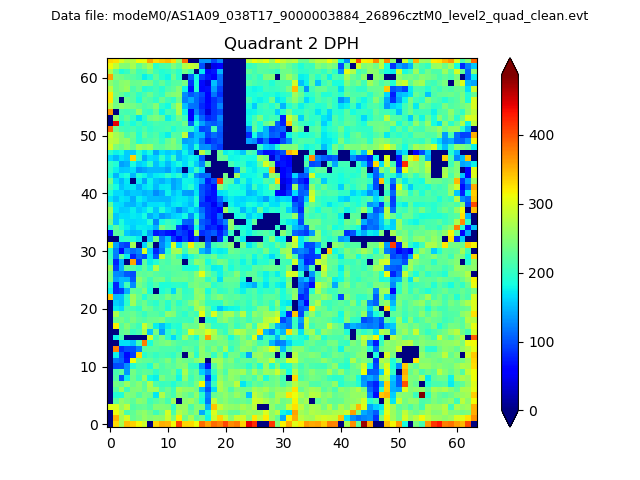
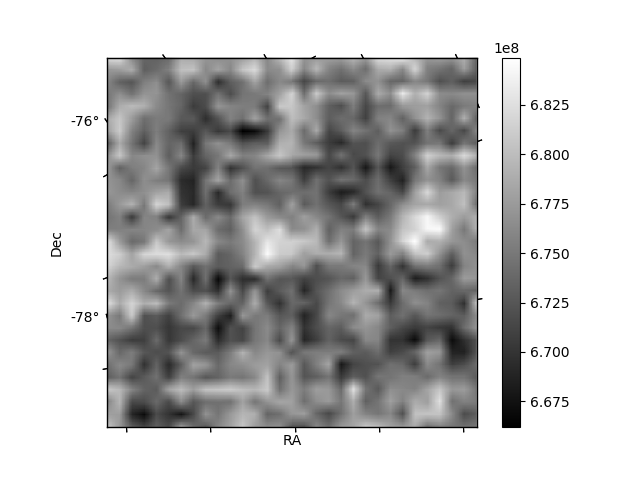
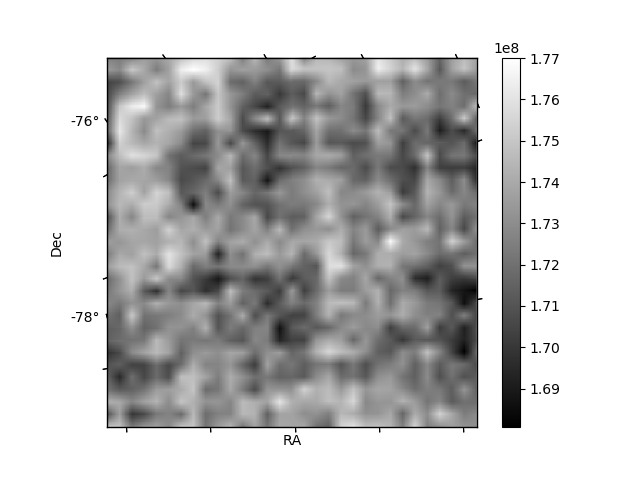
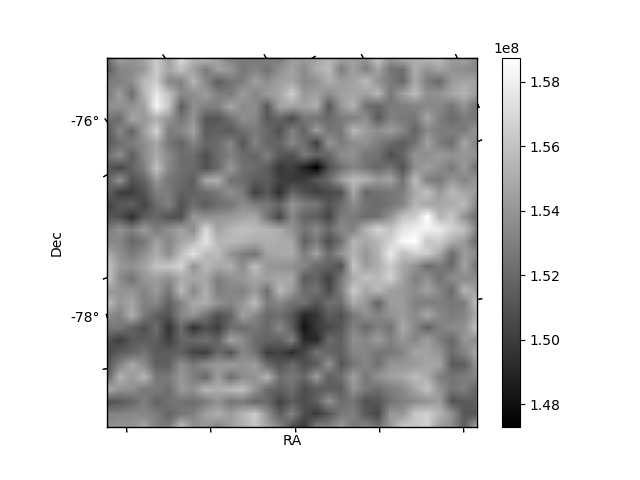
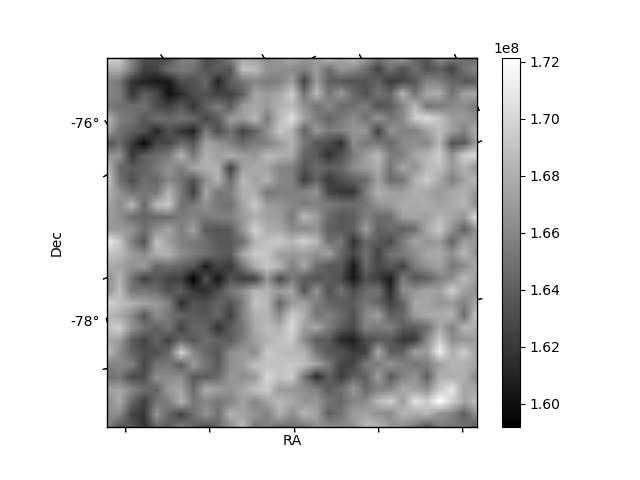
Histogram calculated using DETX and DETY for each event in the final _common_clean file
| Quadrant A | 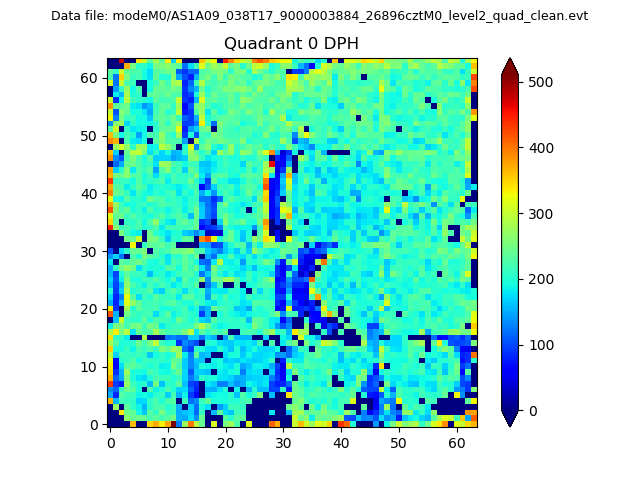 |
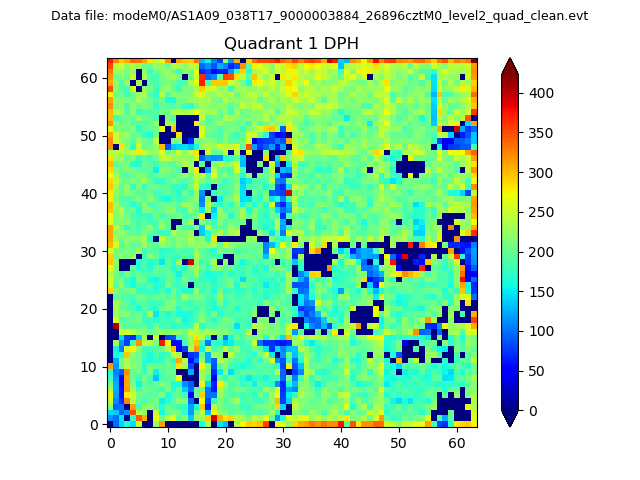 |
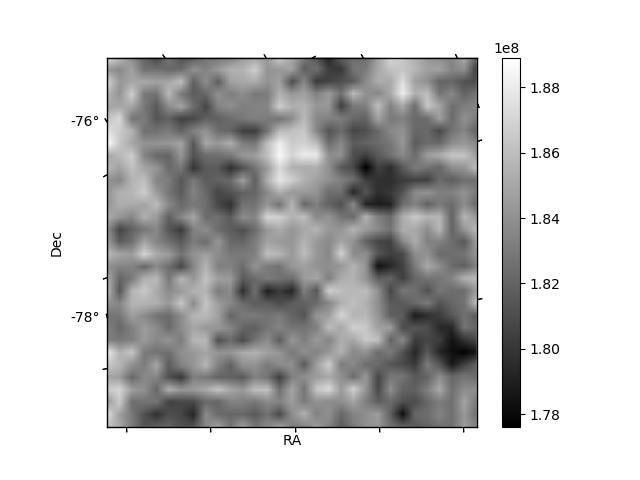
Quadrant B |
|---|---|---|---|
| Quadrant D | 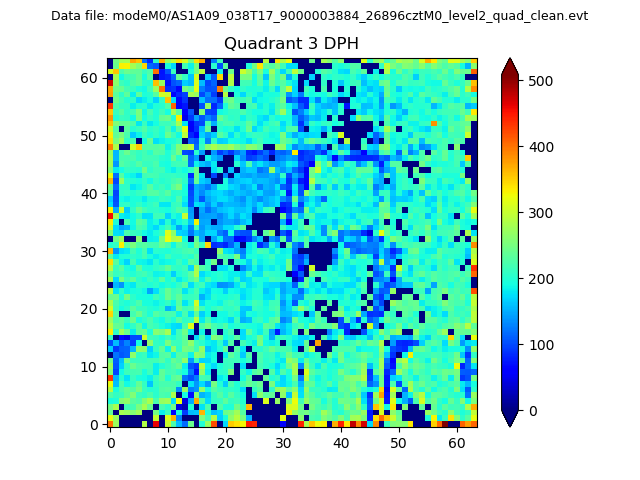 |
 |
Quadrant C |
| Plot type | Count rate plots | Images |
|---|---|---|
| Comparison with Poisson distribution Blue bars denote a histogram of data divided into 1 sec bins. Red curve is a Poisson curve with rate = median count rate of data. |
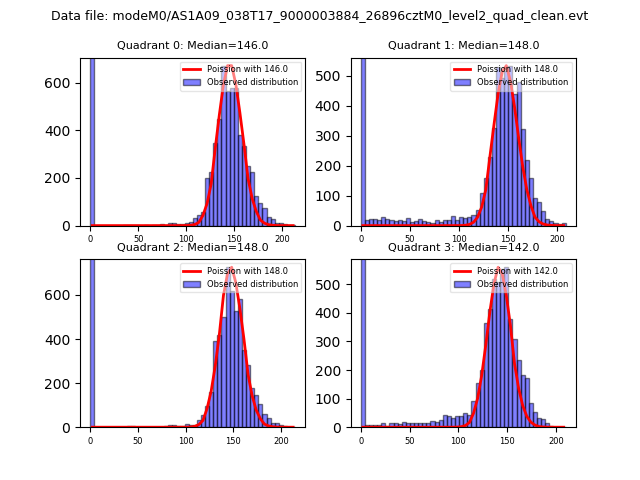 |
 |
| Quadrant-wise count rates Data is divided into 100 sec bins |
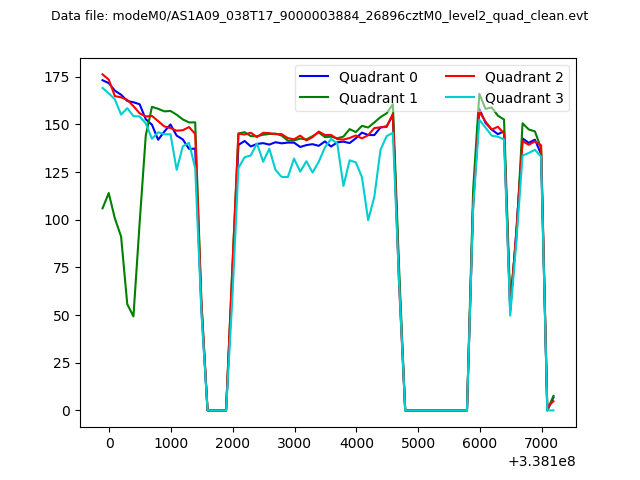 |
|
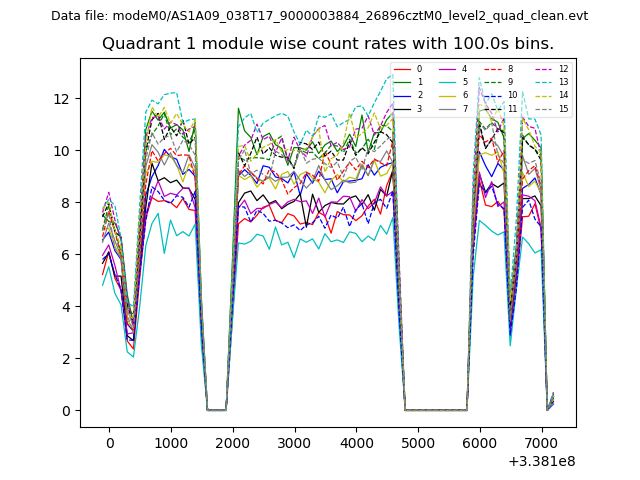
| Module-wise count rates for Quadrant A Data is divided into 100 sec bins |
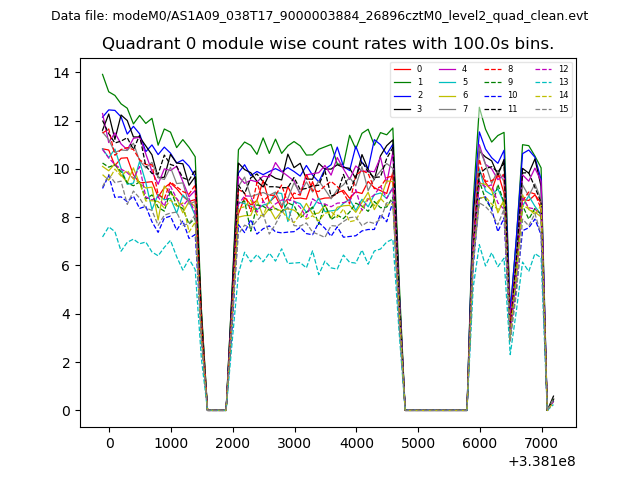 |
 |
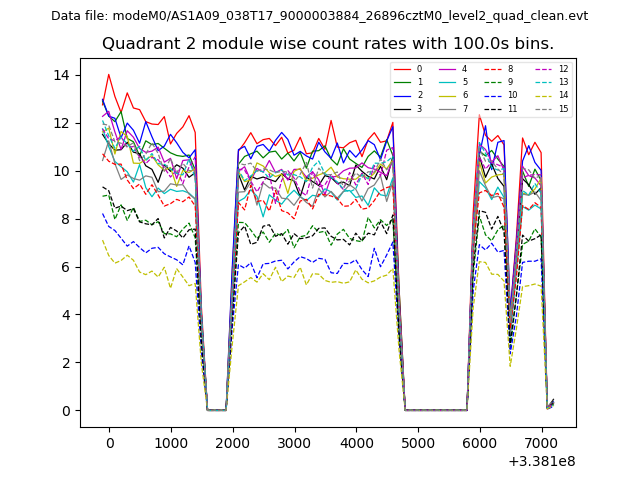
| Module-wise count rates for Quadrant B Data is divided into 100 sec bins |
 |
 |
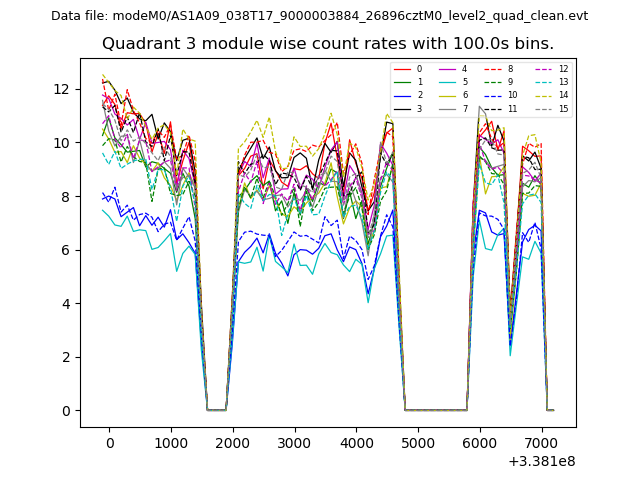
| Module-wise count rates for Quadrant C Data is divided into 100 sec bins |
 |
 |
| Module-wise count rates for Quadrant D Data is divided into 100 sec bins |
 |
 |
| Parameter | Plot |
|---|---|
| CZT HV Monitor | 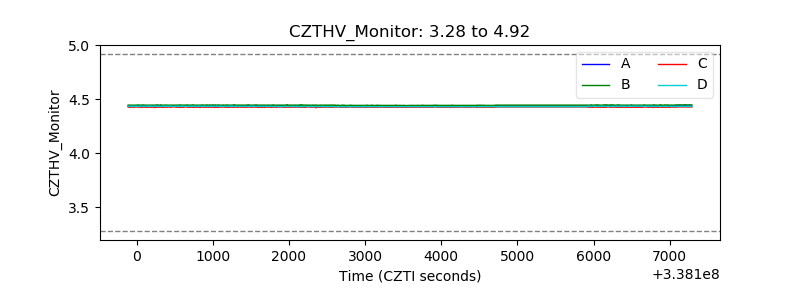 |
| D_VDD | 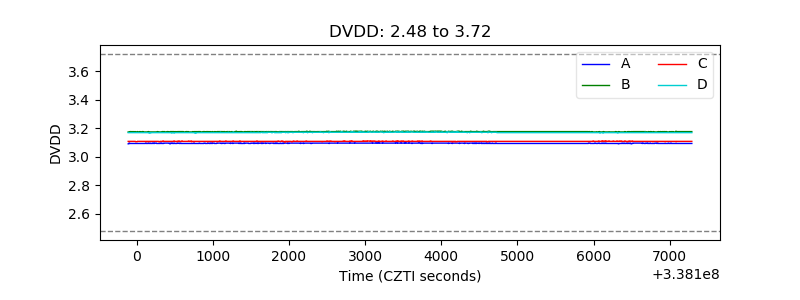 |
| Temperature 1 | 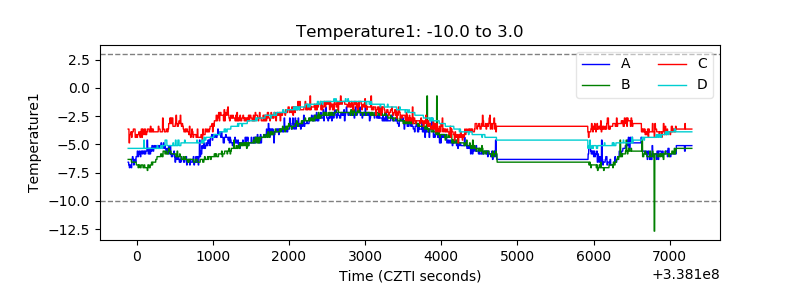 |
| Veto HV Monitor | 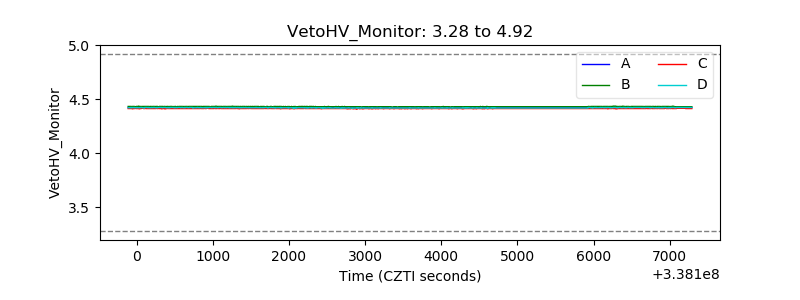 |
| Veto LLD | 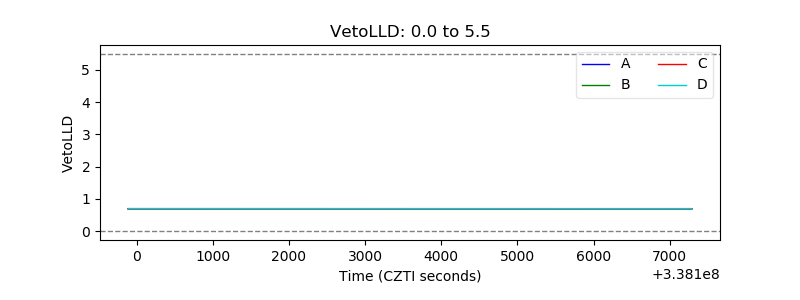 |
| Alpha Counter | 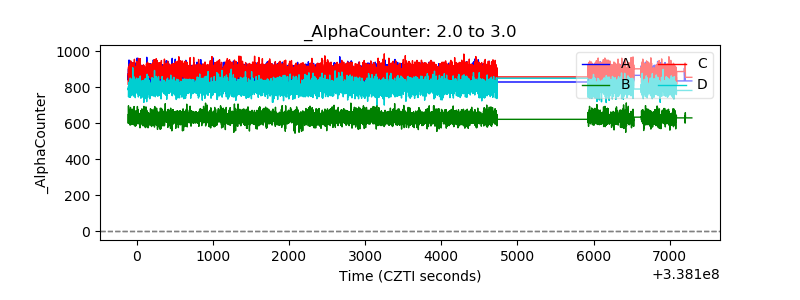 |
| _CPM_Rate | 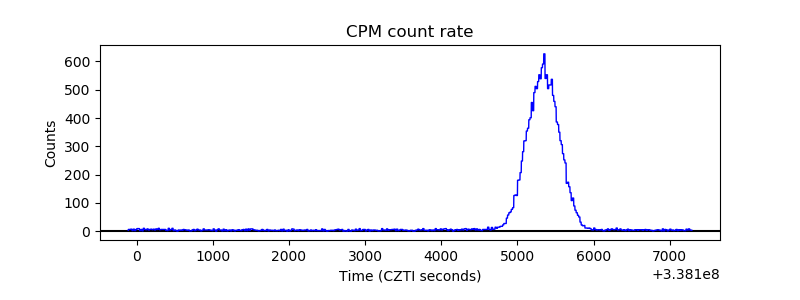 |
| CZT Counter | 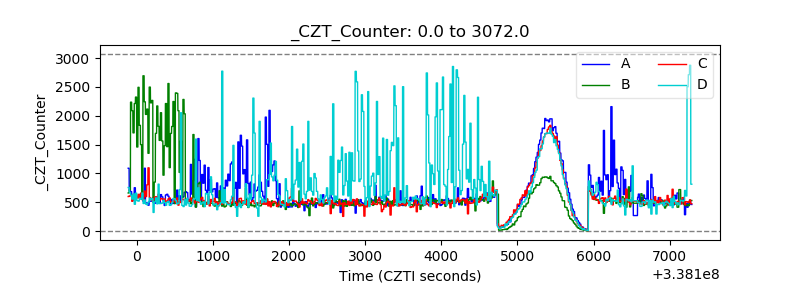 |
| +2.5 Volts monitor |  |
| +5 Volts monitor |  |
| _ROLL_ROT | 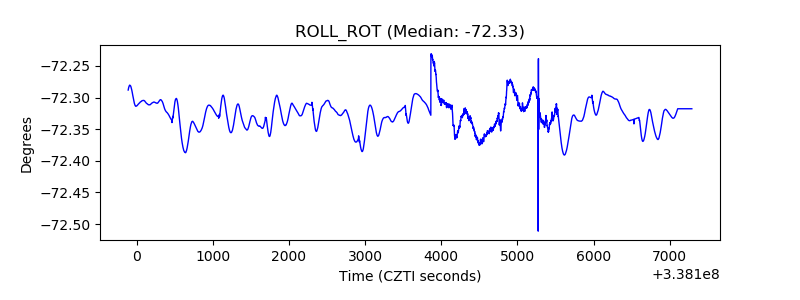 |
| _Roll_DEC | 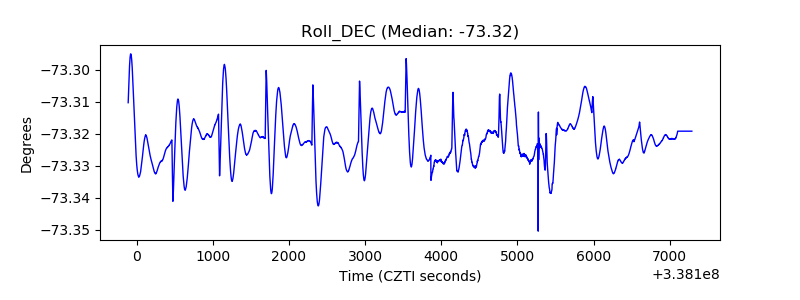 |
| _Roll_RA | 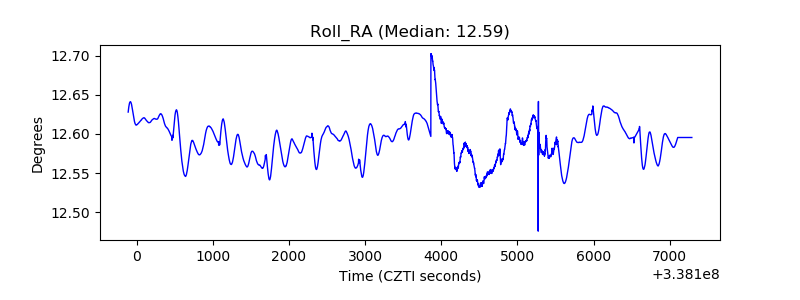 |
| Veto Counter | 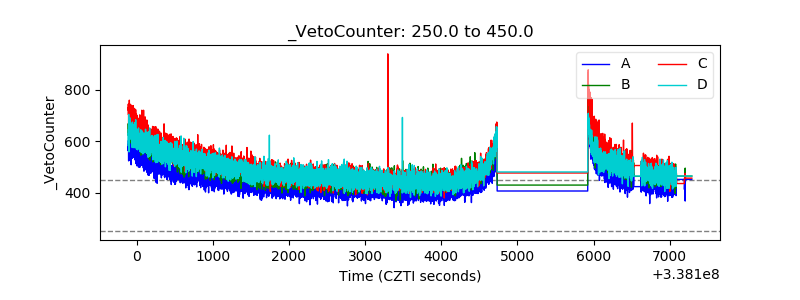 |