| Param | Original file | Final file |
|---|---|---|
| Filename | modeM0/AS1A09_038T17_9000003884_26898cztM0_level2.evt | modeM0/AS1A09_038T17_9000003884_26898cztM0_level2_quad_clean.evt |
| Size (bytes) | 1,543,599,360 | 300,179,520 |
| Size | 1.4 GB | 286.3 MB |
| Events in quadrant A | 9,496,720 | 2,027,167 |
| Events in quadrant B | 9,467,871 | 2,083,164 |
| Events in quadrant C | 8,358,531 | 2,048,560 |
| Events in quadrant D | 18,281,818 | 1,763,561 |
| Mode M0 | |||
|---|---|---|---|
| Quadrant | BADHDUFLAG | Total packets | Discarded packets |
| A | 0 | 38790 | 0 |
| B | 0 | 38584 | 0 |
| C | 0 | 35050 | 0 |
| D | 0 | 65665 | 0 |
| Mode M9 | |||
|---|---|---|---|
| Quadrant | BADHDUFLAG | Total packets | Discarded packets |
| A | 0 | 23 | 0 |
| B | 0 | 23 | 0 |
| C | 0 | 23 | 0 |
| D | 0 | 23 | 0 |
| Quadrant | Total seconds | Saturated seconds | Saturation percentage |
|---|---|---|---|
| A | 16949 | 397 | 2.342321% |
| B | 16950 | 537 | 3.168142% |
| C | 16950 | 440 | 2.595870% |
| D | 16950 | 3644 | 21.498525% |
Noise dominated data is calculated using 1-second bins in cleaned event files. If a bin has >2000 counts, and if more than 50% of those come from <1% of pixels, then it is considered to be noise-dominated and hence unusable.
| Quadrant | # 1 sec bins | Bins with >0 counts | Bins with >2000 counts | High rate bins dominated by noise | Noise dominated (total time) | Noise dominated (detector-on time) | Marked lightcurve |
|---|---|---|---|---|---|---|---|
| A | 19214 | 16950 | 50 | 50 | 0.26% | 0.29% | 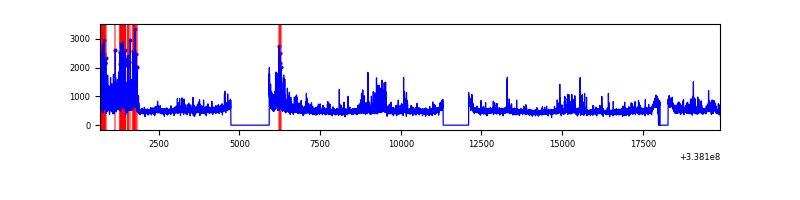 |
| B | 19215 | 16951 | 110 | 110 | 0.57% | 0.65% | 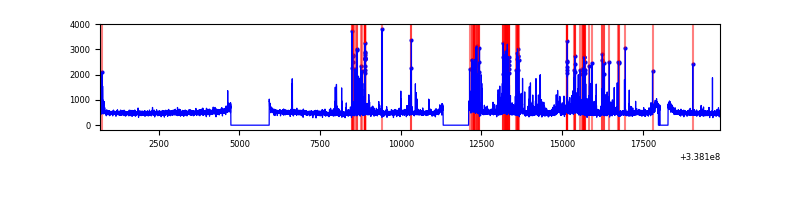 |
| C | 19215 | 16951 | 3 | 3 | 0.02% | 0.02% | 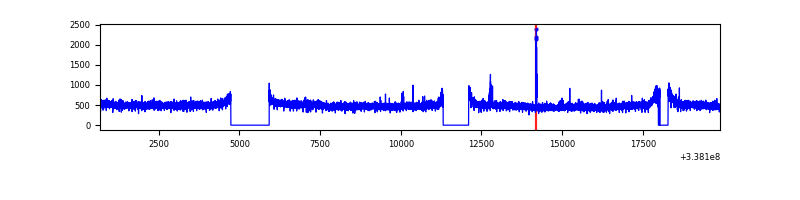 |
| D | 19215 | 16952 | 3071 | 3071 | 15.98% | 18.12% | 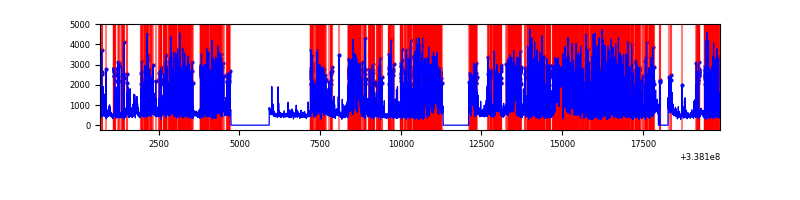 |
Top three noisy pixels from each quadrant. If the there are fewer than three noisy pixels in the level2.evt file, extra rows are filled as -1
| Pixel properties | Quadrant properties | ||||||
|---|---|---|---|---|---|---|---|
| Quadrant | DetID | PixID | Counts | Sigma | Mean | Median | Sigma |
| A | 0 | 13 | 1218926 | 2928.06 | 2093 | 2052 | 415.6 |
| A | 5 | 168 | 133067 | 315.25 | 2093 | 2052 | 415.6 |
| A | 6 | 16 | 82133 | 192.69 | 2093 | 2052 | 415.6 |
| B | 10 | 245 | 763060 | 1957.23 | 2082 | 2024 | 388.8 |
| B | 0 | 190 | 267351 | 682.37 | 2082 | 2024 | 388.8 |
| B | 3 | 64 | 233266 | 594.71 | 2082 | 2024 | 388.8 |
| C | 14 | 238 | 330311 | 698.81 | 2051 | 2066 | 469.7 |
| C | 15 | 208 | 32503 | 64.8 | 2051 | 2066 | 469.7 |
| C | 13 | 61 | 14015 | 25.44 | 2051 | 2066 | 469.7 |
| D | 1 | 52 | 7813842 | 18107.82 | 1863 | 1823 | 431.4 |
| D | 7 | 80 | 2817856 | 6527.41 | 1863 | 1823 | 431.4 |
| D | 11 | 176 | 405125 | 934.83 | 1863 | 1823 | 431.4 |
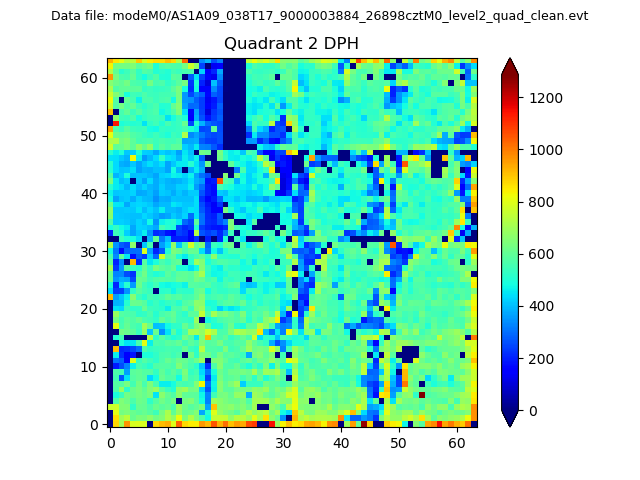
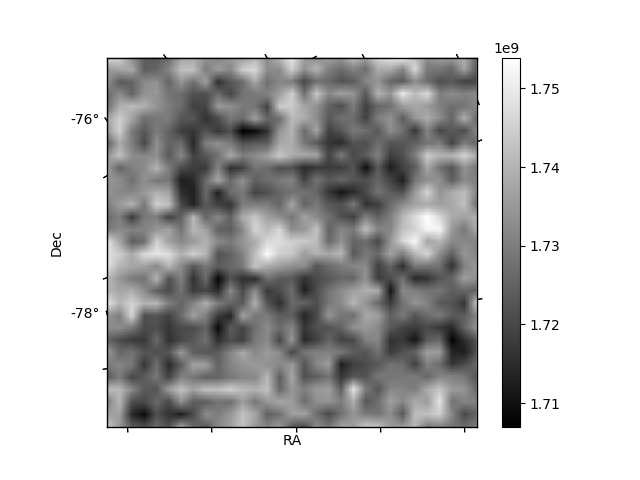
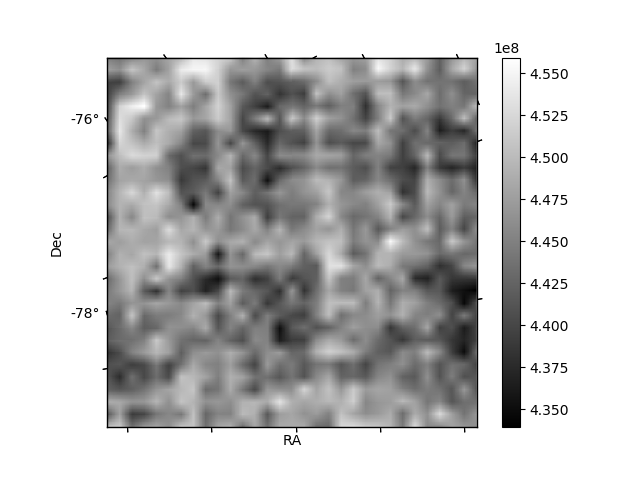
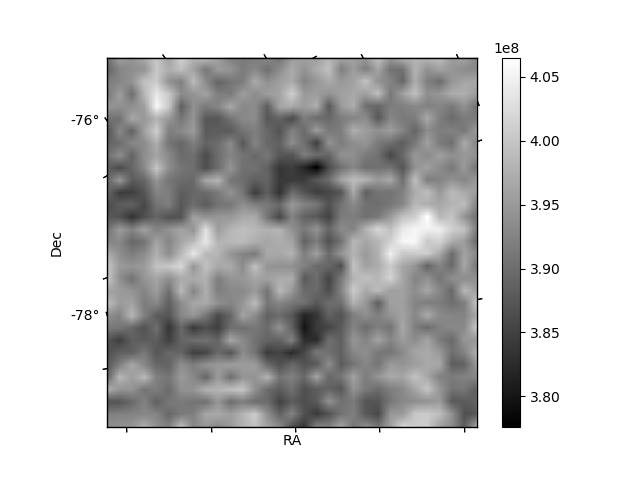
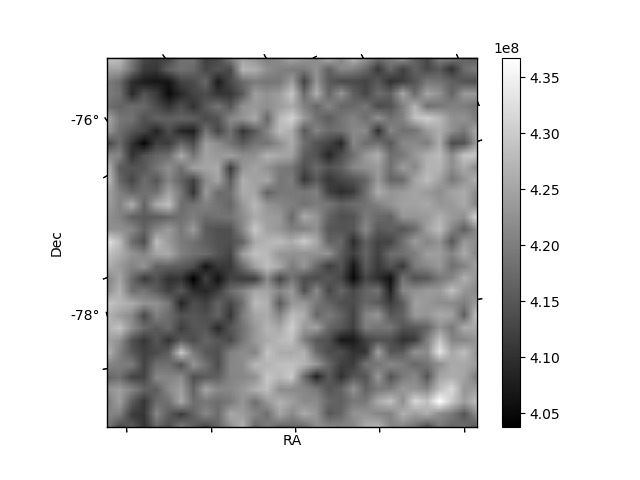
Histogram calculated using DETX and DETY for each event in the final _common_clean file
| Quadrant A | 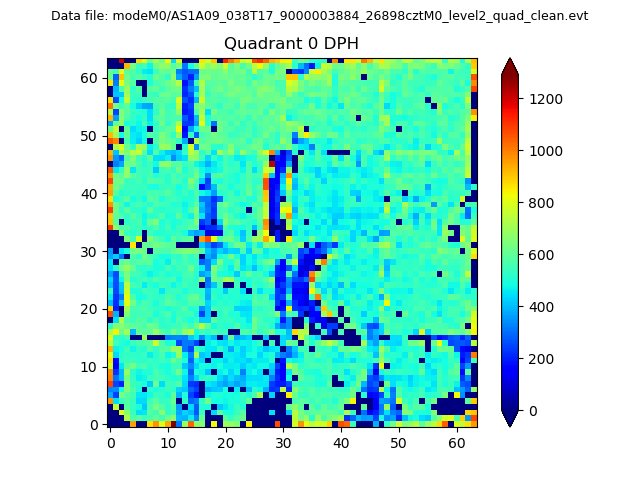 |
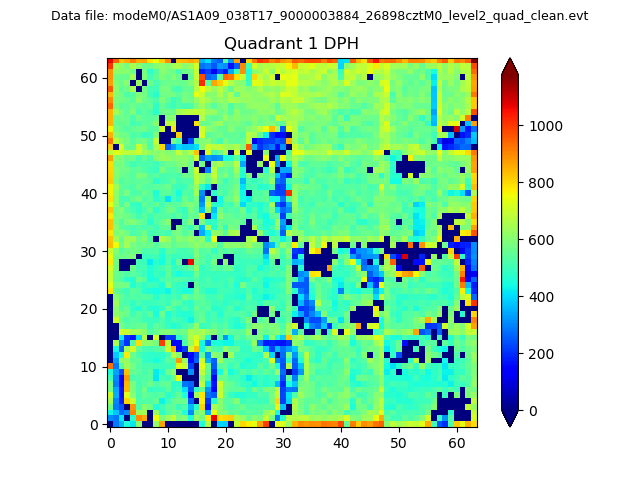 |
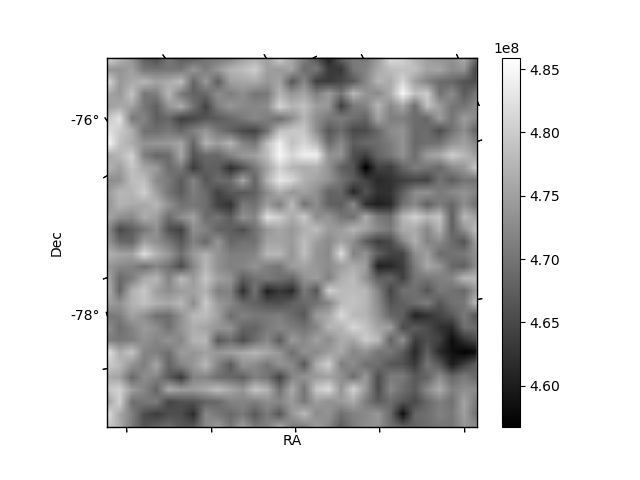
Quadrant B |
|---|---|---|---|
| Quadrant D | 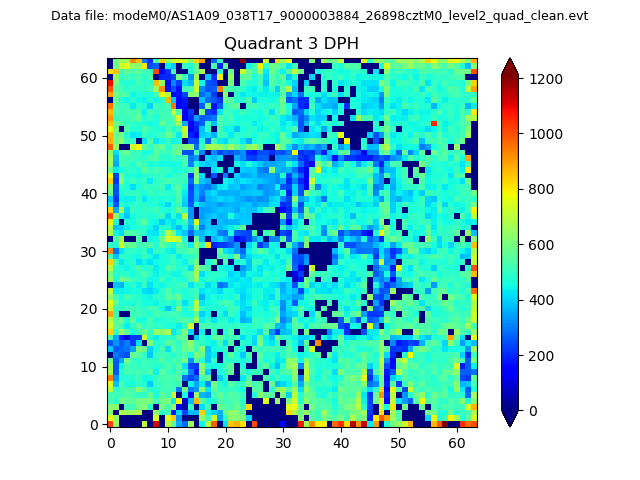 |
 |
Quadrant C |
| Plot type | Count rate plots | Images |
|---|---|---|
| Comparison with Poisson distribution Blue bars denote a histogram of data divided into 1 sec bins. Red curve is a Poisson curve with rate = median count rate of data. |
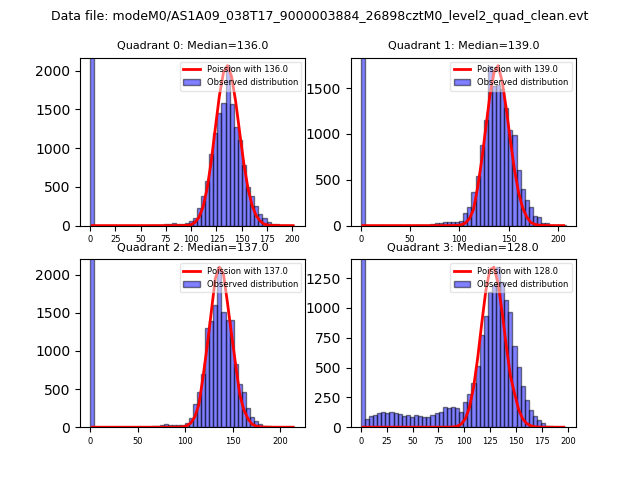 |
 |
| Quadrant-wise count rates Data is divided into 100 sec bins |
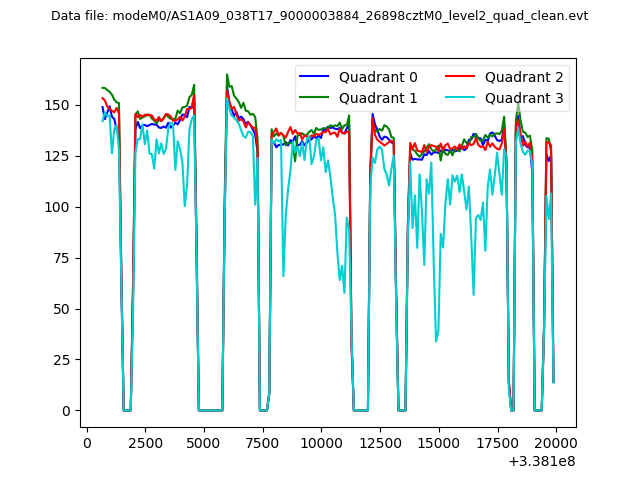 |
|
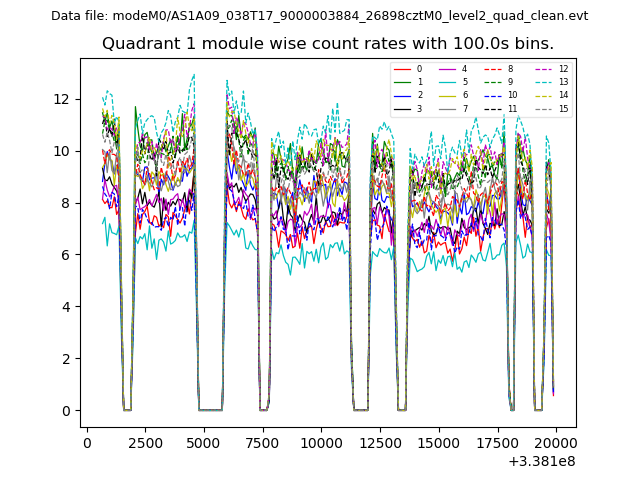
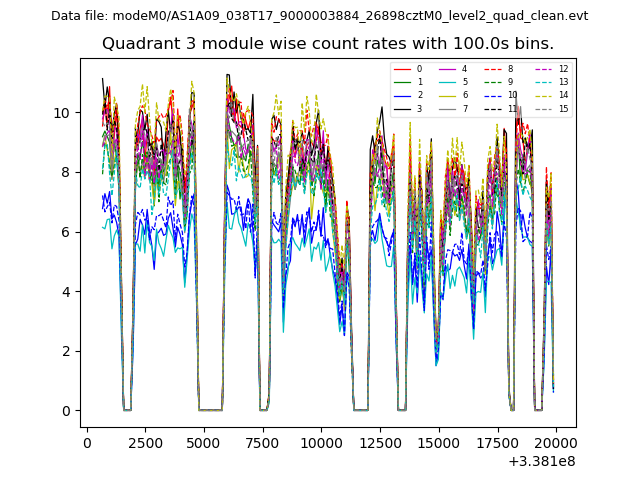
| Module-wise count rates for Quadrant A Data is divided into 100 sec bins |
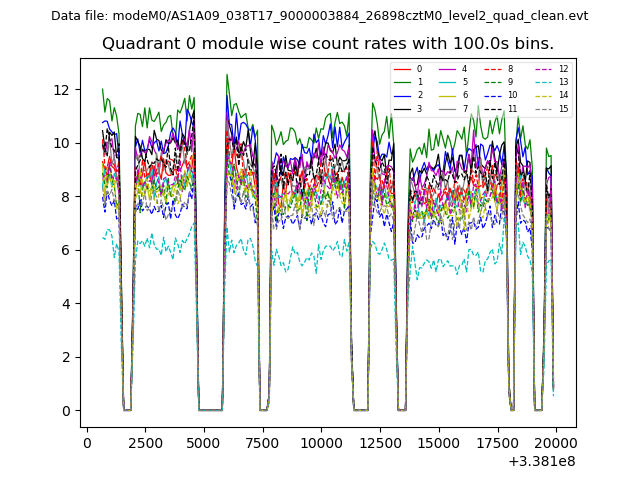 |
 |
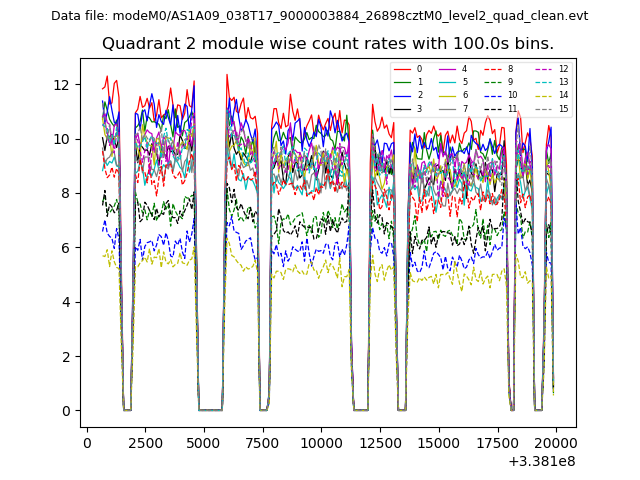
| Module-wise count rates for Quadrant B Data is divided into 100 sec bins |
 |
 |
| Module-wise count rates for Quadrant C Data is divided into 100 sec bins |
 |
 |
| Module-wise count rates for Quadrant D Data is divided into 100 sec bins |
 |
 |
| Parameter | Plot |
|---|---|
| CZT HV Monitor | 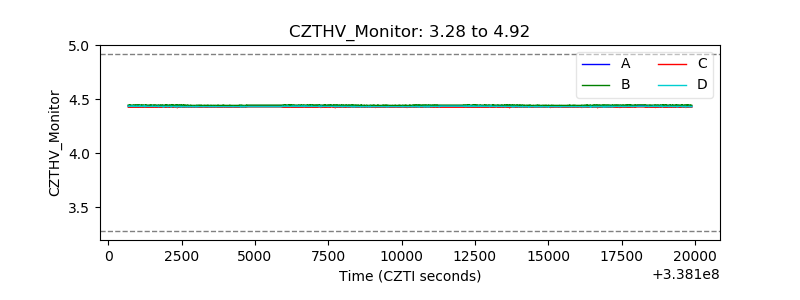 |
| D_VDD | 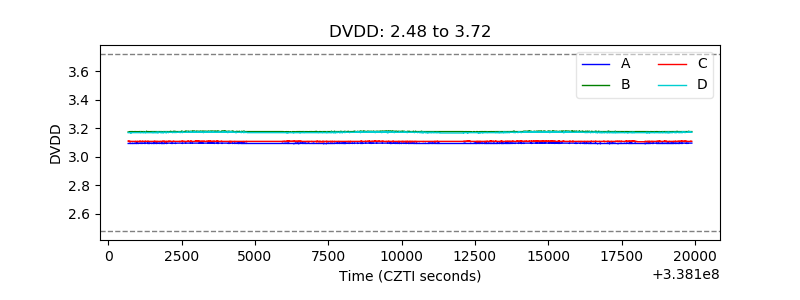 |
| Temperature 1 | 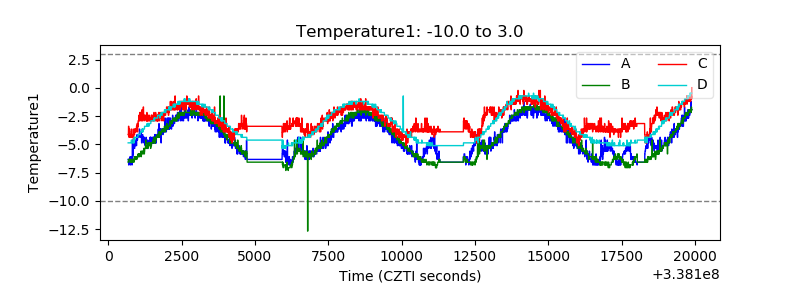 |
| Veto HV Monitor |  |
| Veto LLD | 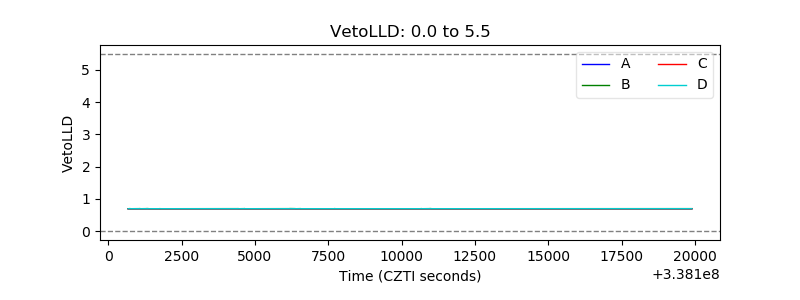 |
| Alpha Counter | 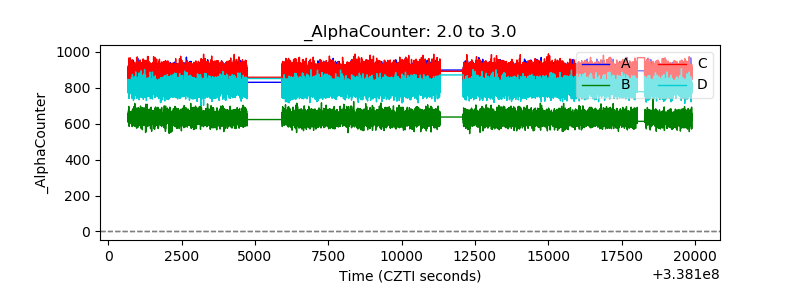 |
| _CPM_Rate | 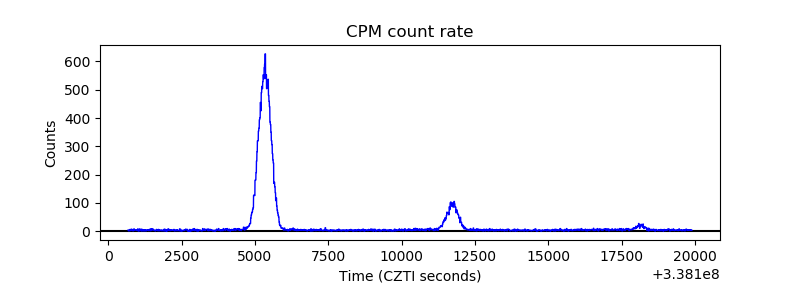 |
| CZT Counter | 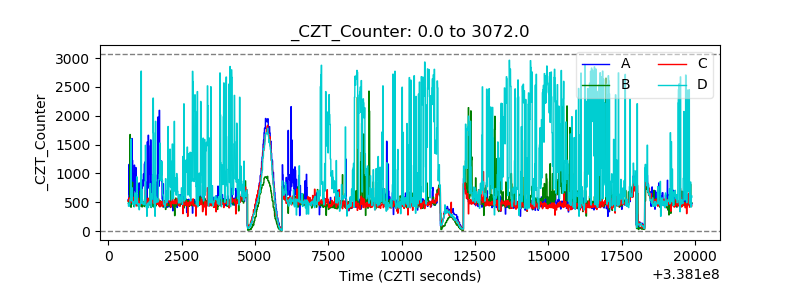 |
| +2.5 Volts monitor |  |
| +5 Volts monitor |  |
| _ROLL_ROT | 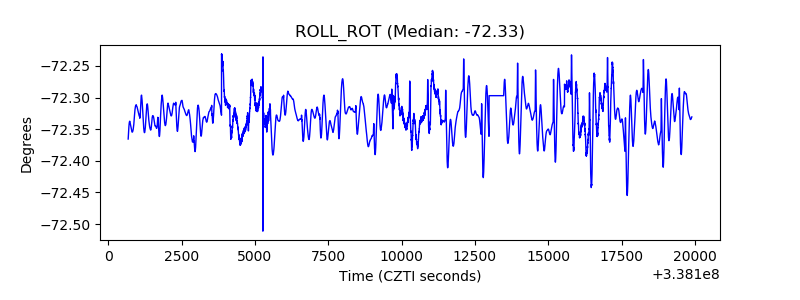 |
| _Roll_DEC | 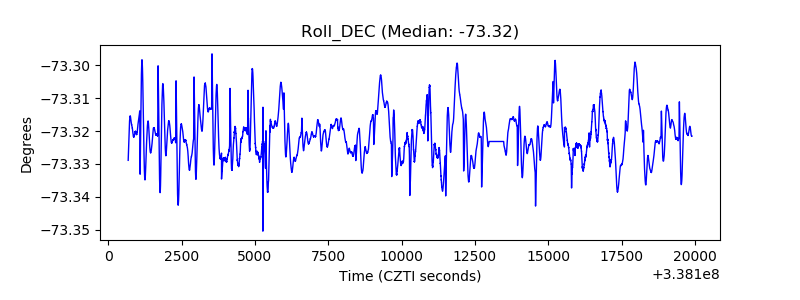 |
| _Roll_RA | 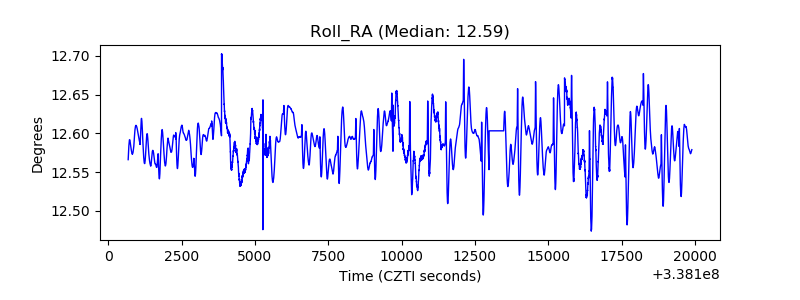 |
| Veto Counter | 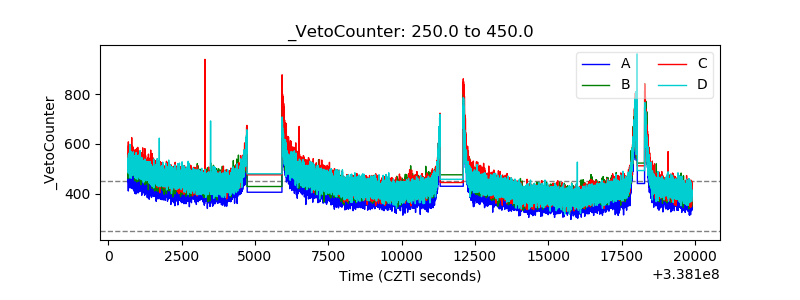 |