| Param | Original file | Final file |
|---|---|---|
| Filename | modeM0/AS1A09_038T17_9000003884_26902cztM0_level2.evt | modeM0/AS1A09_038T17_9000003884_26902cztM0_level2_quad_clean.evt |
| Size (bytes) | 712,232,640 | 116,173,440 |
| Size | 679.2 MB | 110.8 MB |
| Events in quadrant A | 4,137,314 | 793,045 |
| Events in quadrant B | 6,539,710 | 720,336 |
| Events in quadrant C | 3,559,060 | 801,297 |
| Events in quadrant D | 6,844,059 | 698,898 |
| Mode M0 | |||
|---|---|---|---|
| Quadrant | BADHDUFLAG | Total packets | Discarded packets |
| A | 0 | 16893 | 0 |
| B | 0 | 24120 | 0 |
| C | 0 | 15171 | 0 |
| D | 0 | 25161 | 0 |
| Quadrant | Total seconds | Saturated seconds | Saturation percentage |
|---|---|---|---|
| A | 7225 | 326 | 4.512111% |
| B | 7226 | 1447 | 20.024910% |
| C | 7226 | 321 | 4.442292% |
| D | 7226 | 1449 | 20.052588% |
Noise dominated data is calculated using 1-second bins in cleaned event files. If a bin has >2000 counts, and if more than 50% of those come from <1% of pixels, then it is considered to be noise-dominated and hence unusable.
| Quadrant | # 1 sec bins | Bins with >0 counts | Bins with >2000 counts | High rate bins dominated by noise | Noise dominated (total time) | Noise dominated (detector-on time) | Marked lightcurve |
|---|---|---|---|---|---|---|---|
| A | 7260 | 7226 | 16 | 16 | 0.22% | 0.22% | 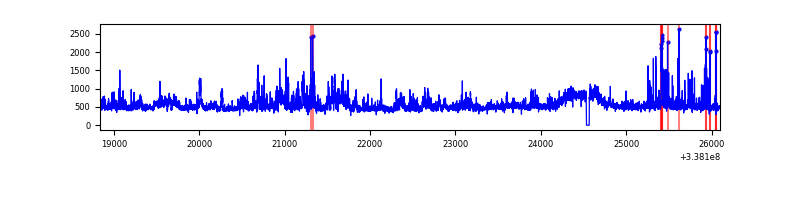 |
| B | 7261 | 7226 | 774 | 774 | 10.66% | 10.71% | 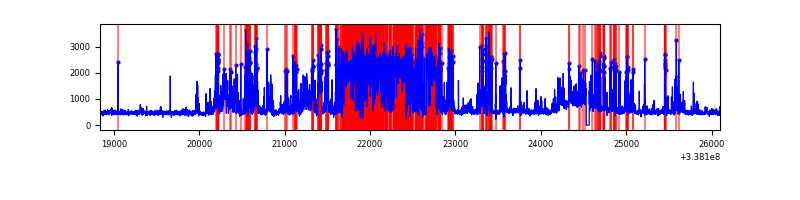 |
| C | 7261 | 7227 | 0 | 0 | 0.00% | 0.00% | 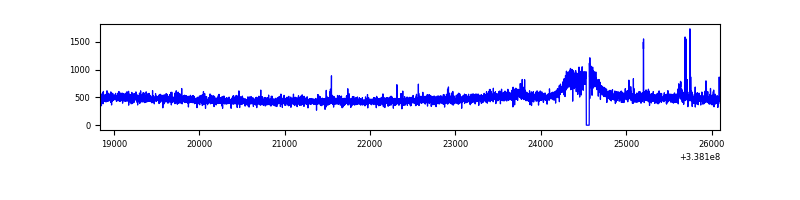 |
| D | 7261 | 7227 | 988 | 988 | 13.61% | 13.67% | 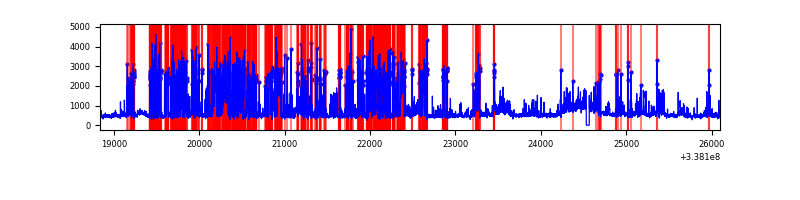 |
Top three noisy pixels from each quadrant. If the there are fewer than three noisy pixels in the level2.evt file, extra rows are filled as -1
| Pixel properties | Quadrant properties | ||||||
|---|---|---|---|---|---|---|---|
| Quadrant | DetID | PixID | Counts | Sigma | Mean | Median | Sigma |
| A | 6 | 16 | 343456 | 1921.41 | 881 | 857 | 178.3 |
| A | 0 | 13 | 328766 | 1839.03 | 881 | 857 | 178.3 |
| A | 5 | 168 | 65888 | 364.72 | 881 | 857 | 178.3 |
| B | 3 | 64 | 2789857 | 18162.71 | 799 | 778 | 153.6 |
| B | 10 | 245 | 319402 | 2074.9 | 799 | 778 | 153.6 |
| B | 0 | 190 | 261132 | 1695.45 | 799 | 778 | 153.6 |
| C | 14 | 238 | 137351 | 682.14 | 862 | 865 | 200.1 |
| C | 3 | 233 | 27546 | 133.35 | 862 | 865 | 200.1 |
| C | 2 | 16 | 20288 | 97.07 | 862 | 865 | 200.1 |
| D | 1 | 52 | 3323925 | 17637.57 | 794 | 774 | 188.4 |
| D | 7 | 80 | 329558 | 1745.02 | 794 | 774 | 188.4 |
| D | 2 | 250 | 93436 | 491.8 | 794 | 774 | 188.4 |
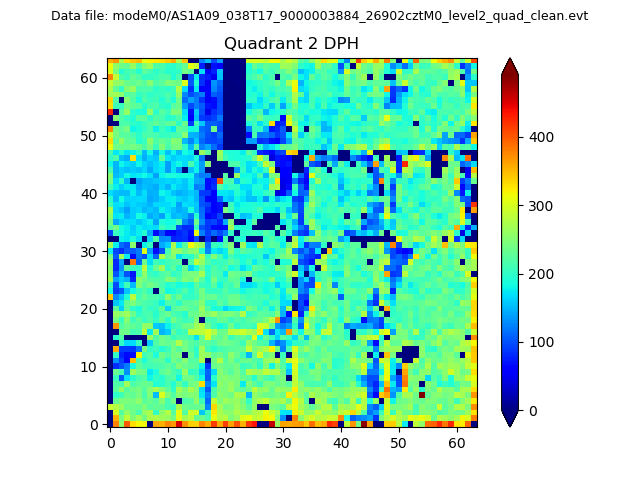
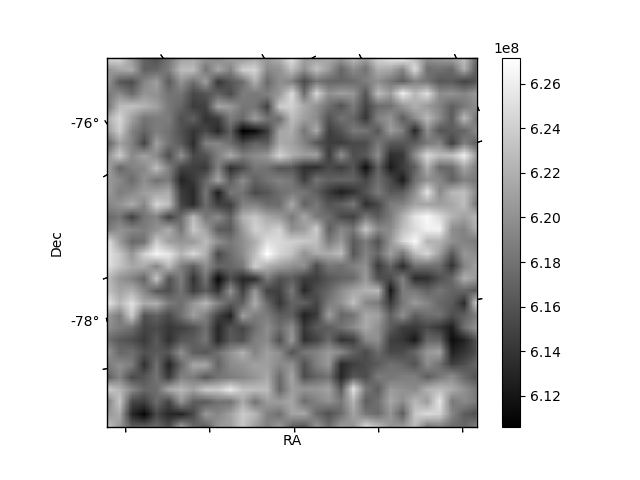
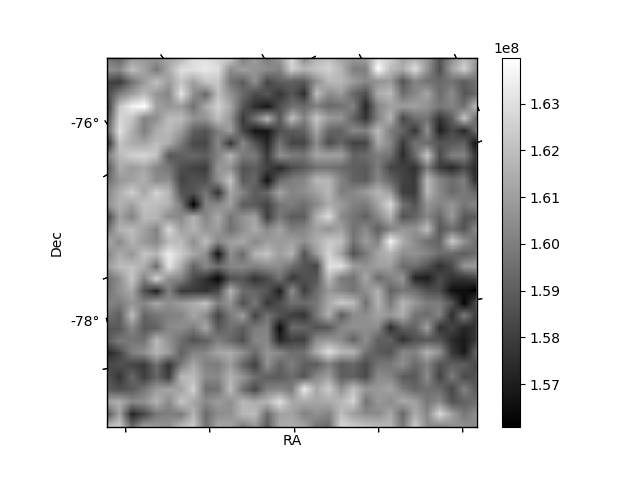
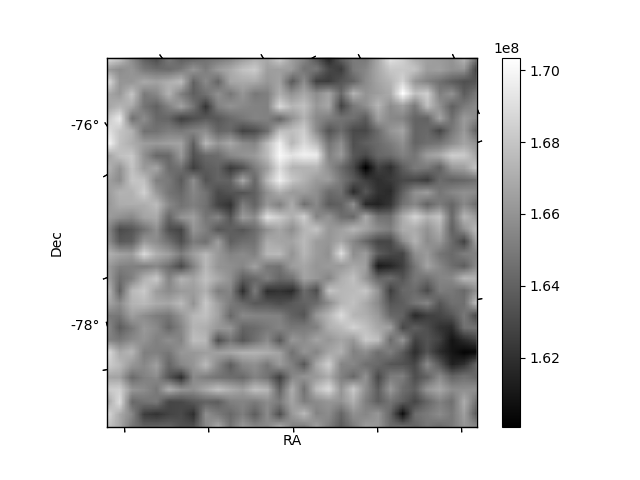
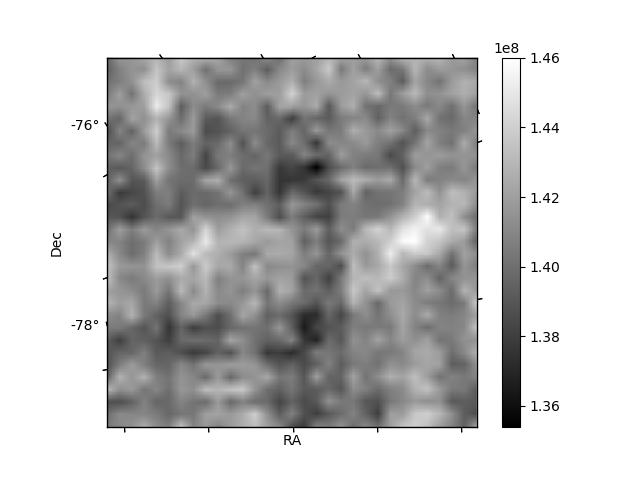
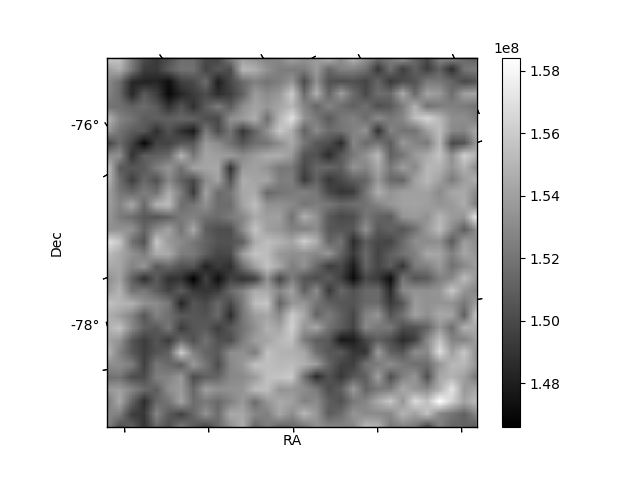
Histogram calculated using DETX and DETY for each event in the final _common_clean file
| Quadrant A | 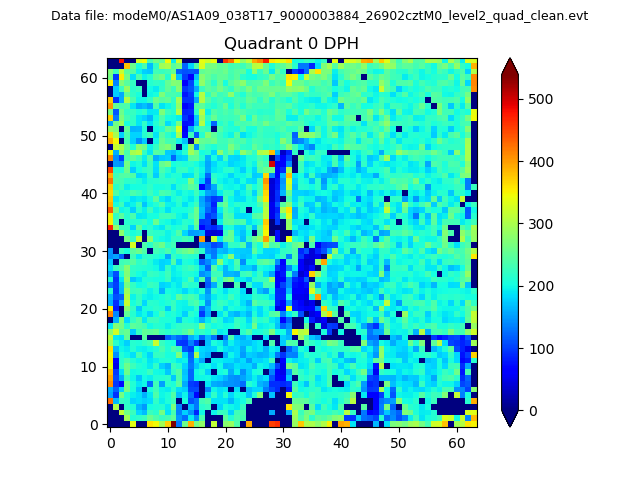 |
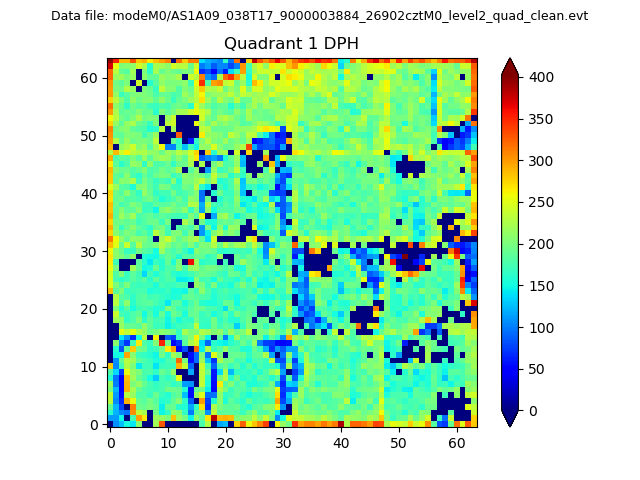 |
Quadrant B |
|---|---|---|---|
| Quadrant D | 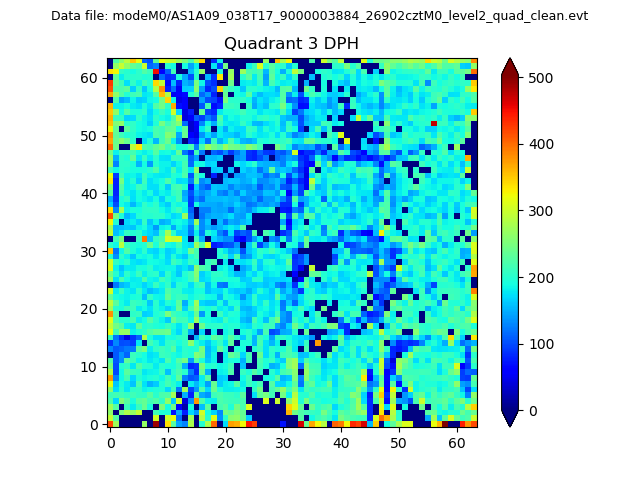 |
 |
Quadrant C |
| Plot type | Count rate plots | Images |
|---|---|---|
| Comparison with Poisson distribution Blue bars denote a histogram of data divided into 1 sec bins. Red curve is a Poisson curve with rate = median count rate of data. |
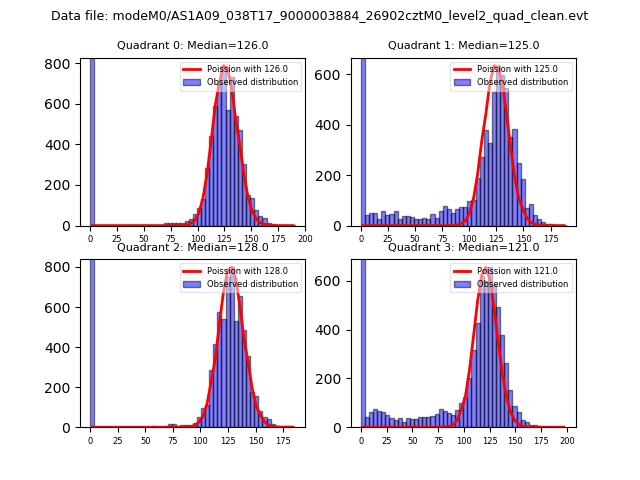 |
 |
| Quadrant-wise count rates Data is divided into 100 sec bins |
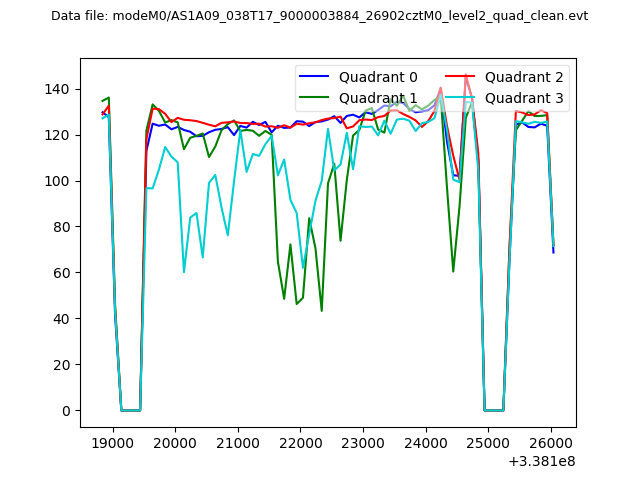 |
|
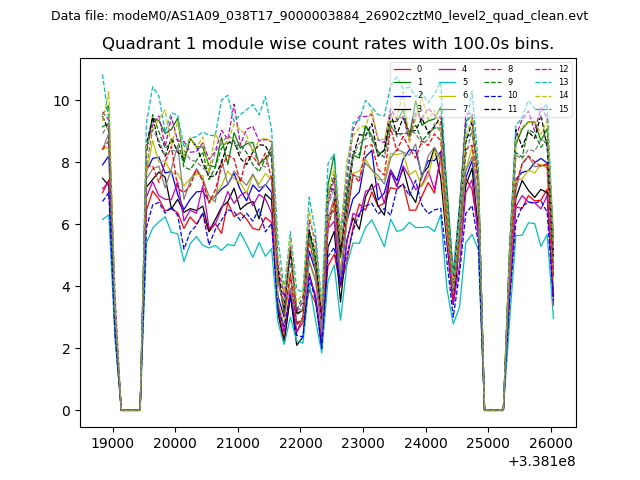
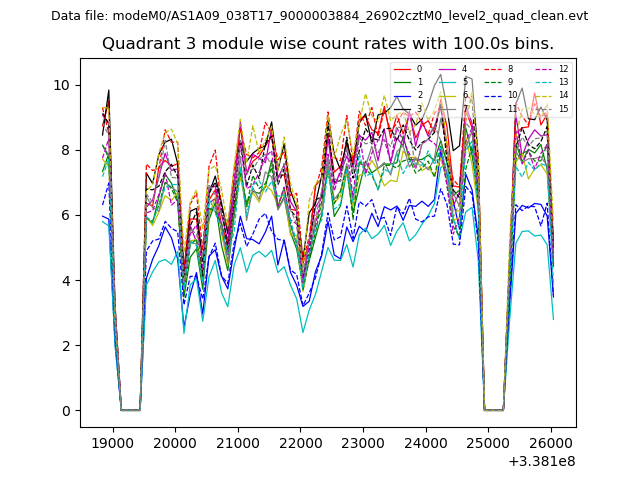
| Module-wise count rates for Quadrant A Data is divided into 100 sec bins |
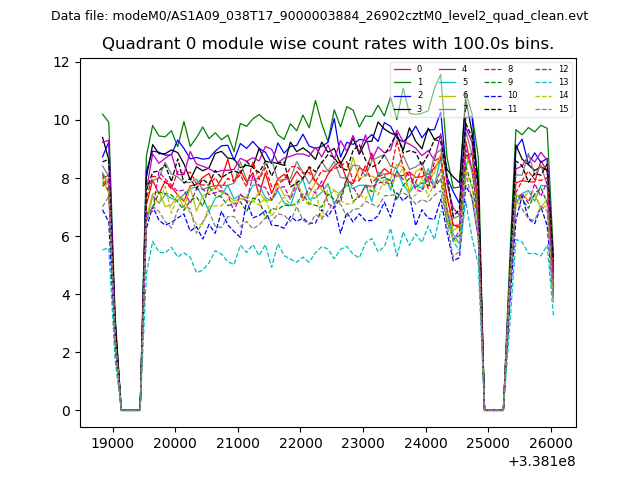 |
 |
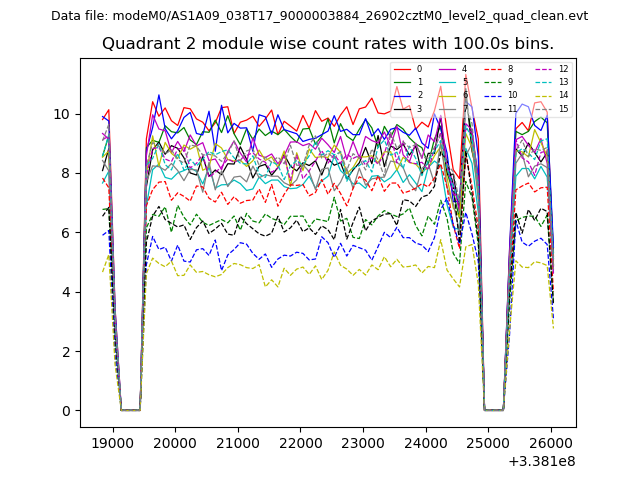
| Module-wise count rates for Quadrant B Data is divided into 100 sec bins |
 |
 |
| Module-wise count rates for Quadrant C Data is divided into 100 sec bins |
 |
 |
| Module-wise count rates for Quadrant D Data is divided into 100 sec bins |
 |
 |
| Parameter | Plot |
|---|---|
| CZT HV Monitor | 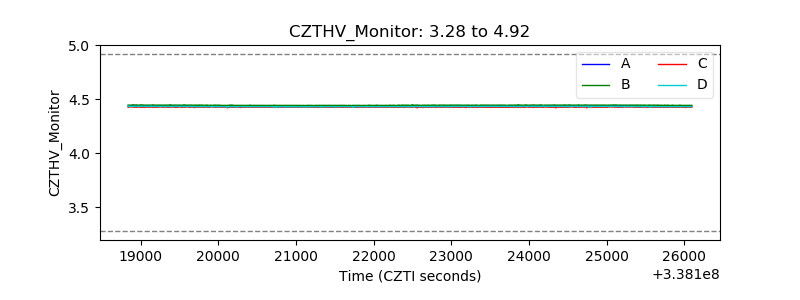 |
| D_VDD | 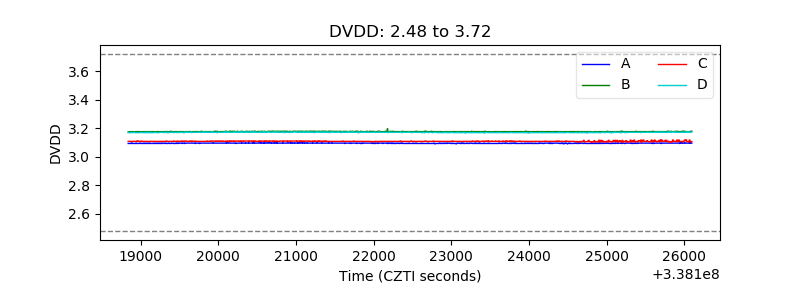 |
| Temperature 1 | 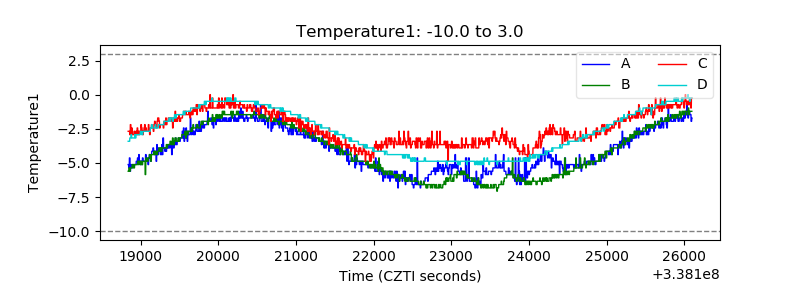 |
| Veto HV Monitor | 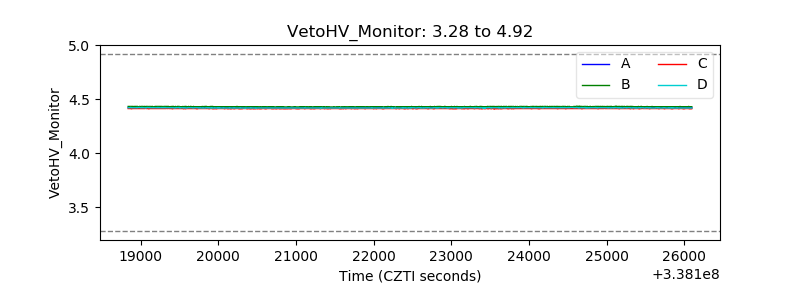 |
| Veto LLD | 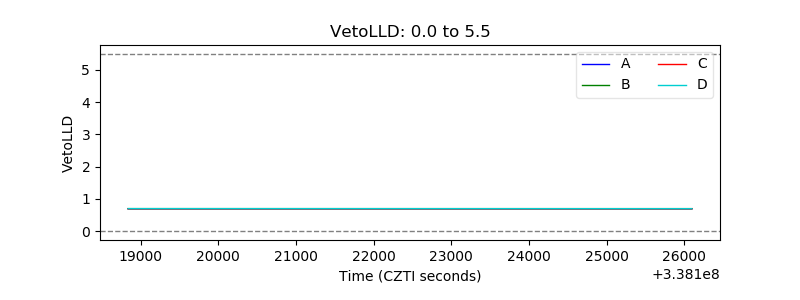 |
| Alpha Counter |  |
| _CPM_Rate |  |
| CZT Counter | 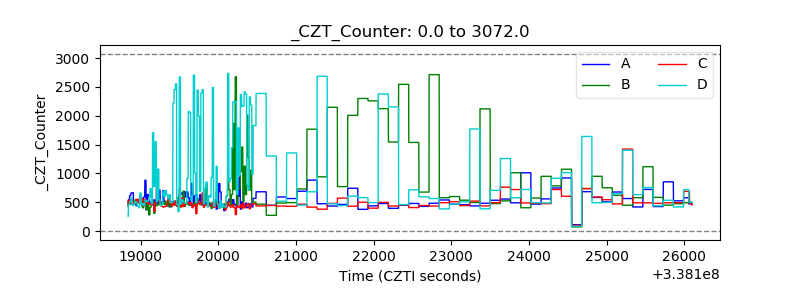 |
| +2.5 Volts monitor |  |
| +5 Volts monitor |  |
| _ROLL_ROT | 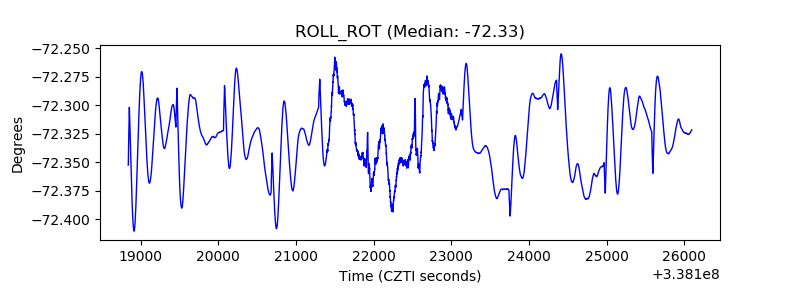 |
| _Roll_DEC | 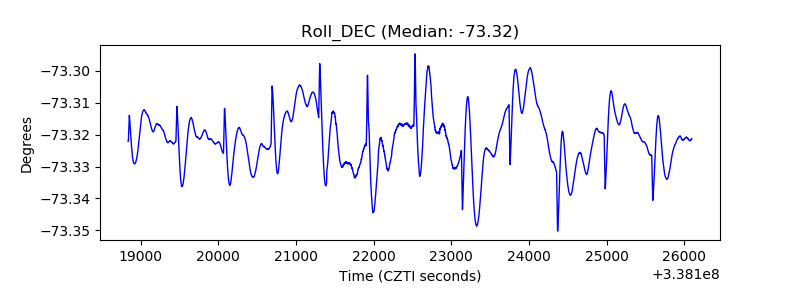 |
| _Roll_RA | 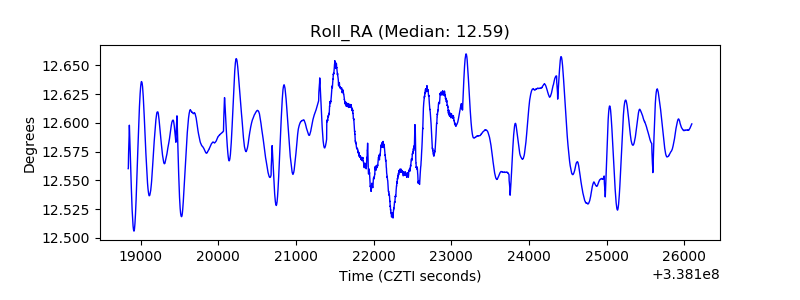 |
| Veto Counter | 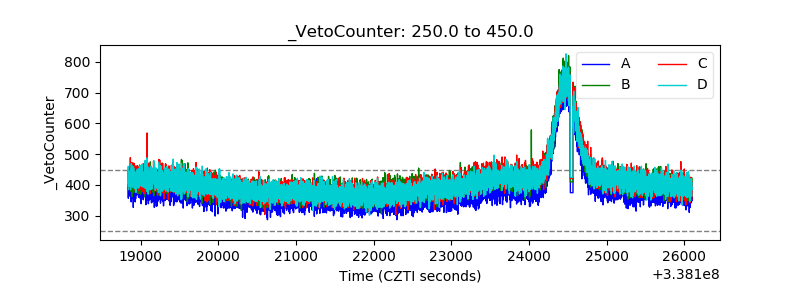 |