| Param | Original file | Final file |
|---|---|---|
| Filename | modeM0/AS1A09_038T21_9000003882cztM0_level2.fits | modeM0/AS1A09_038T21_9000003882cztM0_level2_quad_clean.evt |
| Size (bytes) | 39,326,400 | 38,257,920 |
| Size | 37.5 MB | 36.5 MB |
| Events in quadrant A | 237,164 | 230,005 |
| Events in quadrant B | 233,978 | 236,571 |
| Events in quadrant C | 242,530 | 220,622 |
| Events in quadrant D | 206,562 | 199,573 |
| Mode M0 | |||
|---|---|---|---|
| Quadrant | BADHDUFLAG | Total packets | Discarded packets |
| A | 0 | 10926 | 0 |
| B | 0 | 8521 | 0 |
| C | 0 | 7973 | 0 |
| D | 0 | 9699 | 0 |
| Mode M9 | |||
|---|---|---|---|
| Quadrant | BADHDUFLAG | Total packets | Discarded packets |
| A | 0 | 12 | 0 |
| B | 0 | 12 | 0 |
| C | 0 | 12 | 0 |
| D | 0 | 12 | 0 |
| Mode SS | |||
|---|---|---|---|
| Quadrant | BADHDUFLAG | Total packets | Discarded packets |
| A | 0 | 76 | 0 |
| B | 0 | 76 | 0 |
| C | 0 | 76 | 0 |
| D | 0 | 76 | 0 |
| Quadrant | Total seconds | Saturated seconds | Saturation percentage |
|---|---|---|---|
| A | 3845 | 163 | 4.239272% |
| B | 3845 | 56 | 1.456437% |
| C | 3845 | 33 | 0.858257% |
| D | 3845 | 88 | 2.288687% |
Noise dominated data is calculated using 1-second bins in cleaned event files. If a bin has >2000 counts, and if more than 50% of those come from <1% of pixels, then it is considered to be noise-dominated and hence unusable.
| Quadrant | # 1 sec bins | Bins with >0 counts | Bins with >2000 counts | High rate bins dominated by noise | Noise dominated (total time) | Noise dominated (detector-on time) | Marked lightcurve |
|---|---|---|---|---|---|---|---|
| A | 4970 | 3845 | 0 | 0 | 0.00% | 0.00% |  |
| B | 4970 | 3842 | 0 | 0 | 0.00% | 0.00% |  |
| C | 4970 | 3845 | 0 | 0 | 0.00% | 0.00% | 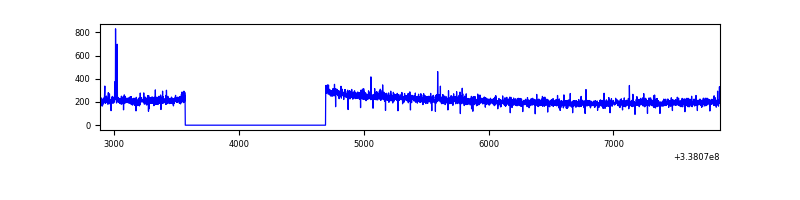 |
| D | 4970 | 3844 | 0 | 0 | 0.00% | 0.00% |  |
Top three noisy pixels from each quadrant. If the there are fewer than three noisy pixels in the level2.evt file, extra rows are filled as -1
| Pixel properties | Quadrant properties | ||||||
|---|---|---|---|---|---|---|---|
| Quadrant | DetID | PixID | Counts | Sigma | Mean | Median | Sigma |
| A | 0 | 29 | 209 | 8.97 | 61 | 58 | 16.8 |
| A | 7 | 110 | 196 | 8.2 | 61 | 58 | 16.8 |
| A | 14 | 79 | 179 | 7.19 | 61 | 58 | 16.8 |
| B | 2 | 9 | 193 | 9.54 | 62 | 59 | 14.1 |
| B | 2 | 8 | 178 | 8.47 | 62 | 59 | 14.1 |
| B | 14 | 254 | 166 | 7.61 | 62 | 59 | 14.1 |
| C | 9 | 209 | 203 | 7.8 | 64 | 60 | 18.3 |
| C | 1 | 81 | 187 | 6.93 | 64 | 60 | 18.3 |
| C | 3 | 187 | 185 | 6.82 | 64 | 60 | 18.3 |
| D | 6 | 231 | 172 | 6.87 | 58 | 53 | 17.3 |
| D | 7 | 3 | 170 | 6.76 | 58 | 53 | 17.3 |
| D | 10 | 189 | 159 | 6.12 | 58 | 53 | 17.3 |
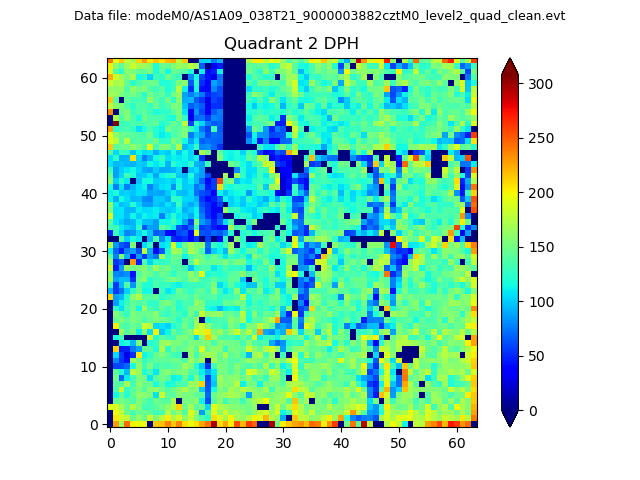
Histogram calculated using DETX and DETY for each event in the final _common_clean file
| Quadrant A |  |
 |
Quadrant B |
|---|---|---|---|
| Quadrant D | 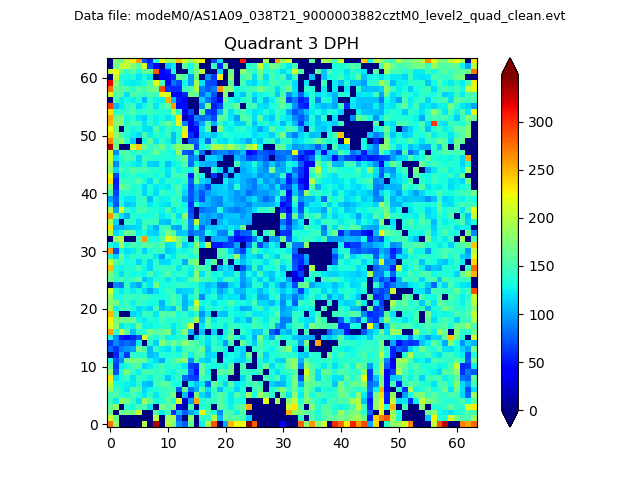 |
 |
Quadrant C |
| Plot type | Count rate plots | Images |
|---|---|---|
| Comparison with Poisson distribution Blue bars denote a histogram of data divided into 1 sec bins. Red curve is a Poisson curve with rate = median count rate of data. |
 |
 |
| Quadrant-wise count rates Data is divided into 100 sec bins |
 |
|
| Module-wise count rates for Quadrant A Data is divided into 100 sec bins |
 |
 |
| Module-wise count rates for Quadrant B Data is divided into 100 sec bins |
 |
 |
| Module-wise count rates for Quadrant C Data is divided into 100 sec bins |
 |
 |
| Module-wise count rates for Quadrant D Data is divided into 100 sec bins |
 |
 |
| Parameter | Plot |
|---|---|
| CZT HV Monitor | 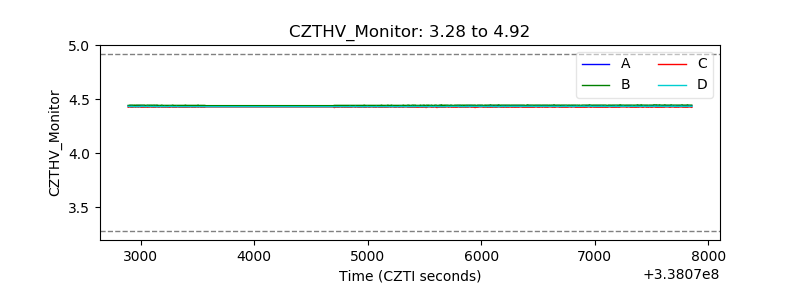 |
| D_VDD |  |
| Temperature 1 |  |
| Veto HV Monitor | 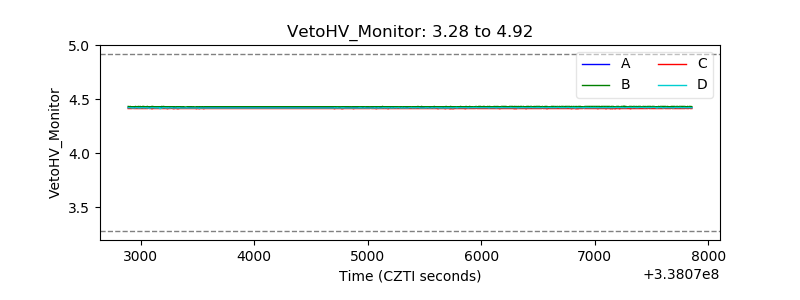 |
| Veto LLD |  |
| Alpha Counter |  |
| _CPM_Rate |  |
| CZT Counter |  |
| +2.5 Volts monitor |  |
| +5 Volts monitor |  |
| _ROLL_ROT |  |
| _Roll_DEC |  |
| _Roll_RA |  |
| Veto Counter |  |