| Param | Original file | Final file |
|---|---|---|
| Filename | modeM0/AS1A09_038T21_9000003882_26891cztM0_level2.evt | modeM0/AS1A09_038T21_9000003882_26891cztM0_level2_quad_clean.evt |
| Size (bytes) | 201,735,360 | 45,881,280 |
| Size | 192.4 MB | 43.8 MB |
| Events in quadrant A | 1,849,260 | 300,604 |
| Events in quadrant B | 1,319,414 | 319,336 |
| Events in quadrant C | 1,166,012 | 311,793 |
| Events in quadrant D | 1,621,108 | 295,938 |
| Mode M0 | |||
|---|---|---|---|
| Quadrant | BADHDUFLAG | Total packets | Discarded packets |
| A | 0 | 7047 | 0 |
| B | 0 | 5292 | 0 |
| C | 0 | 4771 | 0 |
| D | 0 | 6283 | 0 |
| Mode M9 | |||
|---|---|---|---|
| Quadrant | BADHDUFLAG | Total packets | Discarded packets |
| A | 0 | 12 | 0 |
| B | 0 | 12 | 0 |
| C | 0 | 12 | 0 |
| D | 0 | 12 | 0 |
| Quadrant | Total seconds | Saturated seconds | Saturation percentage |
|---|---|---|---|
| A | 2245 | 161 | 7.171492% |
| B | 2245 | 51 | 2.271715% |
| C | 2245 | 30 | 1.336303% |
| D | 2244 | 80 | 3.565062% |
Noise dominated data is calculated using 1-second bins in cleaned event files. If a bin has >2000 counts, and if more than 50% of those come from <1% of pixels, then it is considered to be noise-dominated and hence unusable.
| Quadrant | # 1 sec bins | Bins with >0 counts | Bins with >2000 counts | High rate bins dominated by noise | Noise dominated (total time) | Noise dominated (detector-on time) | Marked lightcurve |
|---|---|---|---|---|---|---|---|
| A | 3370 | 2246 | 111 | 111 | 3.29% | 4.94% | 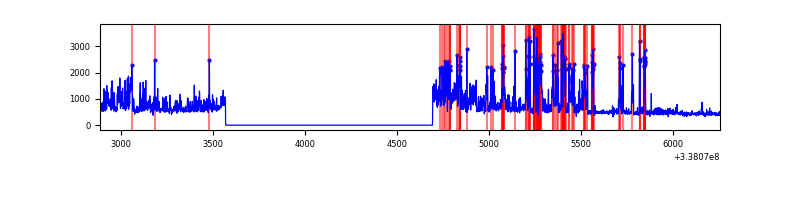 |
| B | 3370 | 2246 | 27 | 27 | 0.80% | 1.20% | 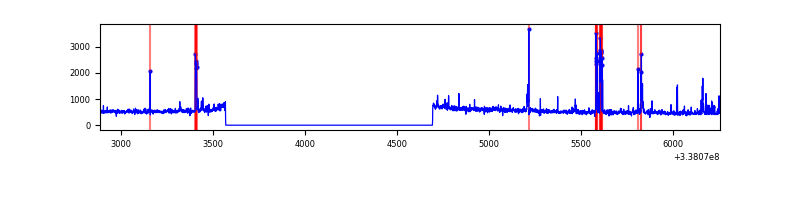 |
| C | 3370 | 2246 | 0 | 0 | 0.00% | 0.00% | 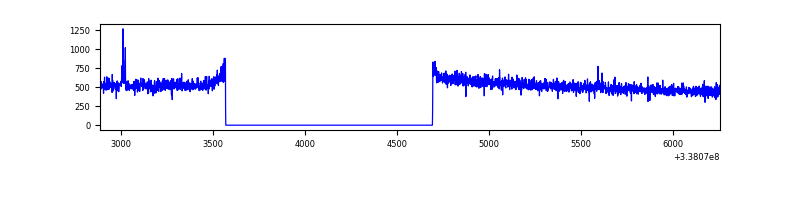 |
| D | 3369 | 2245 | 71 | 71 | 2.11% | 3.16% | 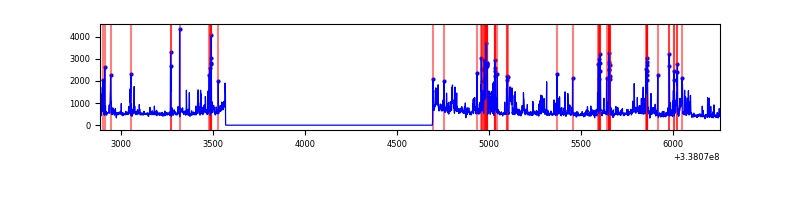 |
Top three noisy pixels from each quadrant. If the there are fewer than three noisy pixels in the level2.evt file, extra rows are filled as -1
| Pixel properties | Quadrant properties | ||||||
|---|---|---|---|---|---|---|---|
| Quadrant | DetID | PixID | Counts | Sigma | Mean | Median | Sigma |
| A | 6 | 16 | 409201 | 6856.87 | 290 | 285 | 59.6 |
| A | 0 | 13 | 320241 | 5365.15 | 290 | 285 | 59.6 |
| A | 13 | 254 | 3894 | 60.52 | 290 | 285 | 59.6 |
| B | 10 | 246 | 83888 | 1472.58 | 297 | 291 | 56.8 |
| B | 3 | 64 | 46241 | 809.42 | 297 | 291 | 56.8 |
| B | 0 | 190 | 14115 | 243.51 | 297 | 291 | 56.8 |
| C | 14 | 238 | 46672 | 683.77 | 285 | 287 | 67.8 |
| C | 15 | 208 | 4931 | 68.46 | 285 | 287 | 67.8 |
| C | 13 | 61 | 1979 | 24.94 | 285 | 287 | 67.8 |
| D | 1 | 52 | 346391 | 5146.9 | 279 | 273 | 67.2 |
| D | 2 | 250 | 115298 | 1710.46 | 279 | 273 | 67.2 |
| D | 11 | 176 | 82376 | 1220.9 | 279 | 273 | 67.2 |
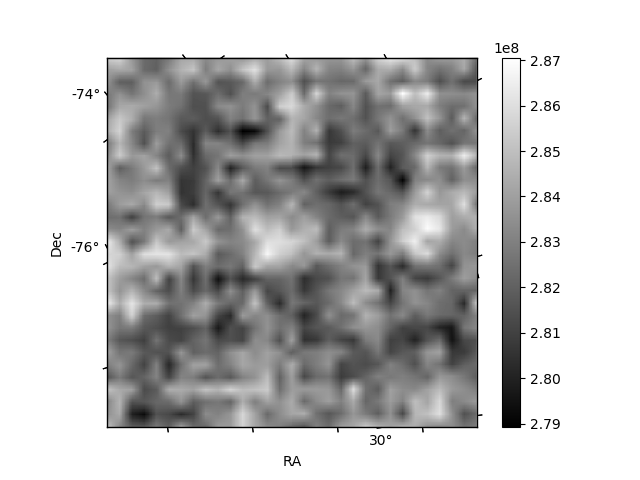
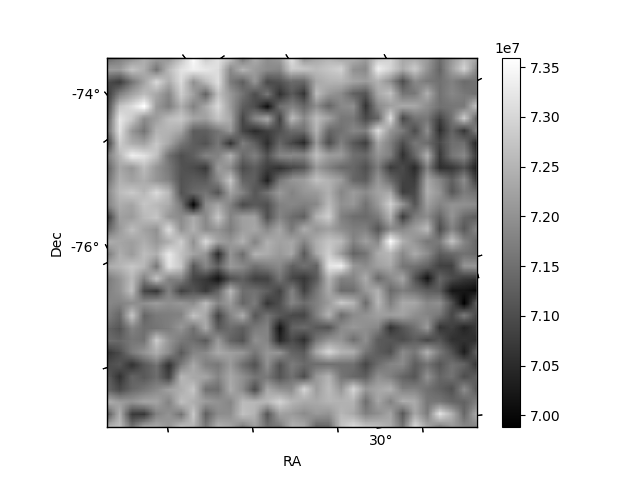
Histogram calculated using DETX and DETY for each event in the final _common_clean file
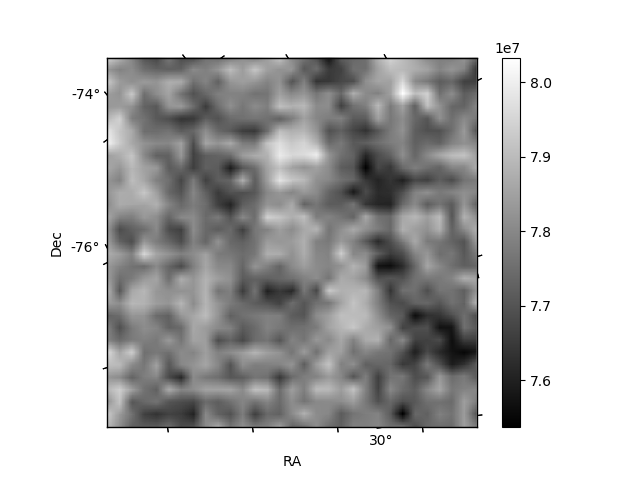
| Quadrant A | 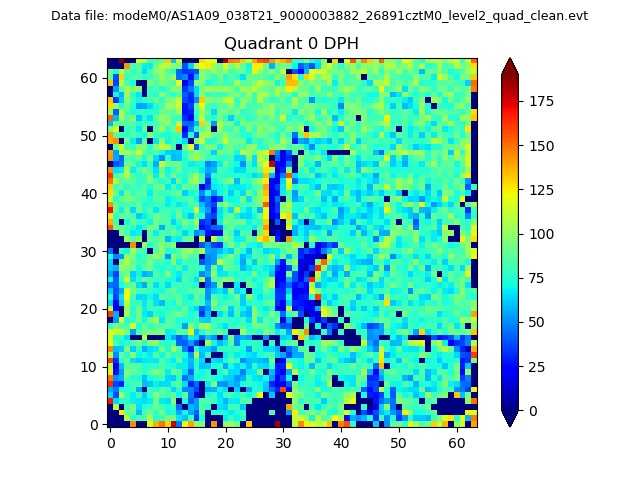 |
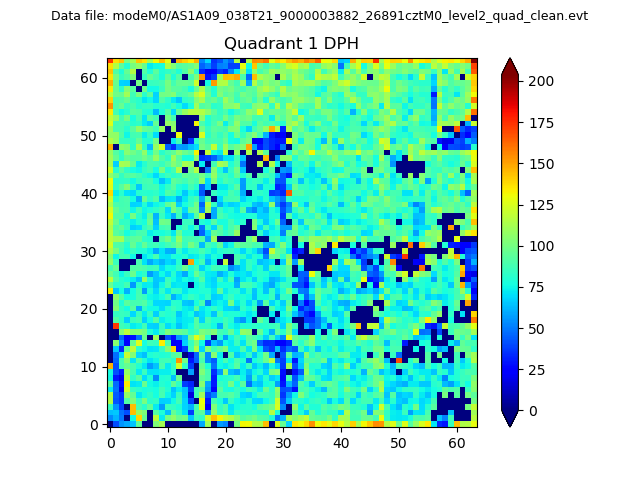 |
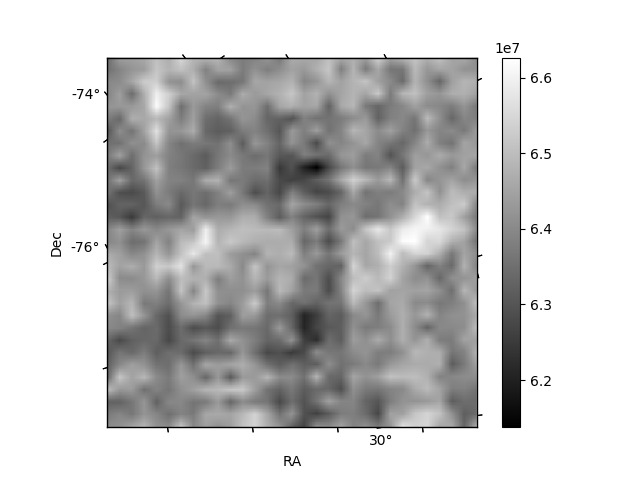
Quadrant B |
|---|---|---|---|
| Quadrant D |  |
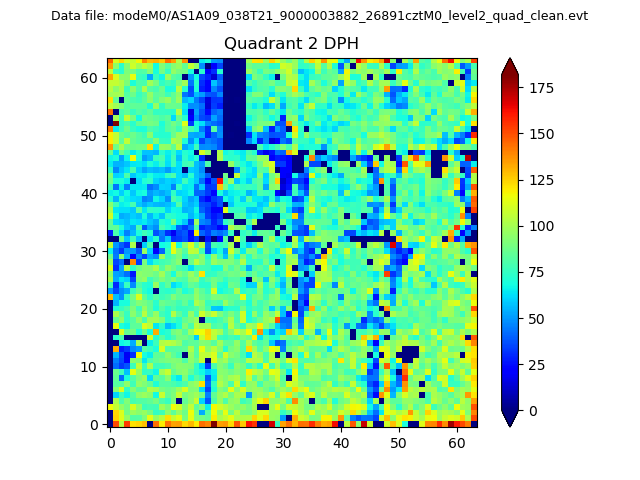 |
Quadrant C |
| Plot type | Count rate plots | Images |
|---|---|---|
| Comparison with Poisson distribution Blue bars denote a histogram of data divided into 1 sec bins. Red curve is a Poisson curve with rate = median count rate of data. |
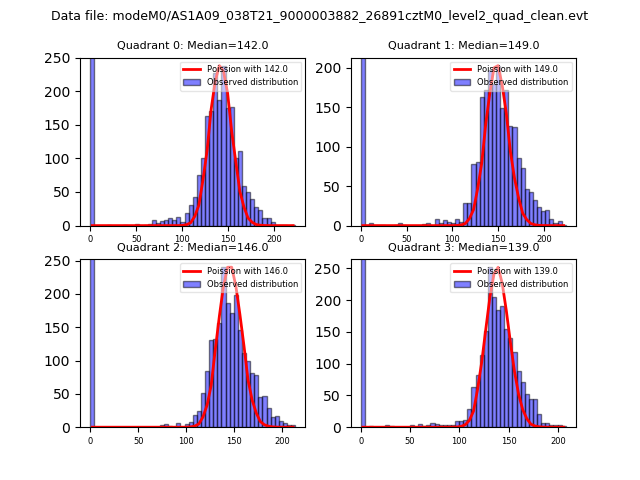 |
 |
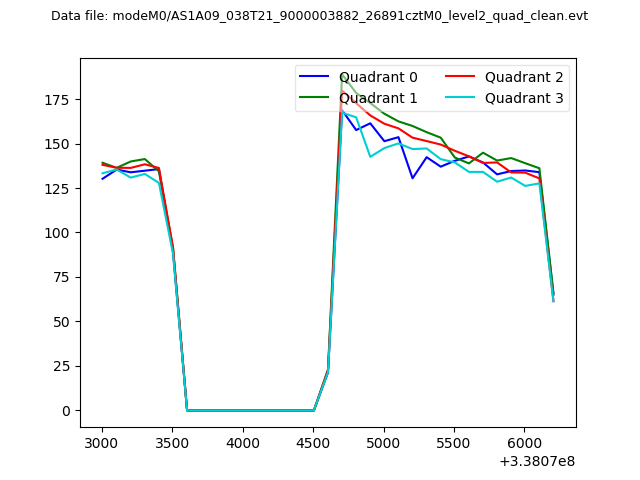
| Quadrant-wise count rates Data is divided into 100 sec bins |
 |
|
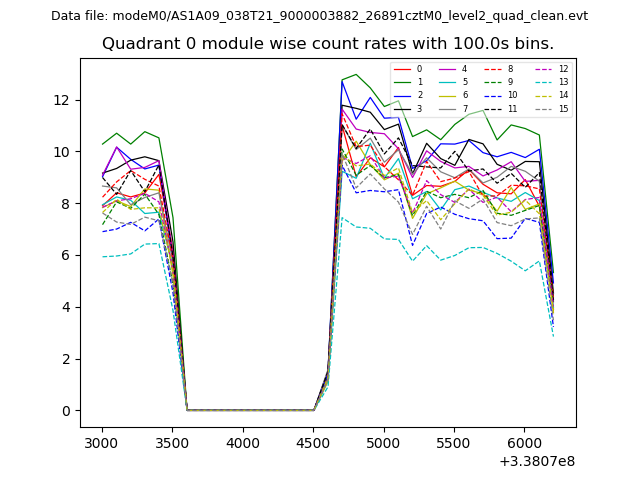
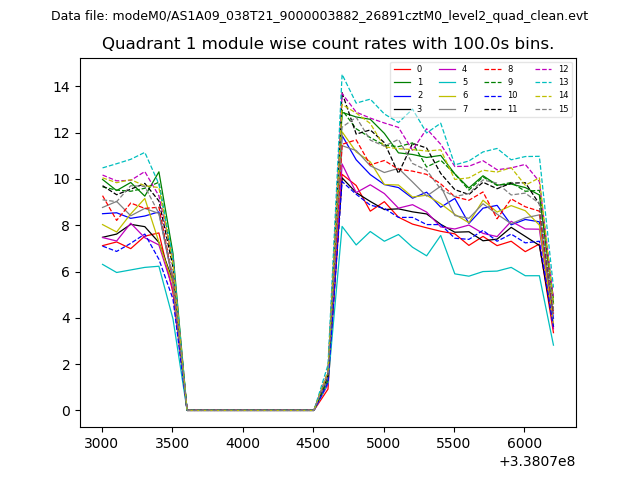
| Module-wise count rates for Quadrant A Data is divided into 100 sec bins |
 |
 |
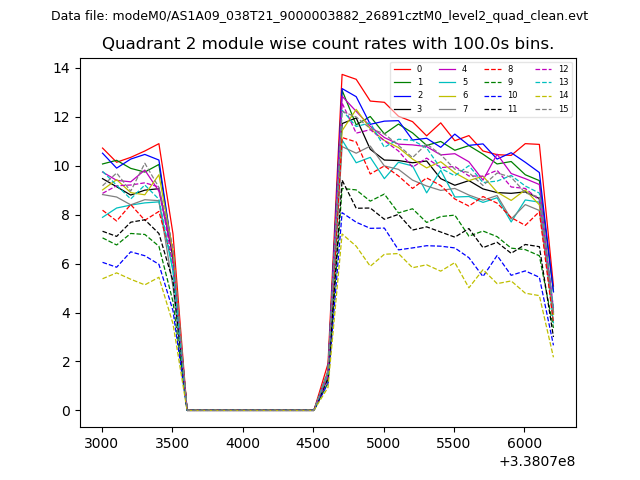
| Module-wise count rates for Quadrant B Data is divided into 100 sec bins |
 |
 |
| Module-wise count rates for Quadrant C Data is divided into 100 sec bins |
 |
 |
| Module-wise count rates for Quadrant D Data is divided into 100 sec bins |
 |
 |
| Parameter | Plot |
|---|---|
| CZT HV Monitor | 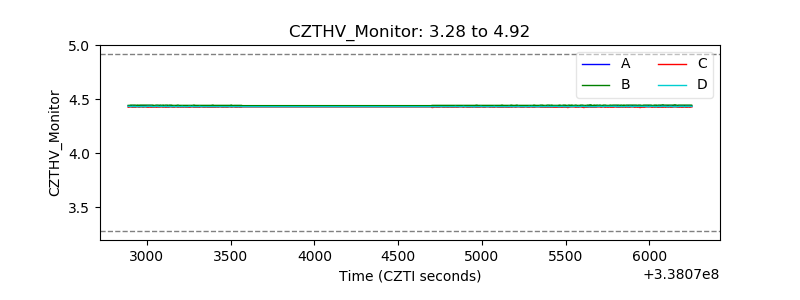 |
| D_VDD | 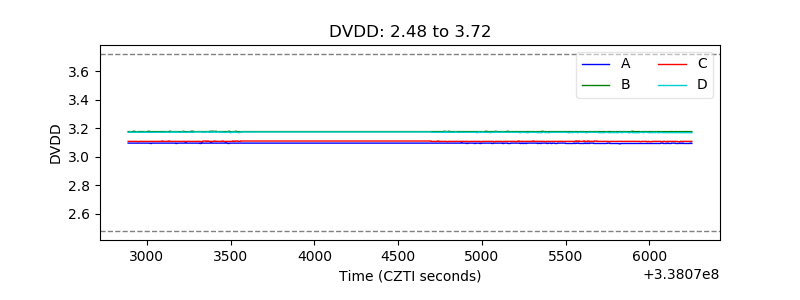 |
| Temperature 1 | 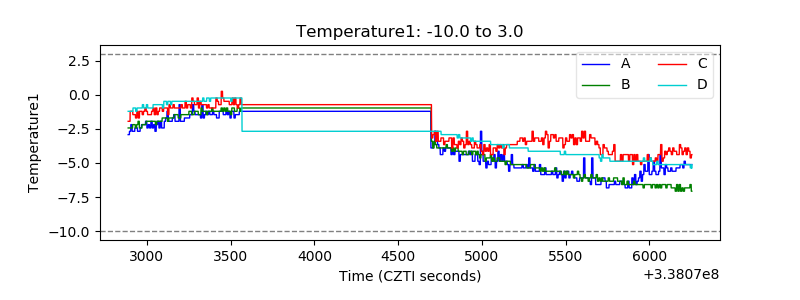 |
| Veto HV Monitor | 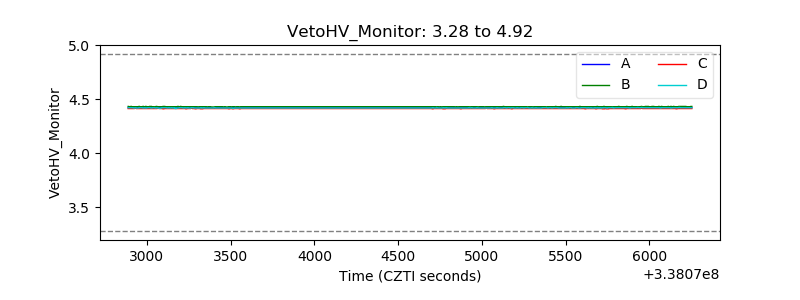 |
| Veto LLD | 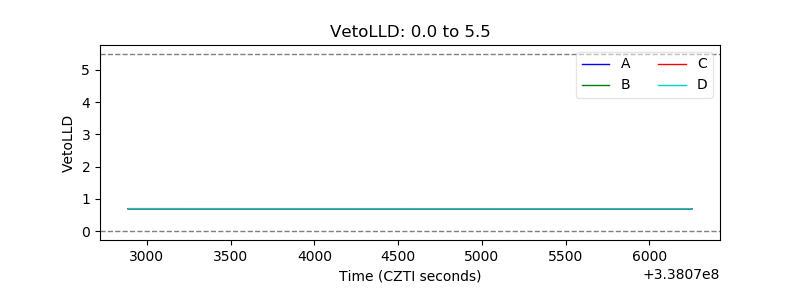 |
| Alpha Counter | 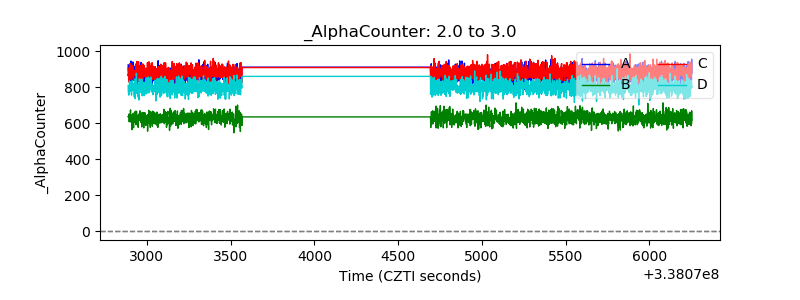 |
| _CPM_Rate | 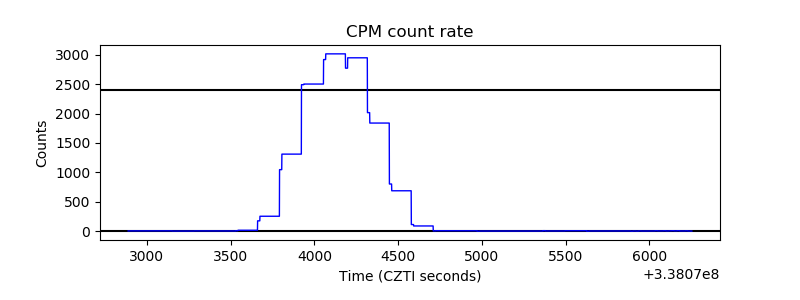 |
| CZT Counter | 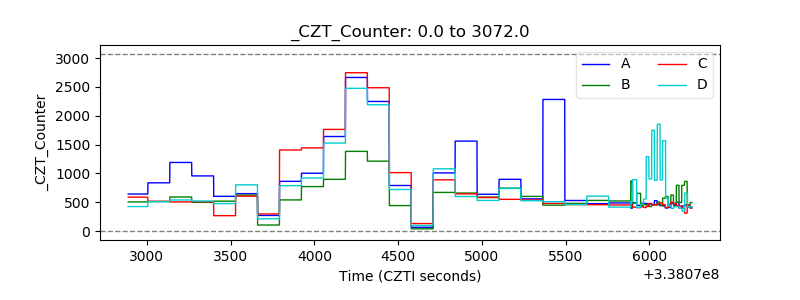 |
| +2.5 Volts monitor |  |
| +5 Volts monitor |  |
| _ROLL_ROT | 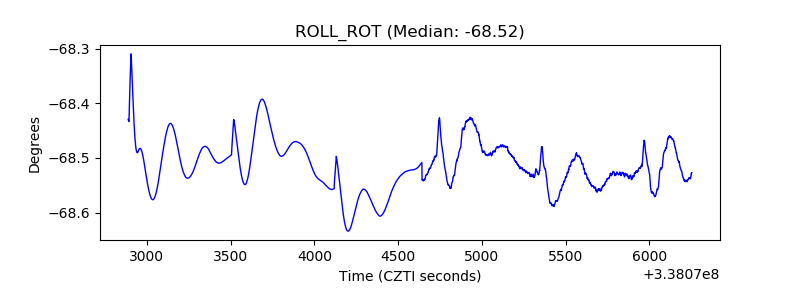 |
| _Roll_DEC | 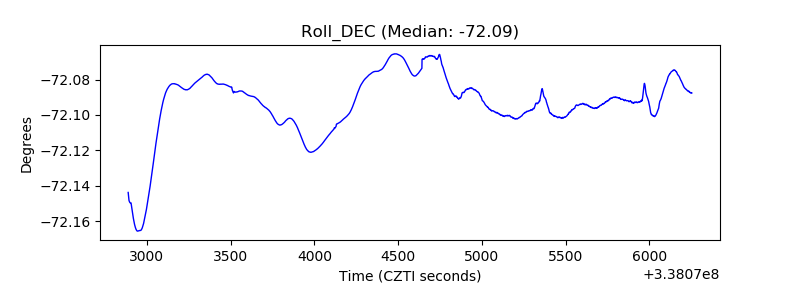 |
| _Roll_RA | 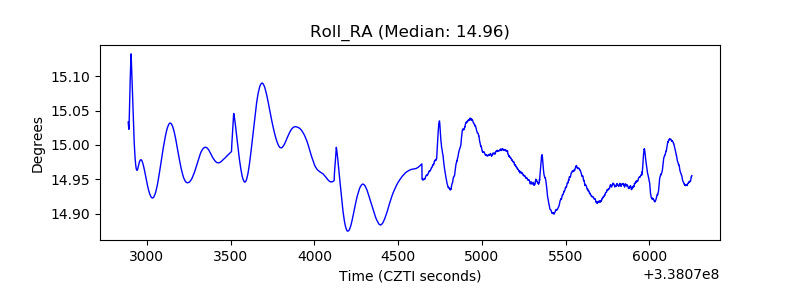 |
| Veto Counter | 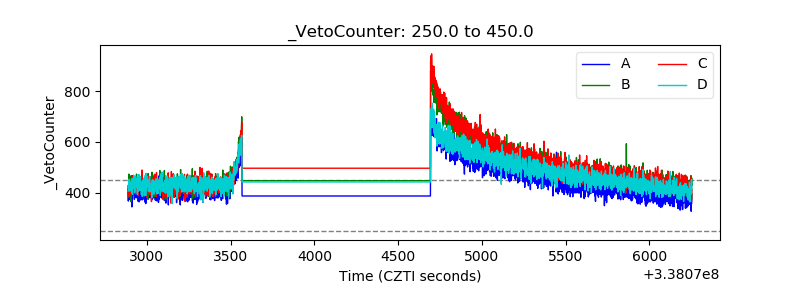 |