| Param | Original file | Final file |
|---|---|---|
| Filename | modeM0/AS1A09_038T21_9000003882_26892cztM0_level2.evt | modeM0/AS1A09_038T21_9000003882_26892cztM0_level2_quad_clean.evt |
| Size (bytes) | 230,621,760 | 60,906,240 |
| Size | 219.9 MB | 58.1 MB |
| Events in quadrant A | 2,060,112 | 405,036 |
| Events in quadrant B | 1,524,592 | 425,351 |
| Events in quadrant C | 1,409,260 | 407,882 |
| Events in quadrant D | 1,783,861 | 391,387 |
| Mode M0 | |||
|---|---|---|---|
| Quadrant | BADHDUFLAG | Total packets | Discarded packets |
| A | 0 | 8189 | 0 |
| B | 0 | 6529 | 0 |
| C | 0 | 6122 | 0 |
| D | 0 | 7378 | 0 |
| Quadrant | Total seconds | Saturated seconds | Saturation percentage |
|---|---|---|---|
| A | 3013 | 112 | 3.717225% |
| B | 3014 | 31 | 1.028534% |
| C | 3014 | 8 | 0.265428% |
| D | 3014 | 55 | 1.824818% |
Noise dominated data is calculated using 1-second bins in cleaned event files. If a bin has >2000 counts, and if more than 50% of those come from <1% of pixels, then it is considered to be noise-dominated and hence unusable.
| Quadrant | # 1 sec bins | Bins with >0 counts | Bins with >2000 counts | High rate bins dominated by noise | Noise dominated (total time) | Noise dominated (detector-on time) | Marked lightcurve |
|---|---|---|---|---|---|---|---|
| A | 3013 | 3013 | 98 | 98 | 3.25% | 3.25% | 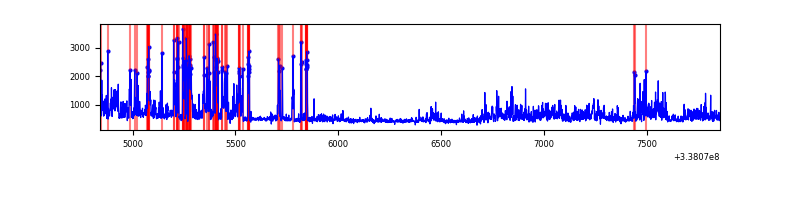 |
| B | 3014 | 3014 | 21 | 21 | 0.70% | 0.70% | 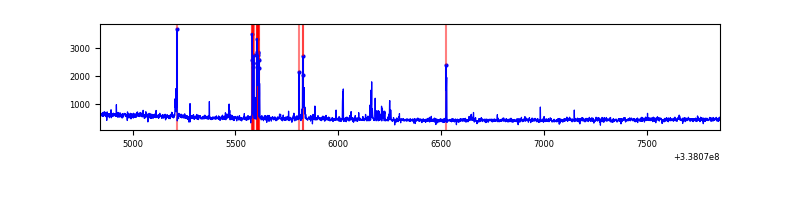 |
| C | 3014 | 3014 | 0 | 0 | 0.00% | 0.00% | 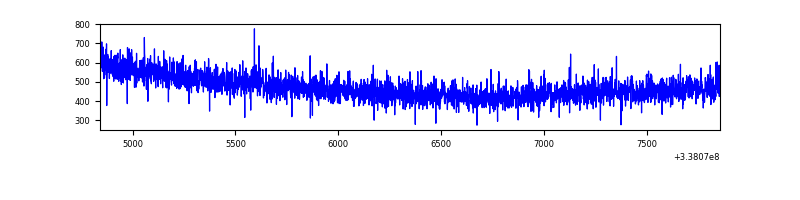 |
| D | 3014 | 3014 | 62 | 62 | 2.06% | 2.06% | 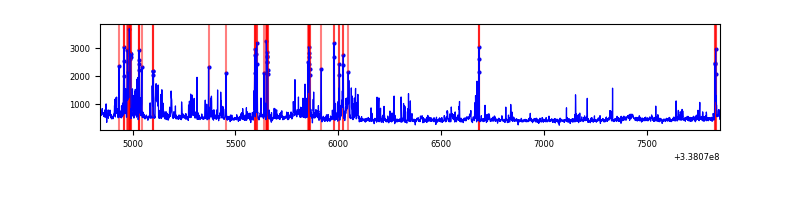 |
Top three noisy pixels from each quadrant. If the there are fewer than three noisy pixels in the level2.evt file, extra rows are filled as -1
| Pixel properties | Quadrant properties | ||||||
|---|---|---|---|---|---|---|---|
| Quadrant | DetID | PixID | Counts | Sigma | Mean | Median | Sigma |
| A | 0 | 13 | 397765 | 5612.32 | 347 | 341 | 70.8 |
| A | 6 | 16 | 325701 | 4594.65 | 347 | 341 | 70.8 |
| A | 13 | 254 | 4862 | 63.84 | 347 | 341 | 70.8 |
| B | 10 | 246 | 69070 | 1029.63 | 357 | 349 | 66.7 |
| B | 3 | 64 | 39943 | 593.23 | 357 | 349 | 66.7 |
| B | 15 | 36 | 8813 | 126.81 | 357 | 349 | 66.7 |
| C | 14 | 238 | 56801 | 687.12 | 347 | 349 | 82.2 |
| C | 13 | 61 | 2351 | 24.37 | 347 | 349 | 82.2 |
| C | 15 | 78 | 853 | 6.13 | 347 | 349 | 82.2 |
| D | 1 | 52 | 335305 | 4164.04 | 336 | 328 | 80.4 |
| D | 11 | 176 | 95373 | 1181.49 | 336 | 328 | 80.4 |
| D | 2 | 250 | 69556 | 860.56 | 336 | 328 | 80.4 |
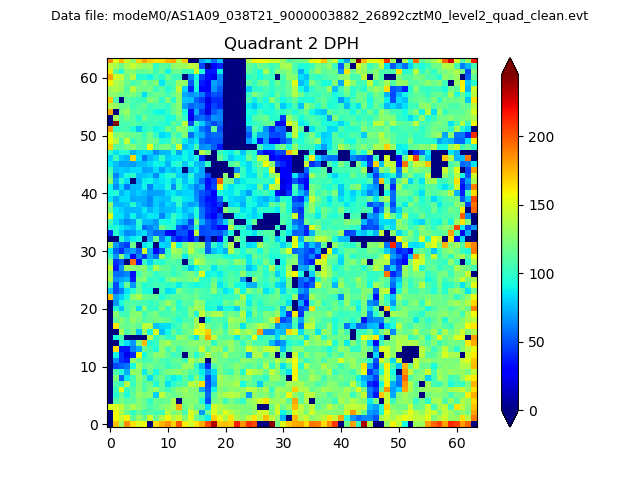
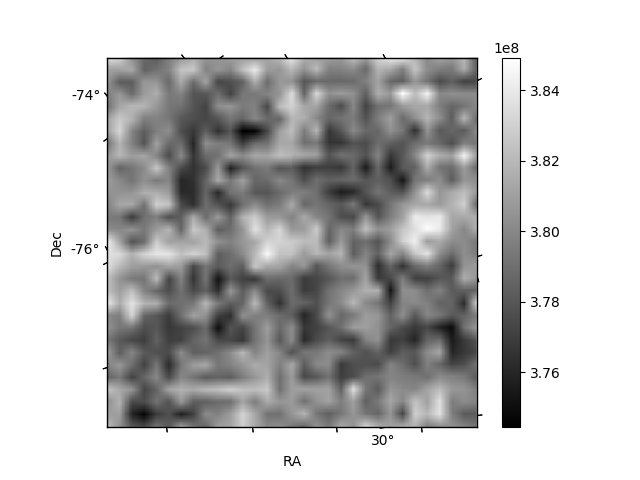
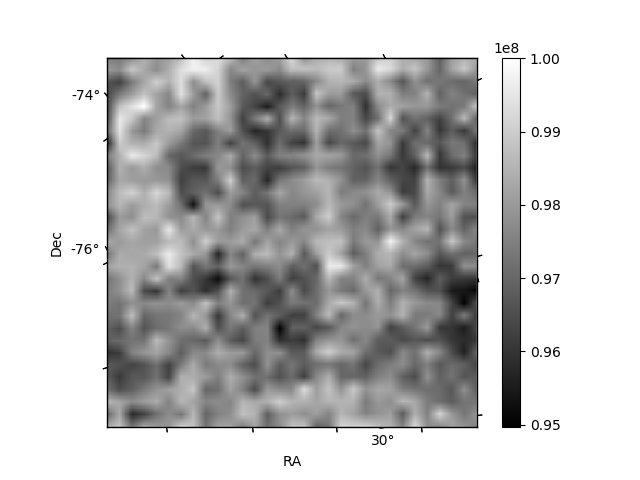
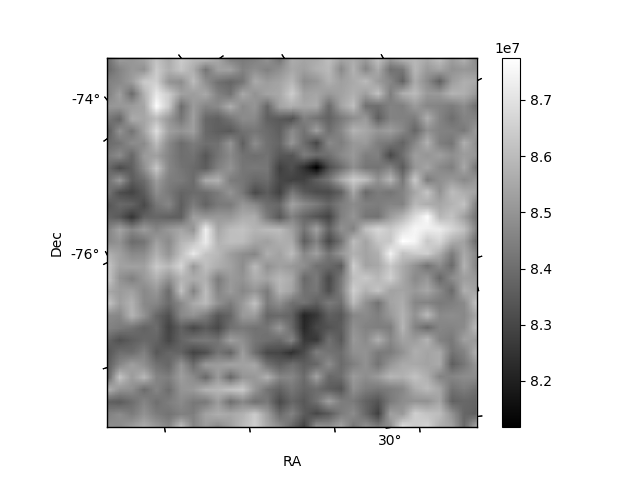
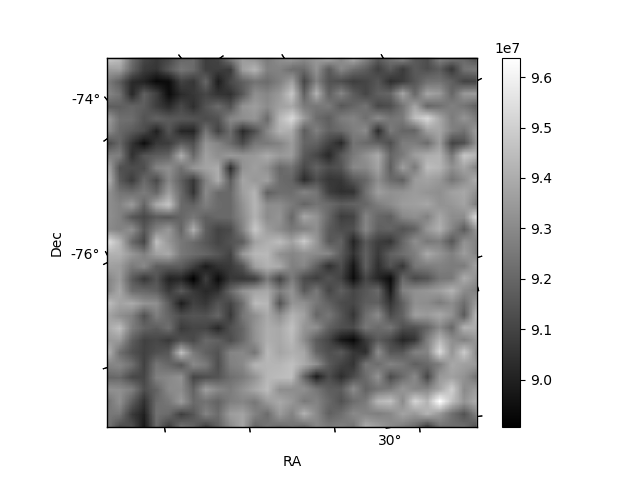
Histogram calculated using DETX and DETY for each event in the final _common_clean file
| Quadrant A | 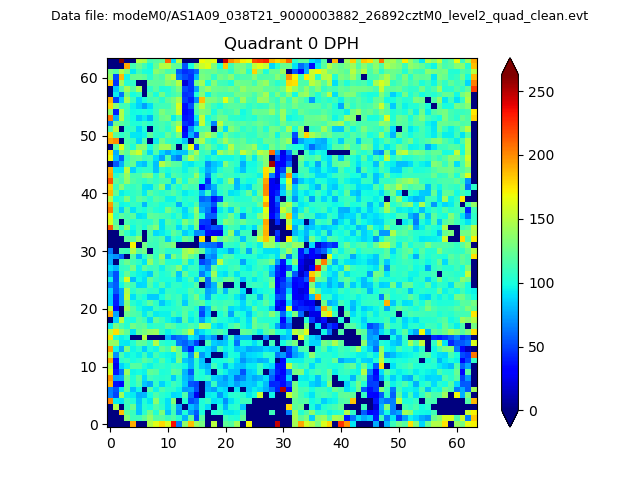 |
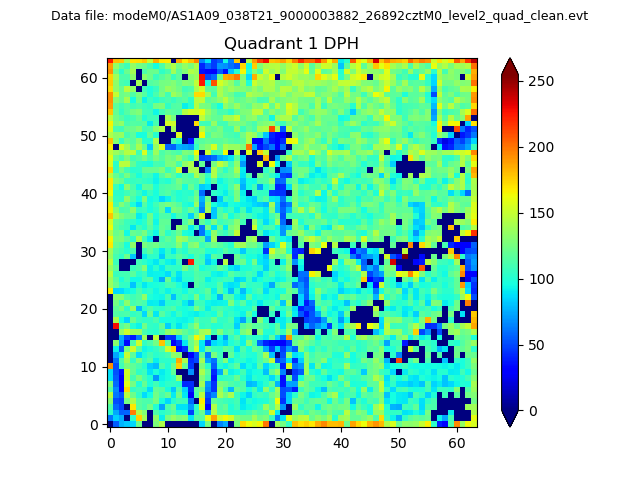 |
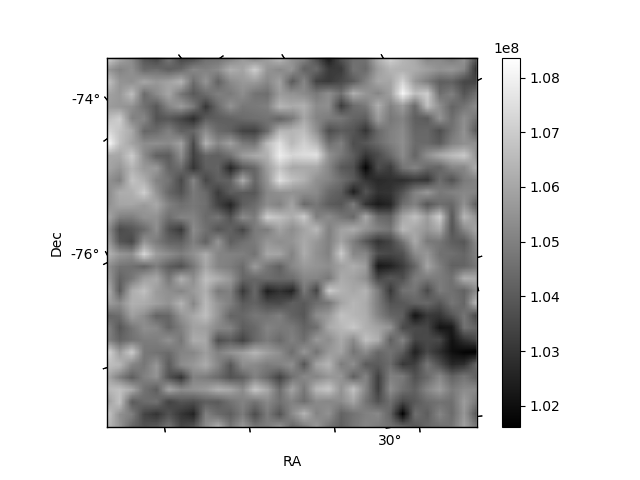
Quadrant B |
|---|---|---|---|
| Quadrant D | 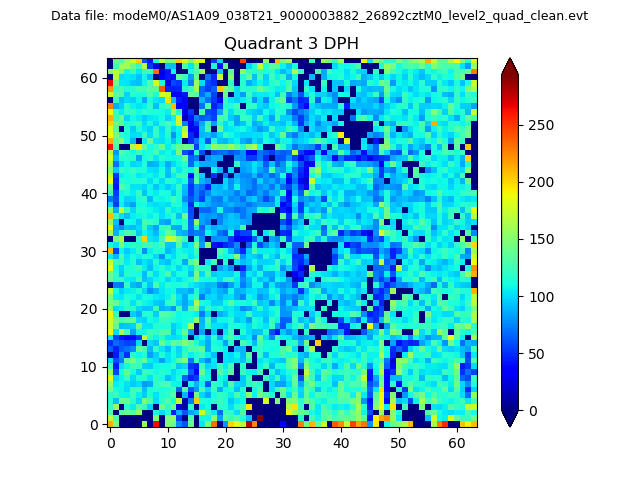 |
 |
Quadrant C |
| Plot type | Count rate plots | Images |
|---|---|---|
| Comparison with Poisson distribution Blue bars denote a histogram of data divided into 1 sec bins. Red curve is a Poisson curve with rate = median count rate of data. |
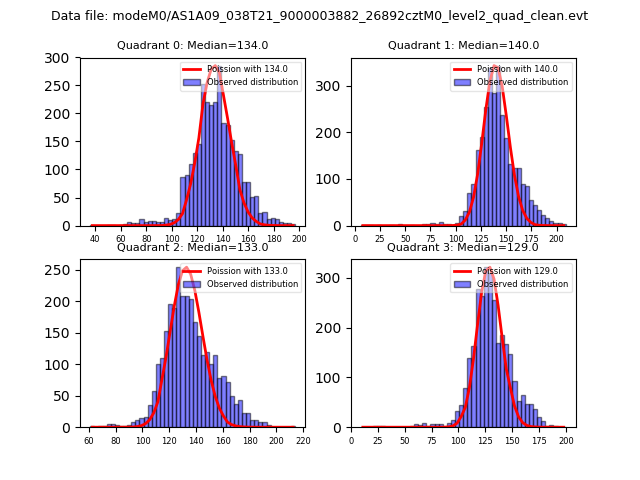 |
 |
| Quadrant-wise count rates Data is divided into 100 sec bins |
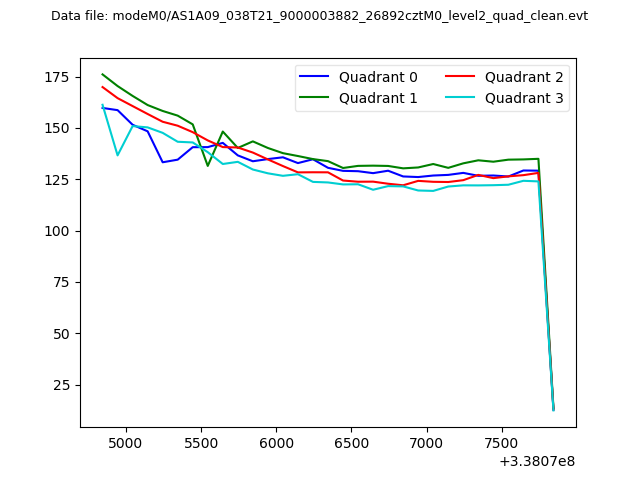 |
|
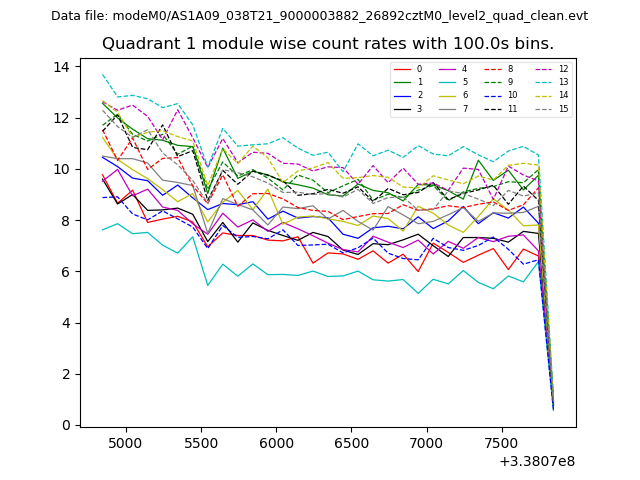
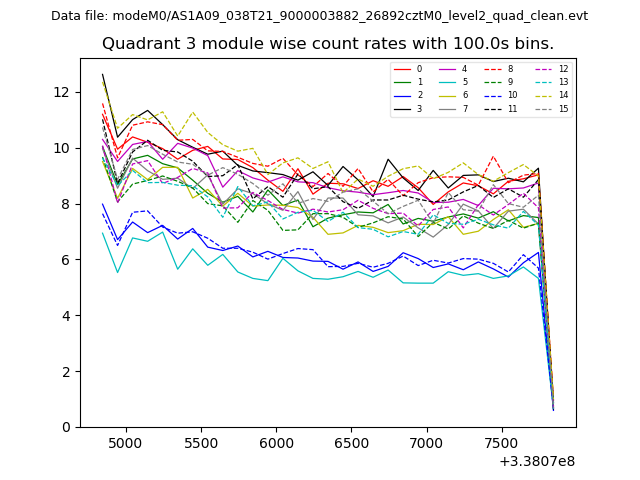
| Module-wise count rates for Quadrant A Data is divided into 100 sec bins |
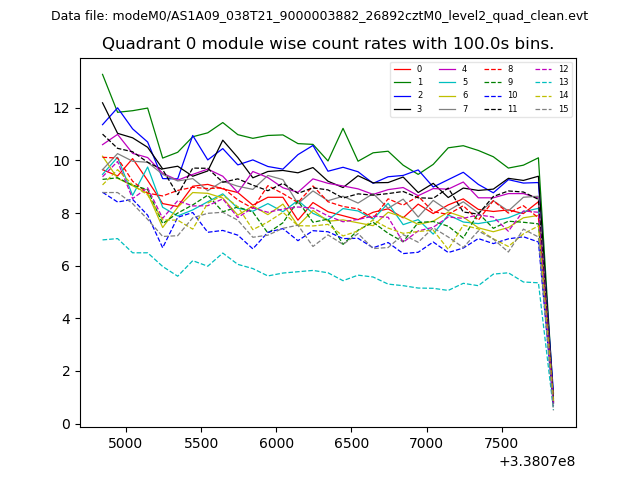 |
 |
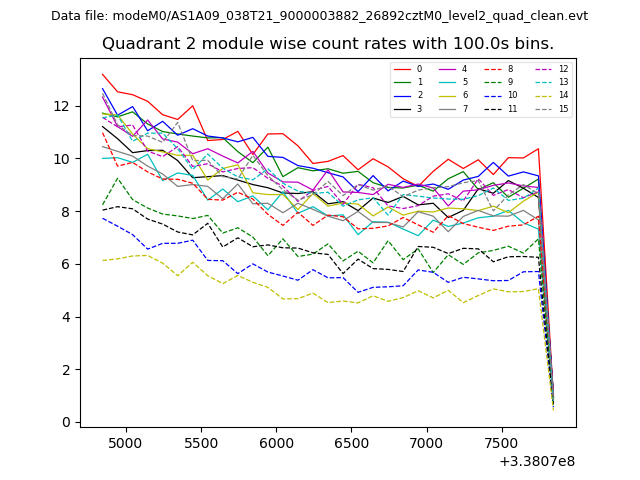
| Module-wise count rates for Quadrant B Data is divided into 100 sec bins |
 |
 |
| Module-wise count rates for Quadrant C Data is divided into 100 sec bins |
 |
 |
| Module-wise count rates for Quadrant D Data is divided into 100 sec bins |
 |
 |
| Parameter | Plot |
|---|---|
| CZT HV Monitor | 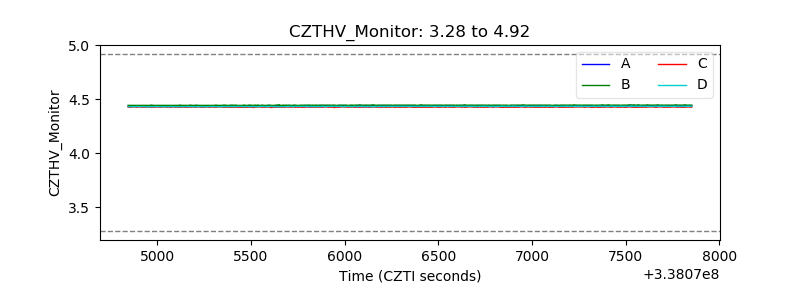 |
| D_VDD | 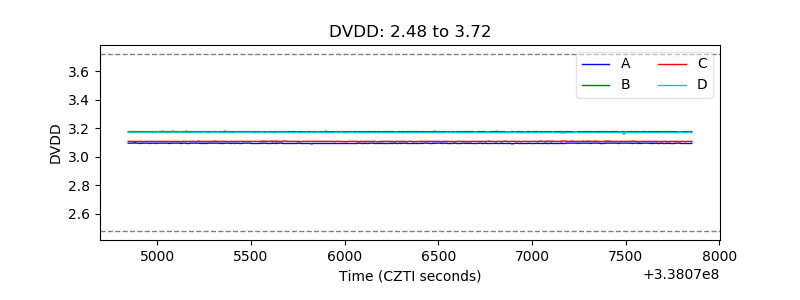 |
| Temperature 1 | 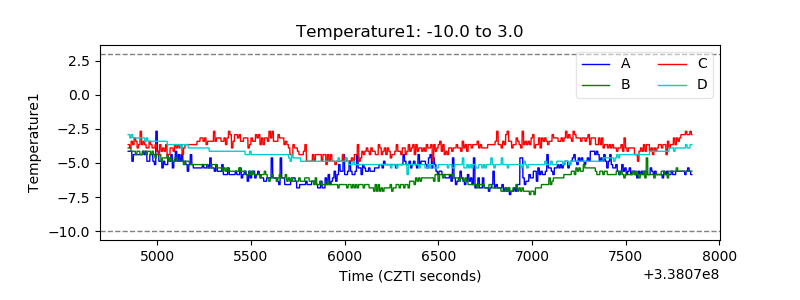 |
| Veto HV Monitor | 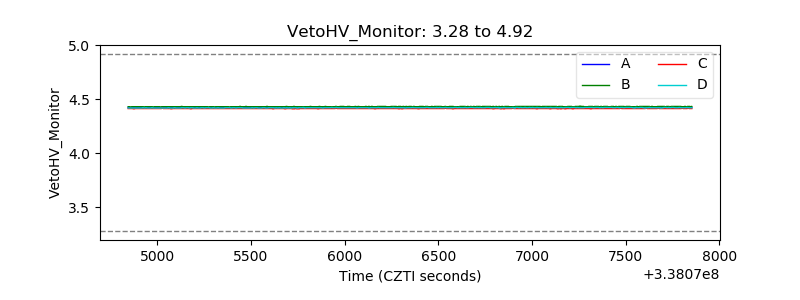 |
| Veto LLD | 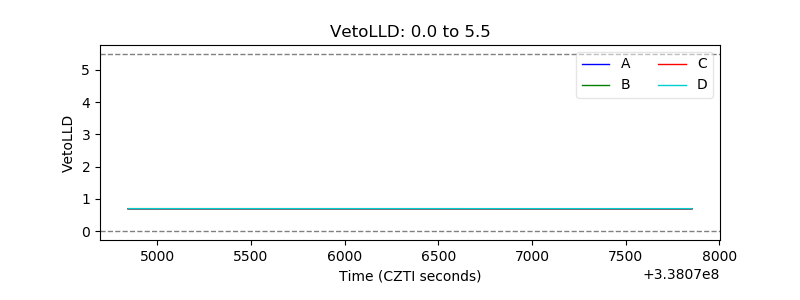 |
| Alpha Counter | 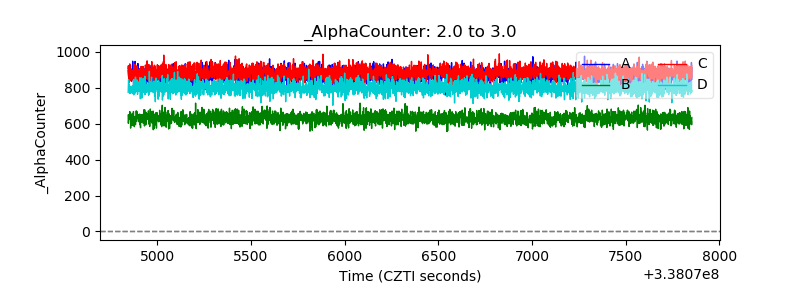 |
| _CPM_Rate | 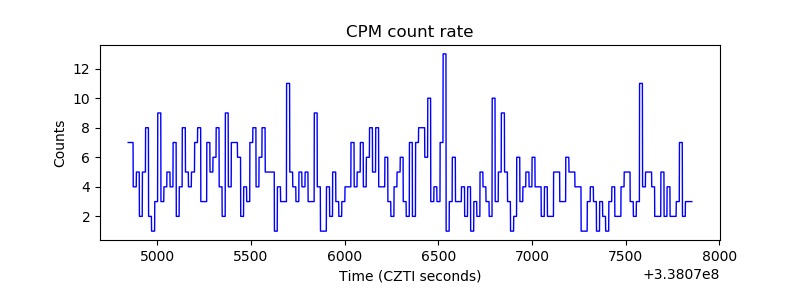 |
| CZT Counter | 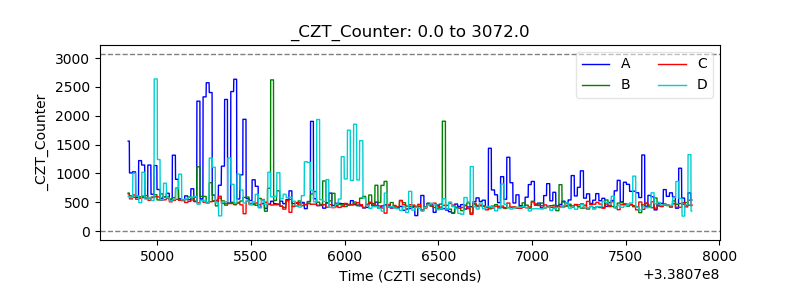 |
| +2.5 Volts monitor | 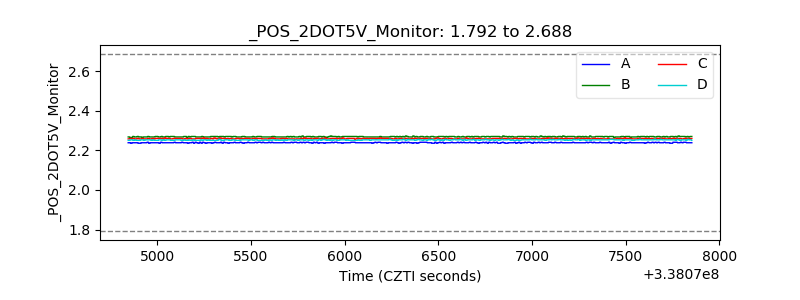 |
| +5 Volts monitor | 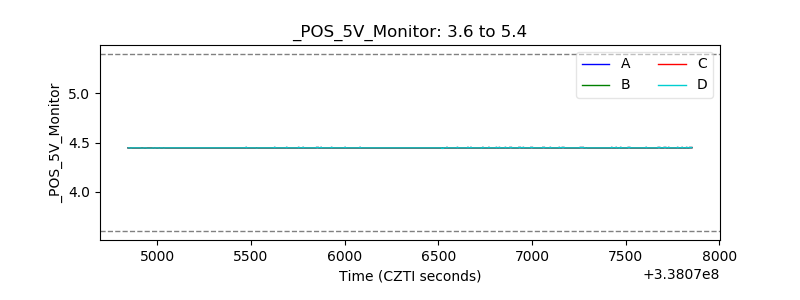 |
| _ROLL_ROT | 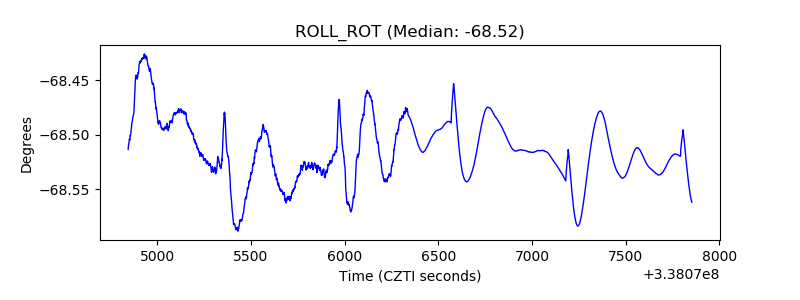 |
| _Roll_DEC | 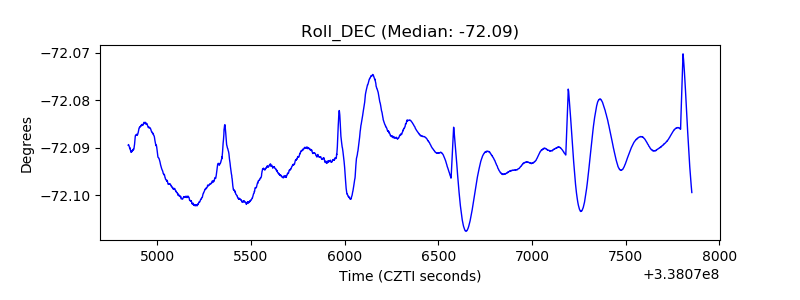 |
| _Roll_RA | 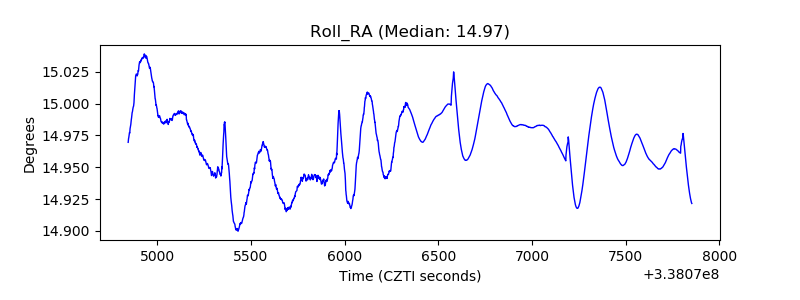 |
| Veto Counter | 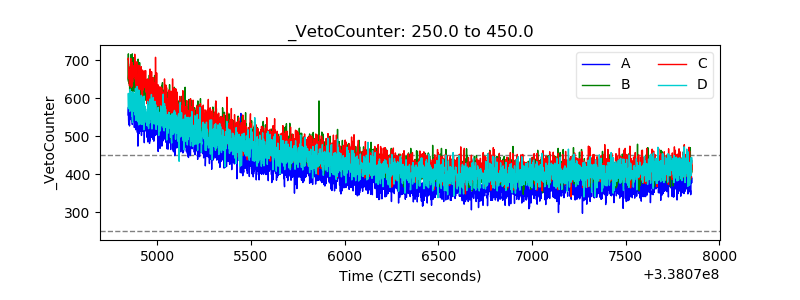 |