| Param | Original file | Final file |
|---|---|---|
| Filename | modeM0/AS1T03_230T01_9000003874cztM0_level2.fits | modeM0/AS1T03_230T01_9000003874cztM0_level2_quad_clean.evt |
| Size (bytes) | 109,831,680 | 148,518,720 |
| Size | 104.7 MB | 141.6 MB |
| Events in quadrant A | 656,386 | 947,543 |
| Events in quadrant B | 638,428 | 965,765 |
| Events in quadrant C | 657,572 | 944,690 |
| Events in quadrant D | 563,700 | 829,805 |
| Mode SS | |||
|---|---|---|---|
| Quadrant | BADHDUFLAG | Total packets | Discarded packets |
| A | 0 | 240 | 0 |
| B | 0 | 240 | 0 |
| C | 0 | 240 | 0 |
| D | 0 | 240 | 0 |
| Mode M9 | |||
|---|---|---|---|
| Quadrant | BADHDUFLAG | Total packets | Discarded packets |
| A | 0 | 5 | 0 |
| B | 0 | 5 | 0 |
| C | 0 | 5 | 0 |
| D | 0 | 5 | 0 |
| Mode M0 | |||
|---|---|---|---|
| Quadrant | BADHDUFLAG | Total packets | Discarded packets |
| A | 0 | 30475 | 0 |
| B | 0 | 26027 | 0 |
| C | 0 | 24060 | 0 |
| D | 0 | 35176 | 0 |
| Quadrant | Total seconds | Saturated seconds | Saturation percentage |
|---|---|---|---|
| A | 11699 | 406 | 3.470382% |
| B | 11699 | 346 | 2.957518% |
| C | 11699 | 266 | 2.273699% |
| D | 11699 | 718 | 6.137277% |
Noise dominated data is calculated using 1-second bins in cleaned event files. If a bin has >2000 counts, and if more than 50% of those come from <1% of pixels, then it is considered to be noise-dominated and hence unusable.
| Quadrant | # 1 sec bins | Bins with >0 counts | Bins with >2000 counts | High rate bins dominated by noise | Noise dominated (total time) | Noise dominated (detector-on time) | Marked lightcurve |
|---|---|---|---|---|---|---|---|
| A | 12309 | 11697 | 0 | 0 | 0.00% | 0.00% |  |
| B | 12309 | 11696 | 0 | 0 | 0.00% | 0.00% |  |
| C | 12309 | 11698 | 0 | 0 | 0.00% | 0.00% | 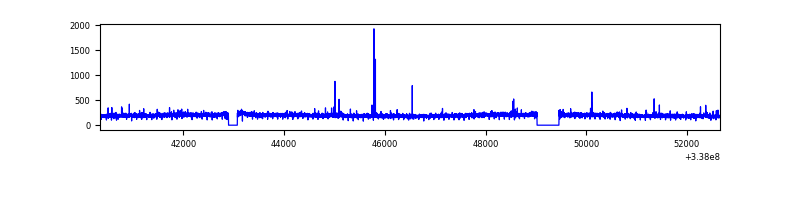 |
| D | 12309 | 11683 | 0 | 0 | 0.00% | 0.00% |  |
Top three noisy pixels from each quadrant. If the there are fewer than three noisy pixels in the level2.evt file, extra rows are filled as -1
| Pixel properties | Quadrant properties | ||||||
|---|---|---|---|---|---|---|---|
| Quadrant | DetID | PixID | Counts | Sigma | Mean | Median | Sigma |
| A | 0 | 29 | 565 | 9.12 | 171 | 160 | 44.4 |
| A | 7 | 110 | 539 | 8.54 | 171 | 160 | 44.4 |
| A | 14 | 95 | 529 | 8.31 | 171 | 160 | 44.4 |
| B | 2 | 9 | 532 | 10.47 | 169 | 161 | 35.4 |
| B | 3 | 17 | 423 | 7.4 | 169 | 161 | 35.4 |
| B | 14 | 254 | 415 | 7.17 | 169 | 161 | 35.4 |
| C | 1 | 81 | 538 | 8.21 | 173 | 162 | 45.8 |
| C | 1 | 80 | 521 | 7.84 | 173 | 162 | 45.8 |
| C | 12 | 241 | 472 | 6.77 | 173 | 162 | 45.8 |
| D | 3 | 14 | 449 | 6.84 | 160 | 146 | 44.3 |
| D | 6 | 67 | 424 | 6.28 | 160 | 146 | 44.3 |
| D | 10 | 113 | 400 | 5.73 | 160 | 146 | 44.3 |
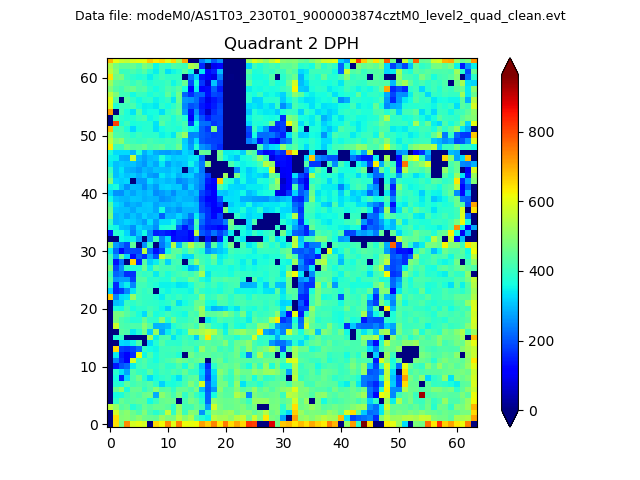
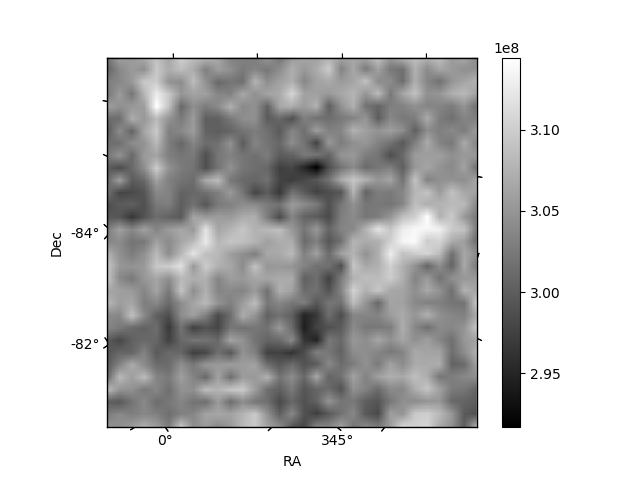
Histogram calculated using DETX and DETY for each event in the final _common_clean file
| Quadrant A | 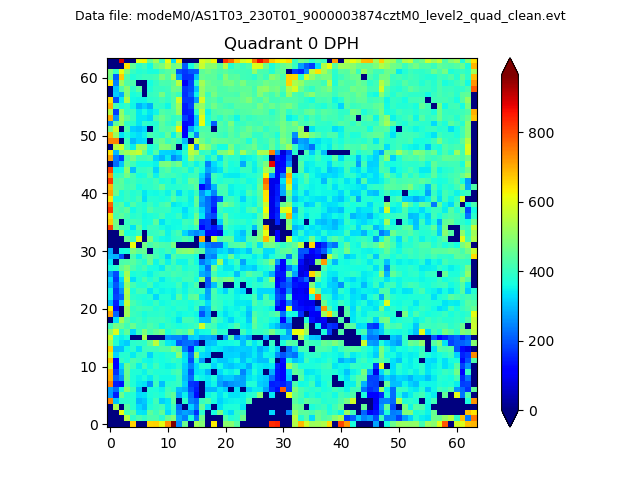 |
 |
Quadrant B |
|---|---|---|---|
| Quadrant D |  |
 |
Quadrant C |
| Plot type | Count rate plots | Images |
|---|---|---|
| Comparison with Poisson distribution Blue bars denote a histogram of data divided into 1 sec bins. Red curve is a Poisson curve with rate = median count rate of data. |
 |
 |
| Quadrant-wise count rates Data is divided into 100 sec bins |
 |
|
| Module-wise count rates for Quadrant A Data is divided into 100 sec bins |
 |
 |
| Module-wise count rates for Quadrant B Data is divided into 100 sec bins |
 |
 |
| Module-wise count rates for Quadrant C Data is divided into 100 sec bins |
 |
 |
| Module-wise count rates for Quadrant D Data is divided into 100 sec bins |
 |
 |
| Parameter | Plot |
|---|---|
| CZT HV Monitor |  |
| D_VDD |  |
| Temperature 1 |  |
| Veto HV Monitor |  |
| Veto LLD |  |
| Alpha Counter |  |
| _CPM_Rate |  |
| CZT Counter |  |
| +2.5 Volts monitor | 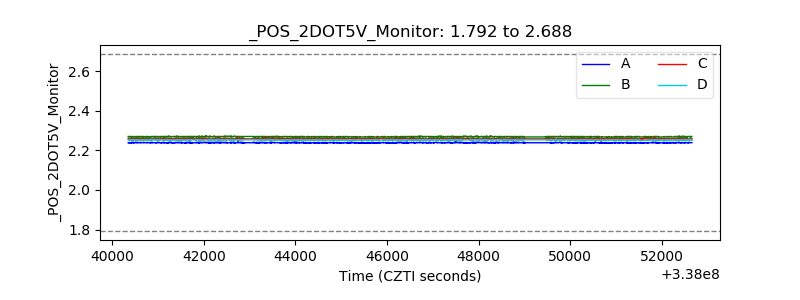 |
| +5 Volts monitor |  |
| _ROLL_ROT |  |
| _Roll_DEC |  |
| _Roll_RA |  |
| Veto Counter |  |