| Param | Original file | Final file |
|---|---|---|
| Filename | modeM0/AS1T03_230T01_9000003874_26885cztM0_level2.evt | modeM0/AS1T03_230T01_9000003874_26885cztM0_level2_quad_clean.evt |
| Size (bytes) | 348,379,200 | 83,701,440 |
| Size | 332.2 MB | 79.8 MB |
| Events in quadrant A | 2,855,986 | 552,538 |
| Events in quadrant B | 2,379,829 | 572,672 |
| Events in quadrant C | 2,149,487 | 557,386 |
| Events in quadrant D | 2,868,997 | 545,814 |
| Mode M9 | |||
|---|---|---|---|
| Quadrant | BADHDUFLAG | Total packets | Discarded packets |
| A | 0 | 1 | 0 |
| B | 0 | 1 | 0 |
| C | 0 | 1 | 0 |
| D | 0 | 1 | 0 |
| Mode M0 | |||
|---|---|---|---|
| Quadrant | BADHDUFLAG | Total packets | Discarded packets |
| A | 0 | 11400 | 0 |
| B | 0 | 9740 | 0 |
| C | 0 | 9066 | 0 |
| D | 0 | 11353 | 0 |
| Quadrant | Total seconds | Saturated seconds | Saturation percentage |
|---|---|---|---|
| A | 4347 | 271 | 6.234184% |
| B | 4347 | 222 | 5.106970% |
| C | 4347 | 178 | 4.094778% |
| D | 4346 | 214 | 4.924068% |
Noise dominated data is calculated using 1-second bins in cleaned event files. If a bin has >2000 counts, and if more than 50% of those come from <1% of pixels, then it is considered to be noise-dominated and hence unusable.
| Quadrant | # 1 sec bins | Bins with >0 counts | Bins with >2000 counts | High rate bins dominated by noise | Noise dominated (total time) | Noise dominated (detector-on time) | Marked lightcurve |
|---|---|---|---|---|---|---|---|
| A | 4522 | 4348 | 37 | 37 | 0.82% | 0.85% | 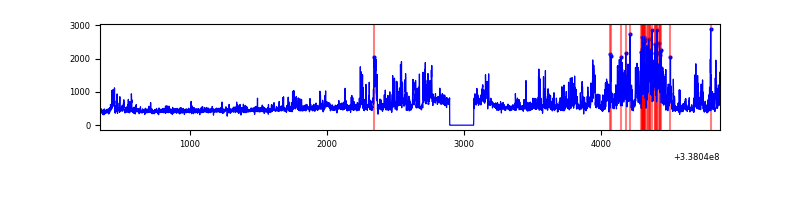 |
| B | 4522 | 4347 | 35 | 35 | 0.77% | 0.81% | 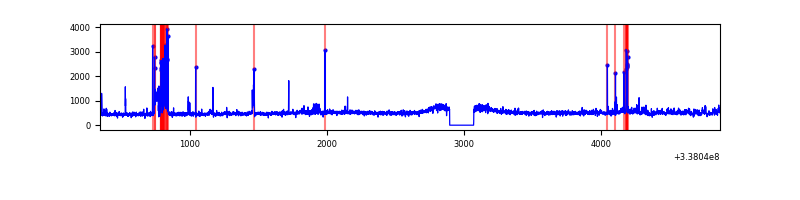 |
| C | 4522 | 4347 | 0 | 0 | 0.00% | 0.00% | 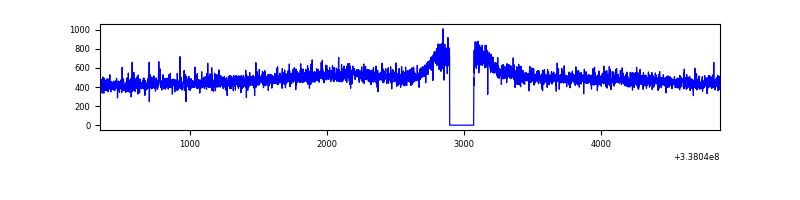 |
| D | 4521 | 4347 | 105 | 105 | 2.32% | 2.42% | 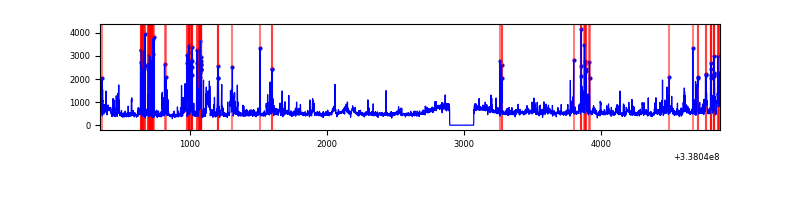 |
Top three noisy pixels from each quadrant. If the there are fewer than three noisy pixels in the level2.evt file, extra rows are filled as -1
| Pixel properties | Quadrant properties | ||||||
|---|---|---|---|---|---|---|---|
| Quadrant | DetID | PixID | Counts | Sigma | Mean | Median | Sigma |
| A | 0 | 13 | 650843 | 5927.19 | 536 | 523 | 109.7 |
| A | 6 | 16 | 135176 | 1227.26 | 536 | 523 | 109.7 |
| A | 13 | 254 | 6875 | 57.89 | 536 | 523 | 109.7 |
| B | 3 | 64 | 162646 | 1563.1 | 537 | 520 | 103.7 |
| B | 3 | 112 | 40335 | 383.87 | 537 | 520 | 103.7 |
| B | 10 | 246 | 36769 | 349.49 | 537 | 520 | 103.7 |
| C | 14 | 238 | 83891 | 678.75 | 526 | 528 | 122.8 |
| C | 8 | 128 | 4647 | 33.54 | 526 | 528 | 122.8 |
| C | 2 | 16 | 4155 | 29.53 | 526 | 528 | 122.8 |
| D | 7 | 80 | 394876 | 3159.93 | 529 | 514 | 124.8 |
| D | 1 | 52 | 202621 | 1619.44 | 529 | 514 | 124.8 |
| D | 2 | 250 | 135135 | 1078.69 | 529 | 514 | 124.8 |
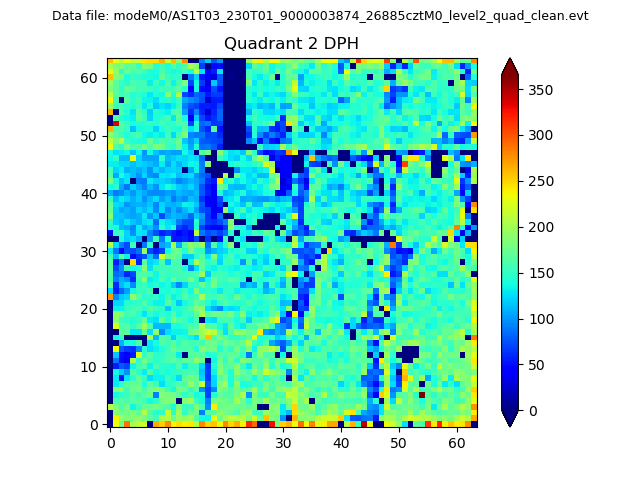
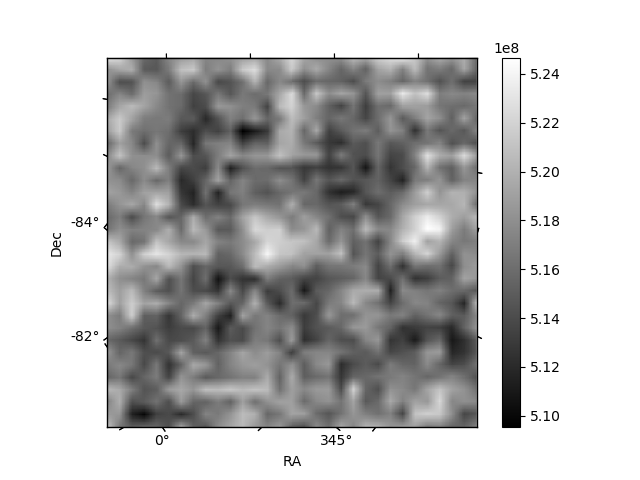
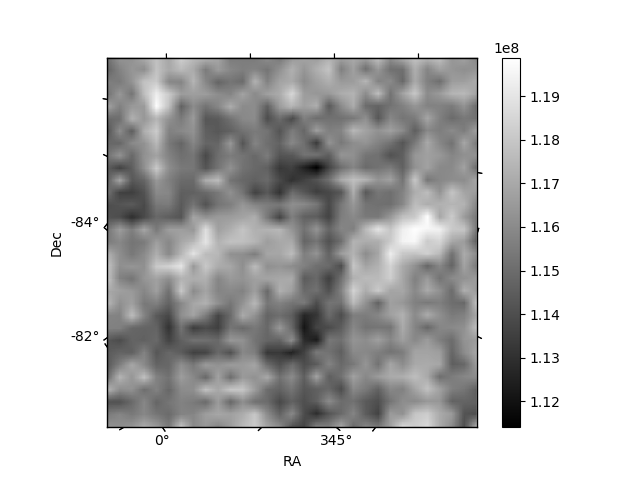
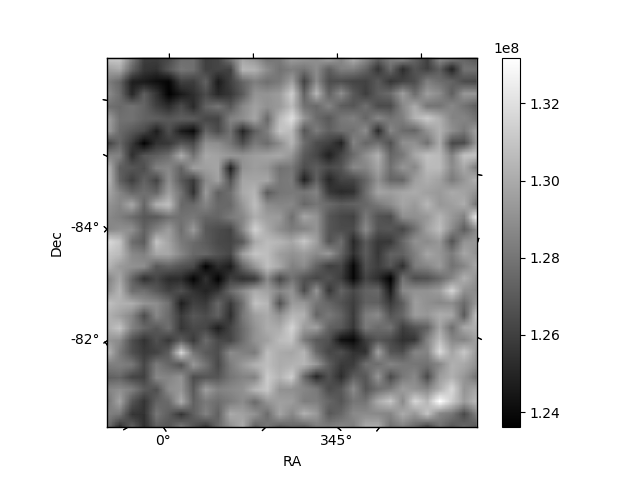
Histogram calculated using DETX and DETY for each event in the final _common_clean file
| Quadrant A | 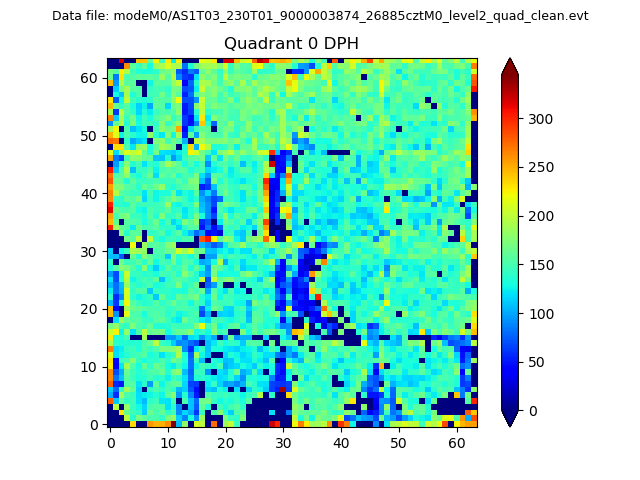 |
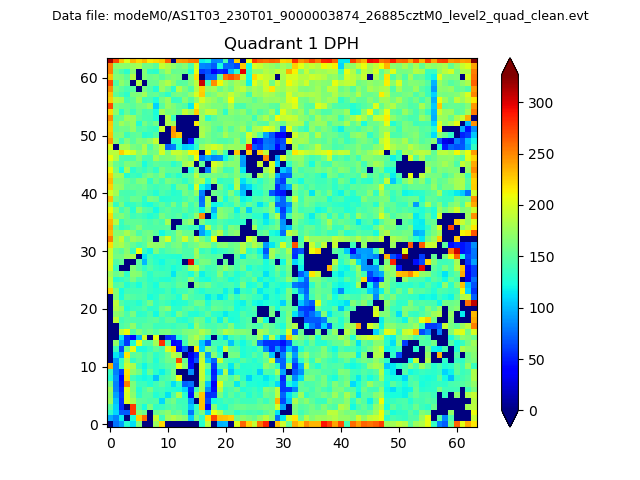 |
Quadrant B |
|---|---|---|---|
| Quadrant D | 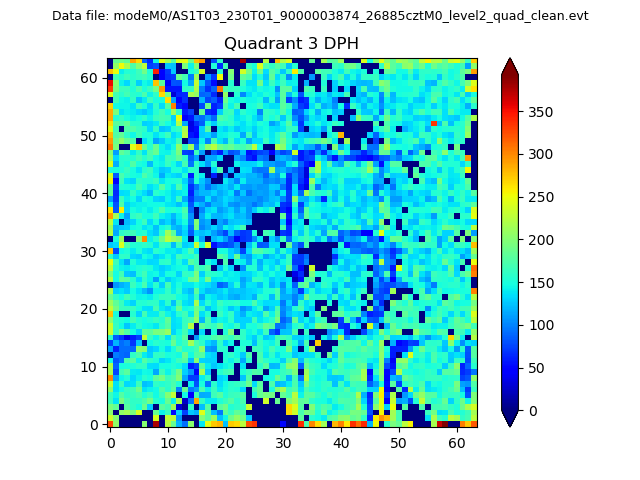 |
 |
Quadrant C |
| Plot type | Count rate plots | Images |
|---|---|---|
| Comparison with Poisson distribution Blue bars denote a histogram of data divided into 1 sec bins. Red curve is a Poisson curve with rate = median count rate of data. |
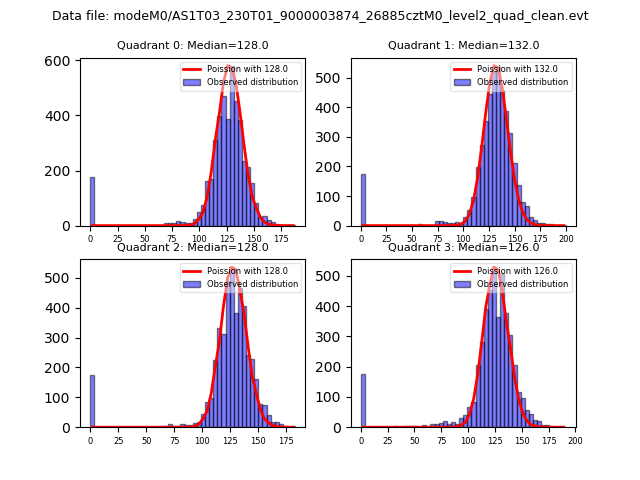 |
 |
| Quadrant-wise count rates Data is divided into 100 sec bins |
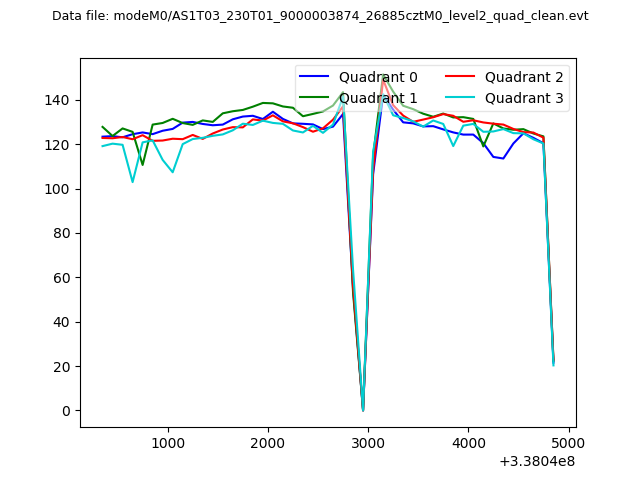 |
|
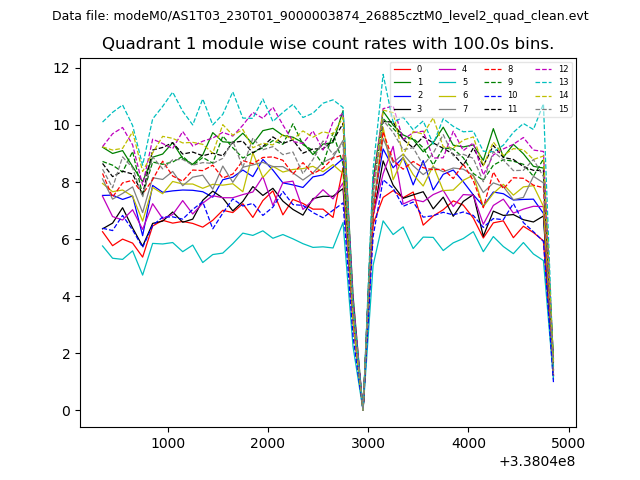
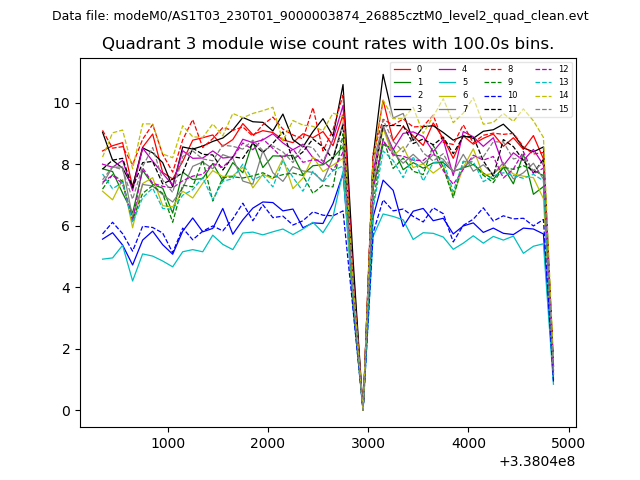
| Module-wise count rates for Quadrant A Data is divided into 100 sec bins |
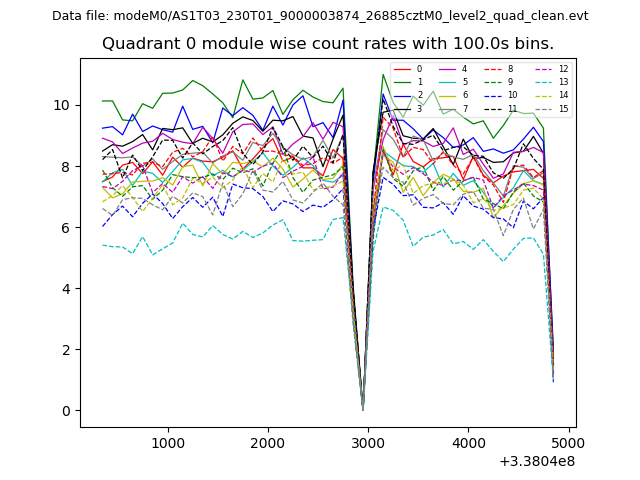 |
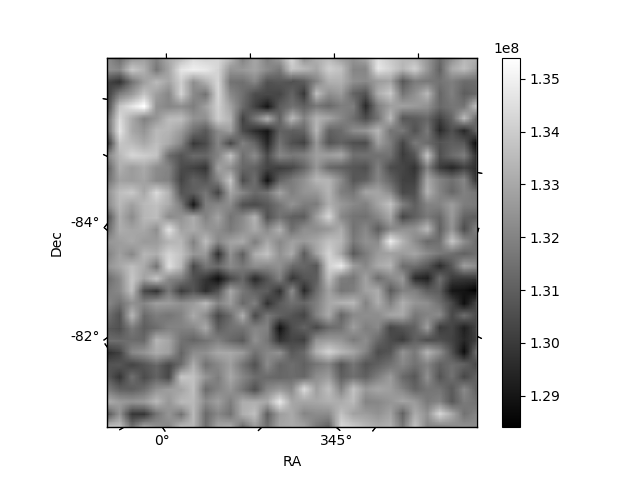 |
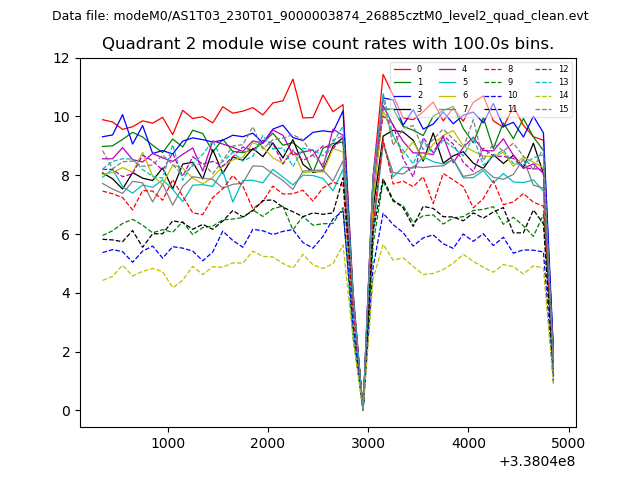
| Module-wise count rates for Quadrant B Data is divided into 100 sec bins |
 |
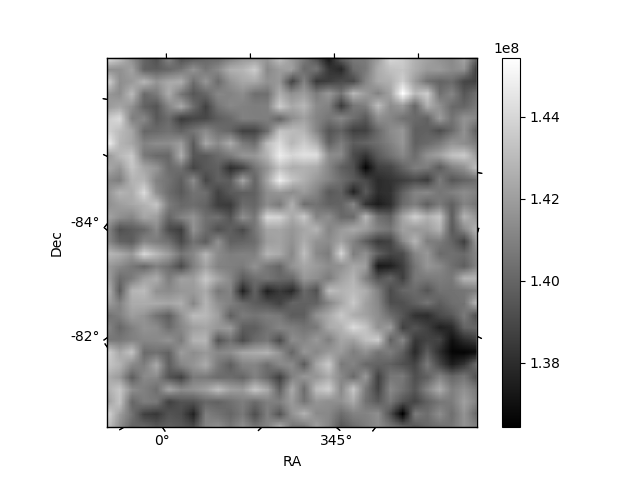 |
| Module-wise count rates for Quadrant C Data is divided into 100 sec bins |
 |
 |
| Module-wise count rates for Quadrant D Data is divided into 100 sec bins |
 |
 |
| Parameter | Plot |
|---|---|
| CZT HV Monitor |  |
| D_VDD | 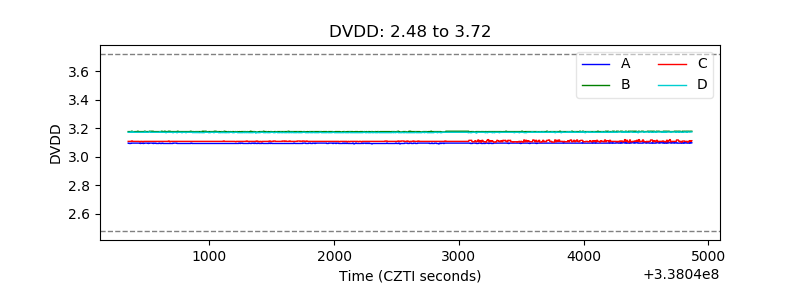 |
| Temperature 1 | 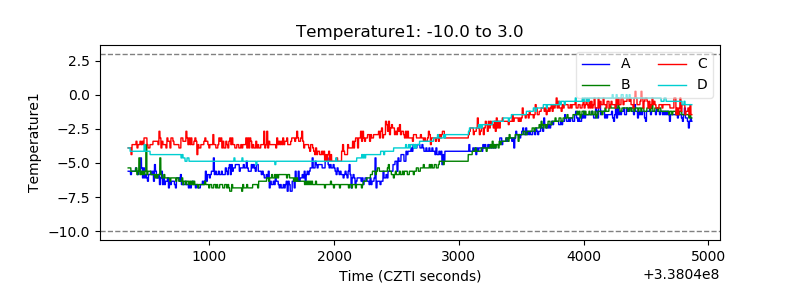 |
| Veto HV Monitor | 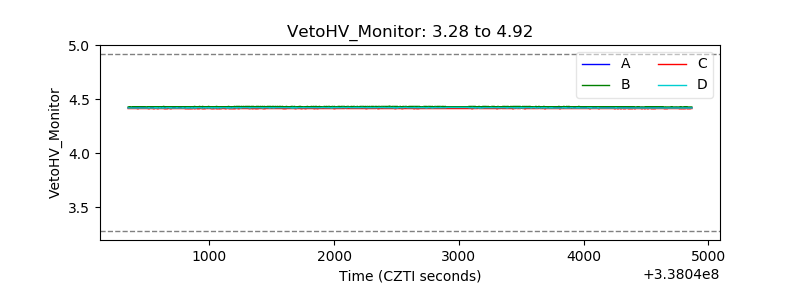 |
| Veto LLD | 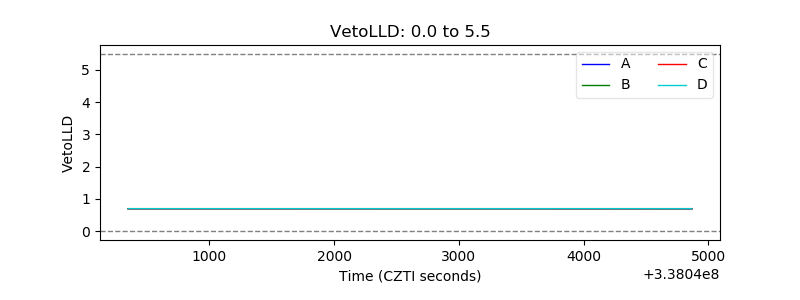 |
| Alpha Counter | 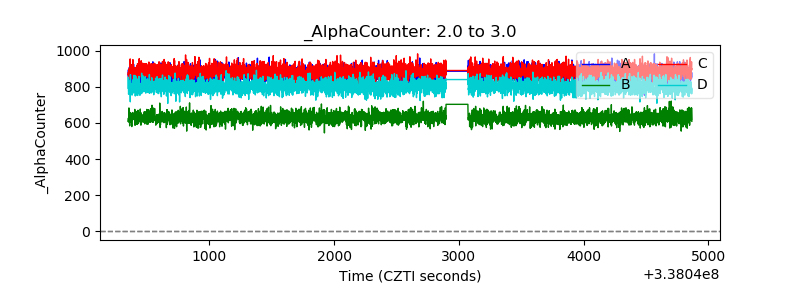 |
| _CPM_Rate | 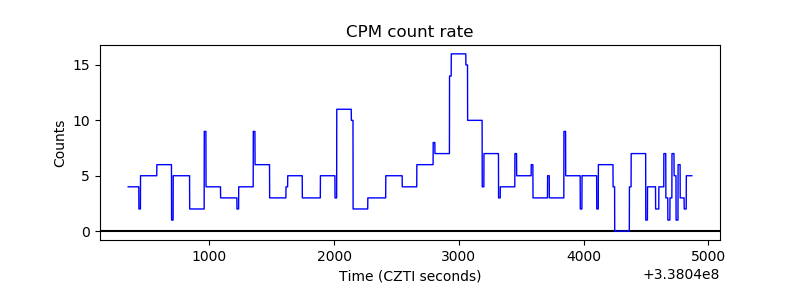 |
| CZT Counter | 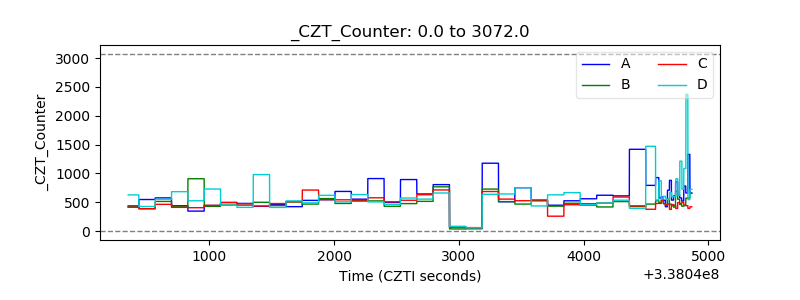 |
| +2.5 Volts monitor |  |
| +5 Volts monitor |  |
| _ROLL_ROT | 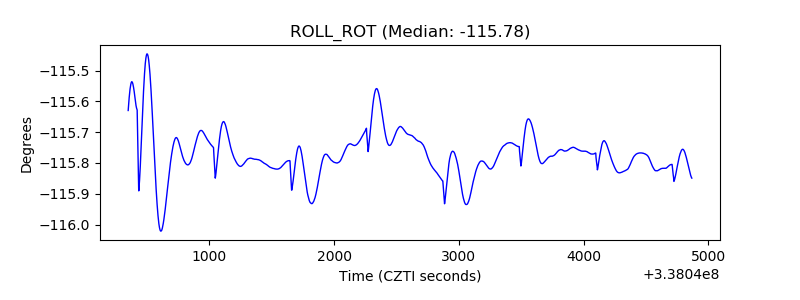 |
| _Roll_DEC | 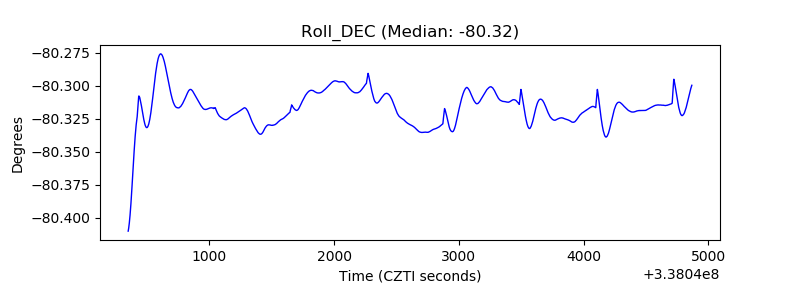 |
| _Roll_RA | 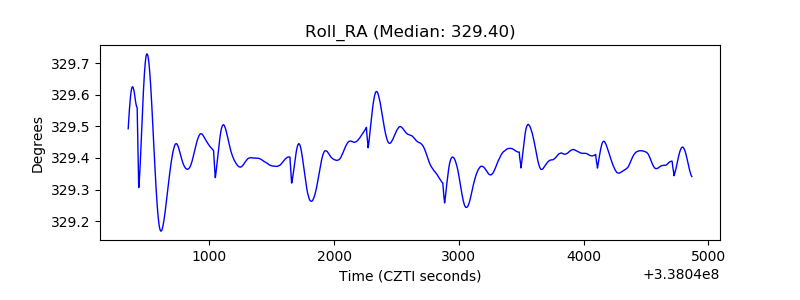 |
| Veto Counter | 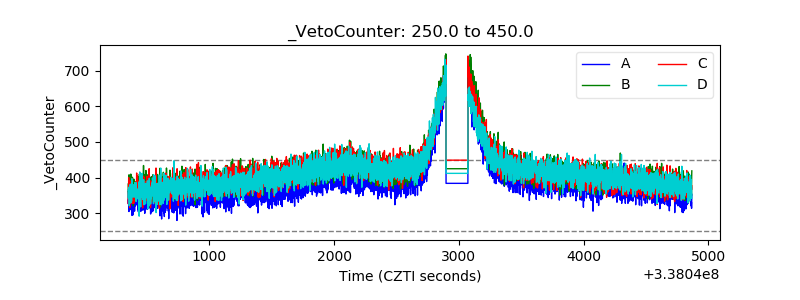 |