| Param | Original file | Final file |
|---|---|---|
| Filename | modeM0/AS1T03_230T01_9000003874_26888cztM0_level2.evt | modeM0/AS1T03_230T01_9000003874_26888cztM0_level2_quad_clean.evt |
| Size (bytes) | 711,115,200 | 155,445,120 |
| Size | 678.2 MB | 148.2 MB |
| Events in quadrant A | 5,675,308 | 1,030,643 |
| Events in quadrant B | 4,425,769 | 1,061,218 |
| Events in quadrant C | 3,830,814 | 1,041,868 |
| Events in quadrant D | 7,038,092 | 992,646 |
| Mode M9 | |||
|---|---|---|---|
| Quadrant | BADHDUFLAG | Total packets | Discarded packets |
| A | 0 | 4 | 0 |
| B | 0 | 4 | 0 |
| C | 0 | 4 | 0 |
| D | 0 | 4 | 0 |
| Mode M0 | |||
|---|---|---|---|
| Quadrant | BADHDUFLAG | Total packets | Discarded packets |
| A | 0 | 22547 | 0 |
| B | 0 | 18575 | 0 |
| C | 0 | 17037 | 0 |
| D | 0 | 26641 | 0 |
| Quadrant | Total seconds | Saturated seconds | Saturation percentage |
|---|---|---|---|
| A | 8371 | 208 | 2.484769% |
| B | 8372 | 139 | 1.660296% |
| C | 8372 | 89 | 1.063067% |
| D | 8372 | 533 | 6.366460% |
Noise dominated data is calculated using 1-second bins in cleaned event files. If a bin has >2000 counts, and if more than 50% of those come from <1% of pixels, then it is considered to be noise-dominated and hence unusable.
| Quadrant | # 1 sec bins | Bins with >0 counts | Bins with >2000 counts | High rate bins dominated by noise | Noise dominated (total time) | Noise dominated (detector-on time) | Marked lightcurve |
|---|---|---|---|---|---|---|---|
| A | 8806 | 8371 | 104 | 104 | 1.18% | 1.24% | 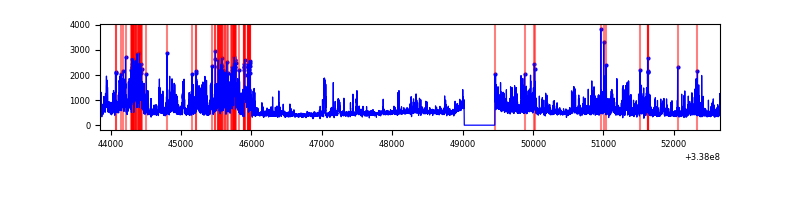 |
| B | 8807 | 8372 | 57 | 57 | 0.65% | 0.68% | 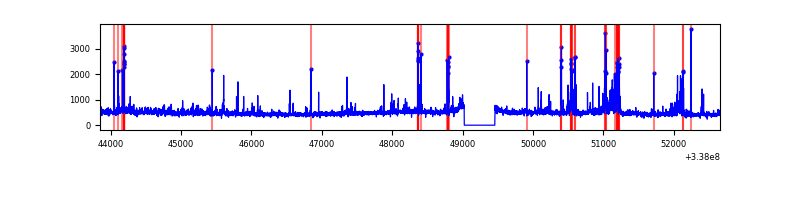 |
| C | 8807 | 8373 | 3 | 3 | 0.03% | 0.04% | 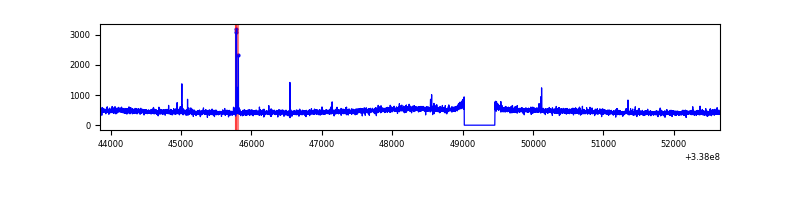 |
| D | 8807 | 8373 | 515 | 515 | 5.85% | 6.15% | 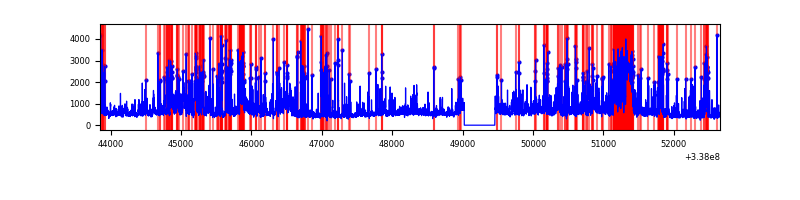 |
Top three noisy pixels from each quadrant. If the there are fewer than three noisy pixels in the level2.evt file, extra rows are filled as -1
| Pixel properties | Quadrant properties | ||||||
|---|---|---|---|---|---|---|---|
| Quadrant | DetID | PixID | Counts | Sigma | Mean | Median | Sigma |
| A | 0 | 13 | 1611846 | 8272.94 | 967 | 946 | 194.7 |
| A | 6 | 16 | 319593 | 1636.44 | 967 | 946 | 194.7 |
| A | 13 | 254 | 13311 | 63.5 | 967 | 946 | 194.7 |
| B | 3 | 64 | 224872 | 1223.43 | 965 | 940 | 183.0 |
| B | 15 | 33 | 154068 | 836.6 | 965 | 940 | 183.0 |
| B | 10 | 246 | 127947 | 693.89 | 965 | 940 | 183.0 |
| C | 14 | 238 | 152521 | 694.76 | 934 | 938 | 218.2 |
| C | 15 | 208 | 22559 | 99.1 | 934 | 938 | 218.2 |
| C | 2 | 16 | 10272 | 42.78 | 934 | 938 | 218.2 |
| D | 7 | 80 | 1330818 | 6244.22 | 917 | 896 | 213.0 |
| D | 11 | 176 | 952722 | 4468.99 | 917 | 896 | 213.0 |
| D | 1 | 52 | 669079 | 3137.24 | 917 | 896 | 213.0 |
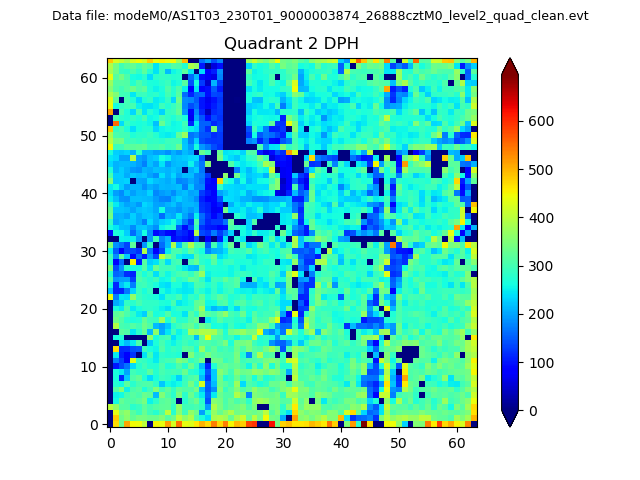
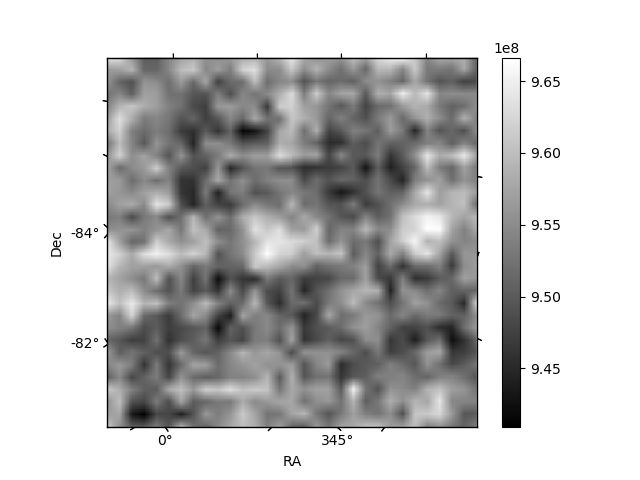
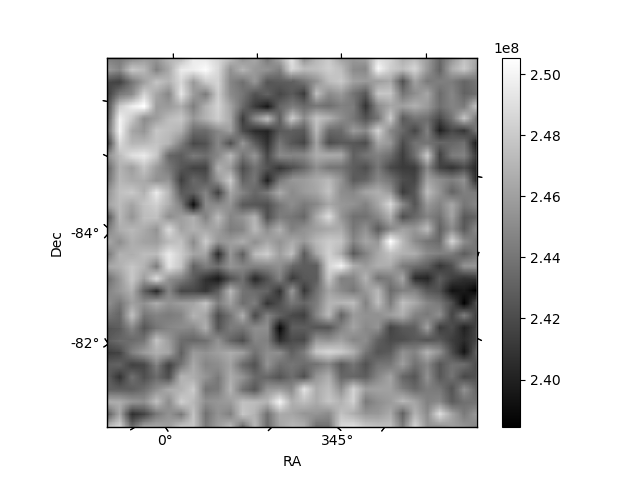
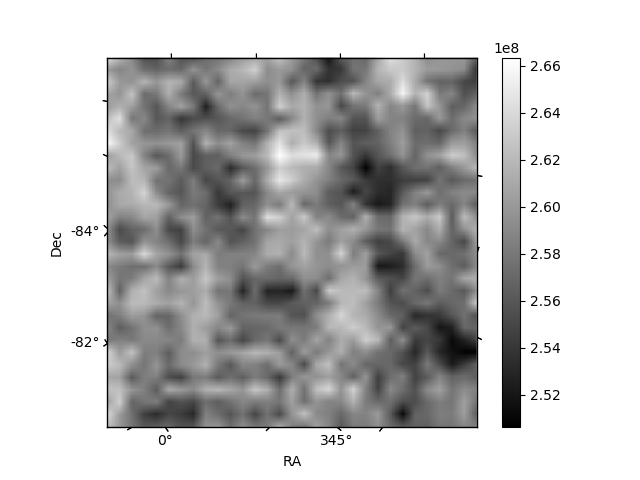
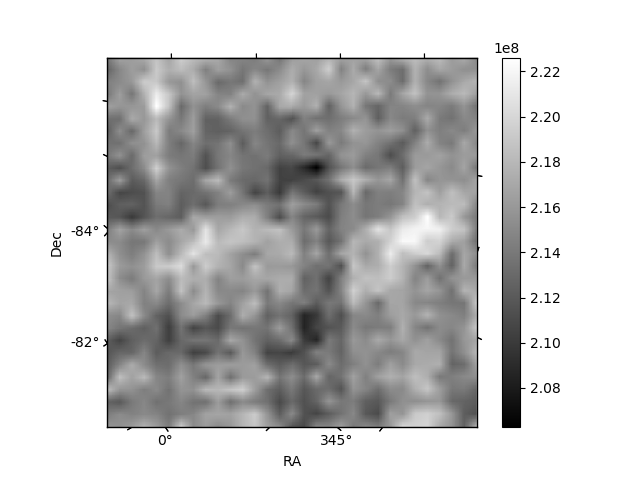
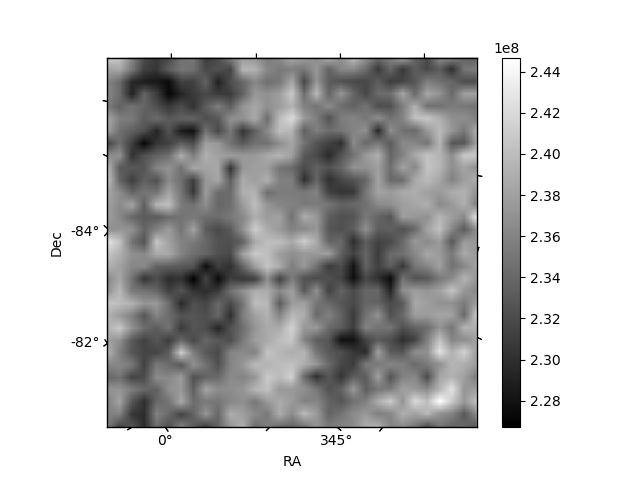
Histogram calculated using DETX and DETY for each event in the final _common_clean file
| Quadrant A | 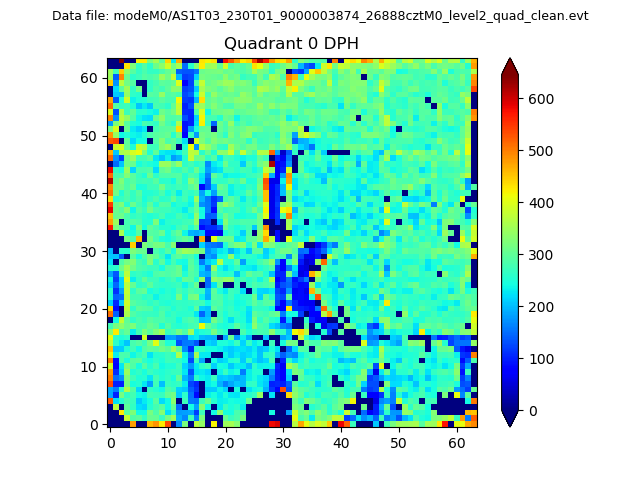 |
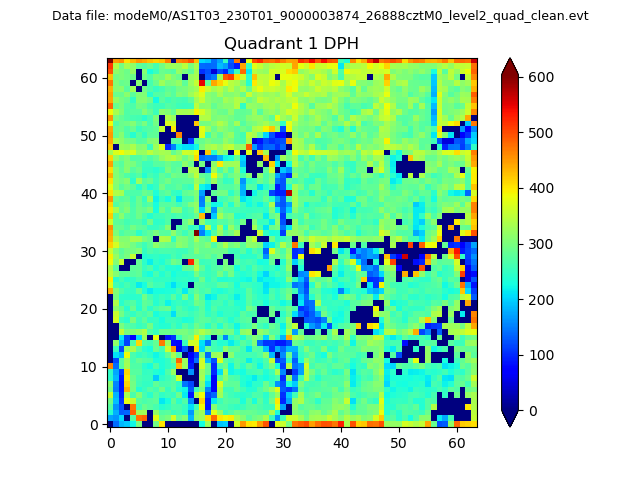 |
Quadrant B |
|---|---|---|---|
| Quadrant D | 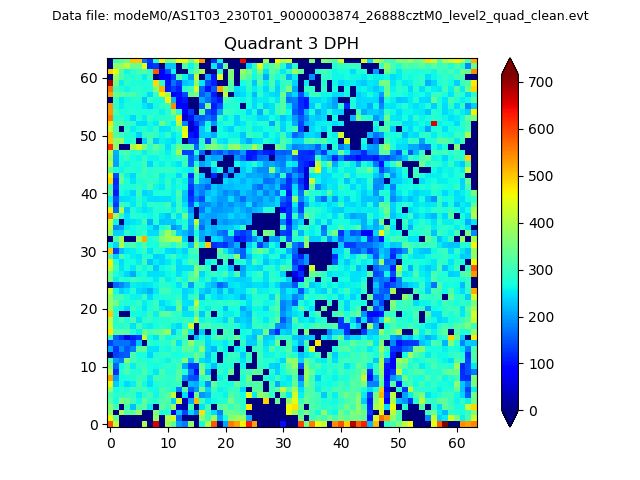 |
 |
Quadrant C |
| Plot type | Count rate plots | Images |
|---|---|---|
| Comparison with Poisson distribution Blue bars denote a histogram of data divided into 1 sec bins. Red curve is a Poisson curve with rate = median count rate of data. |
 |
 |
| Quadrant-wise count rates Data is divided into 100 sec bins |
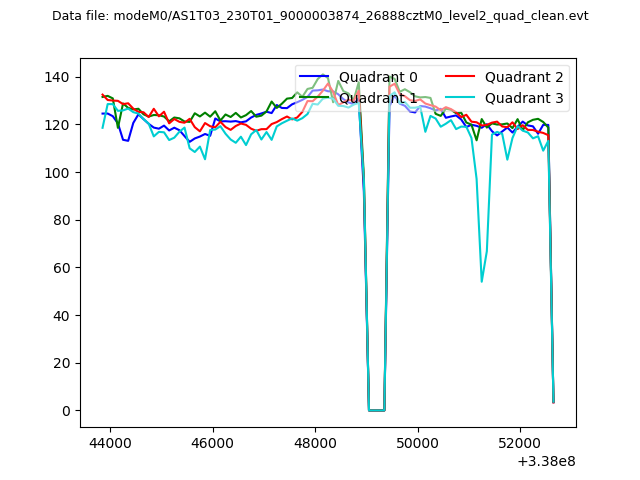 |
|
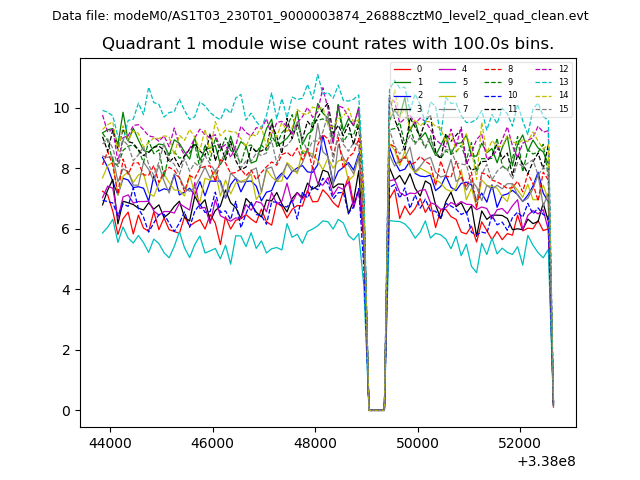
| Module-wise count rates for Quadrant A Data is divided into 100 sec bins |
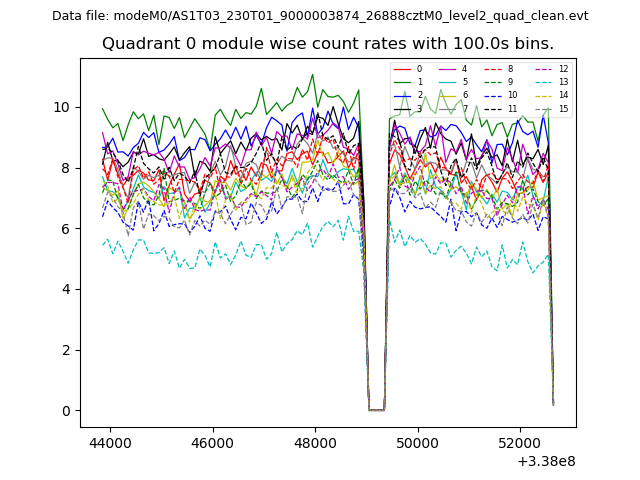 |
 |
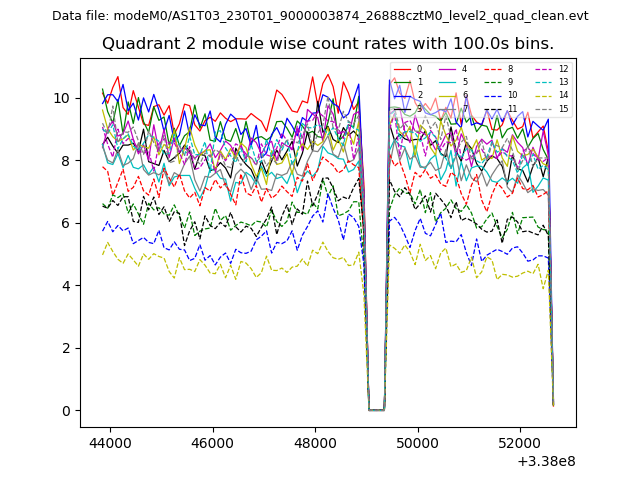
| Module-wise count rates for Quadrant B Data is divided into 100 sec bins |
 |
 |
| Module-wise count rates for Quadrant C Data is divided into 100 sec bins |
 |
 |
| Module-wise count rates for Quadrant D Data is divided into 100 sec bins |
 |
 |
| Parameter | Plot |
|---|---|
| CZT HV Monitor | 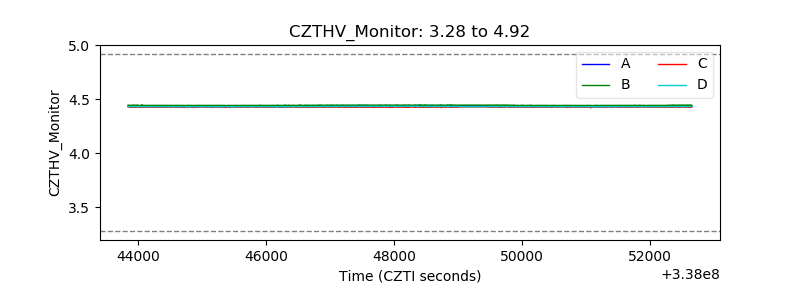 |
| D_VDD | 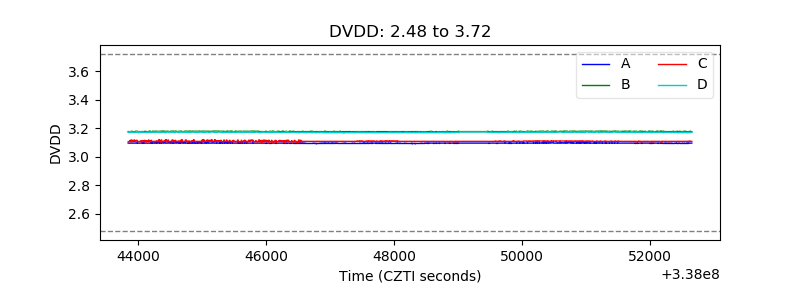 |
| Temperature 1 | 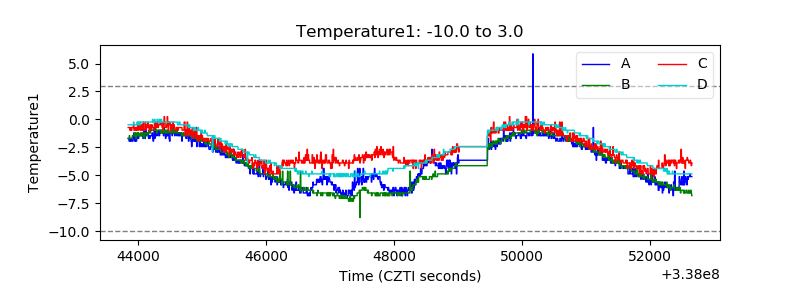 |
| Veto HV Monitor | 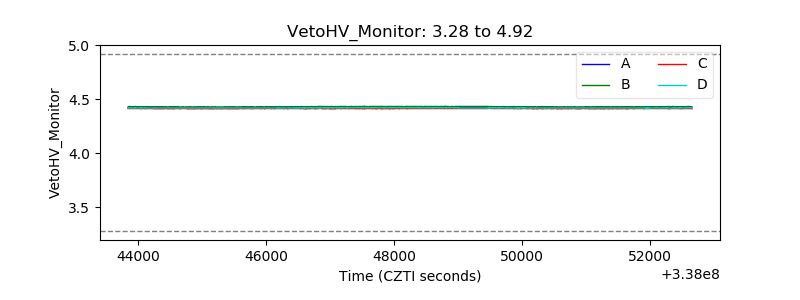 |
| Veto LLD | 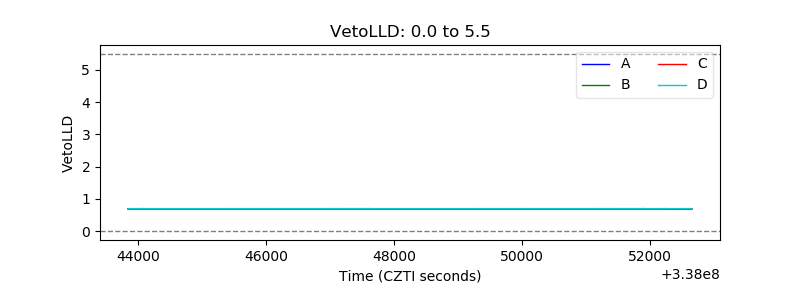 |
| Alpha Counter | 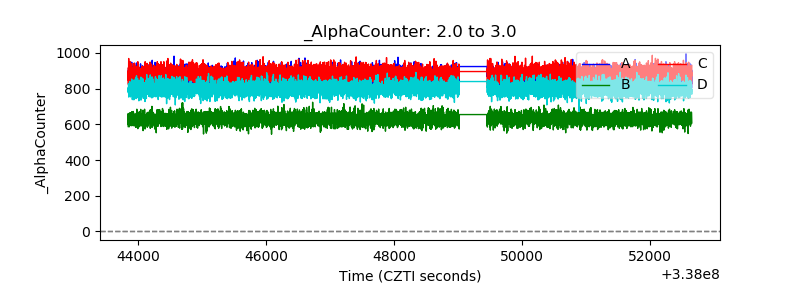 |
| _CPM_Rate | 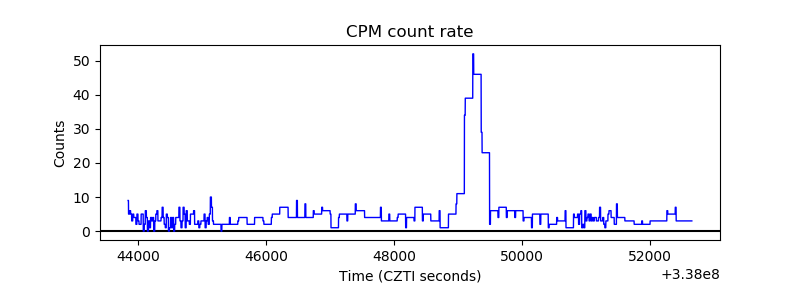 |
| CZT Counter | 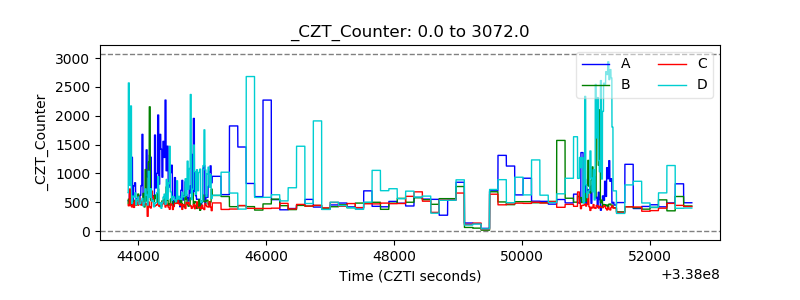 |
| +2.5 Volts monitor |  |
| +5 Volts monitor | 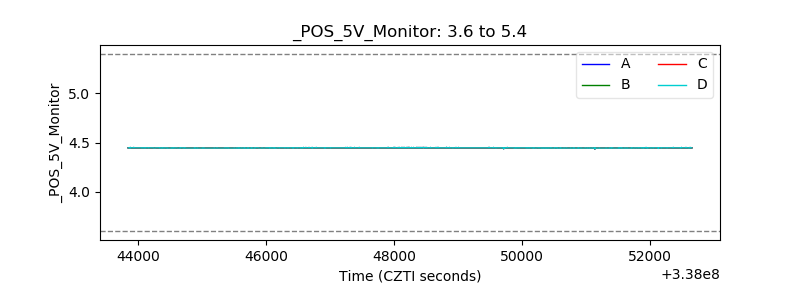 |
| _ROLL_ROT | 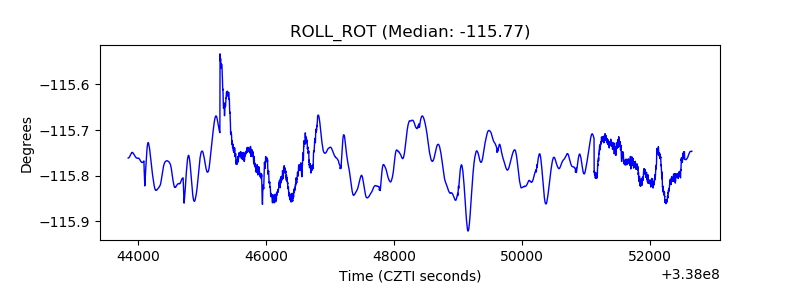 |
| _Roll_DEC | 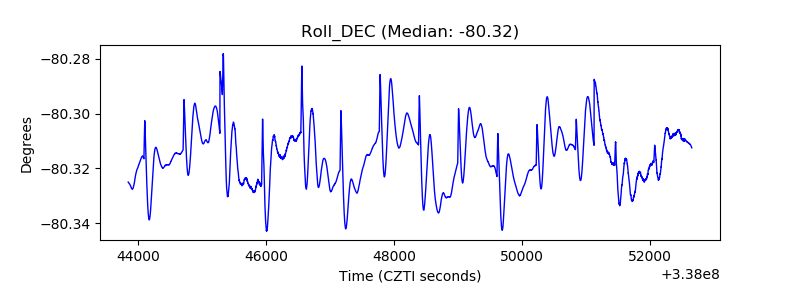 |
| _Roll_RA | 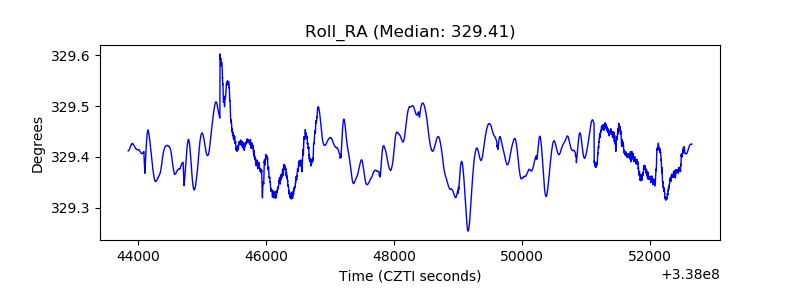 |
| Veto Counter |  |