| Param | Original file | Final file |
|---|---|---|
| Filename | modeM0/AS1A09_044T01_9000003888cztM0_level2.fits | modeM0/AS1A09_044T01_9000003888cztM0_level2_quad_clean.evt |
| Size (bytes) | 447,235,200 | 256,023,360 |
| Size | 426.5 MB | 244.2 MB |
| Events in quadrant A | 2,849,998 | 1,315,745 |
| Events in quadrant B | 2,558,698 | 1,135,004 |
| Events in quadrant C | 2,809,906 | 1,284,290 |
| Events in quadrant D | 2,327,606 | 1,020,041 |
| Mode SS | |||
|---|---|---|---|
| Quadrant | BADHDUFLAG | Total packets | Discarded packets |
| A | 0 | 890 | 0 |
| B | 0 | 890 | 0 |
| C | 0 | 890 | 0 |
| D | 0 | 890 | 0 |
| Mode M0 | |||
|---|---|---|---|
| Quadrant | BADHDUFLAG | Total packets | Discarded packets |
| A | 0 | 99107 | 0 |
| B | 0 | 138765 | 0 |
| C | 0 | 92504 | 0 |
| D | 0 | 154295 | 0 |
| Mode M9 | |||
|---|---|---|---|
| Quadrant | BADHDUFLAG | Total packets | Discarded packets |
| A | 0 | 92 | 0 |
| B | 0 | 92 | 0 |
| C | 0 | 92 | 0 |
| D | 0 | 92 | 0 |
| Quadrant | Total seconds | Saturated seconds | Saturation percentage |
|---|---|---|---|
| A | 43623 | 507 | 1.162231% |
| B | 43623 | 5355 | 12.275634% |
| C | 43623 | 557 | 1.276849% |
| D | 43623 | 4371 | 10.019944% |
Noise dominated data is calculated using 1-second bins in cleaned event files. If a bin has >2000 counts, and if more than 50% of those come from <1% of pixels, then it is considered to be noise-dominated and hence unusable.
| Quadrant | # 1 sec bins | Bins with >0 counts | Bins with >2000 counts | High rate bins dominated by noise | Noise dominated (total time) | Noise dominated (detector-on time) | Marked lightcurve |
|---|---|---|---|---|---|---|---|
| A | 52903 | 43619 | 0 | 0 | 0.00% | 0.00% | 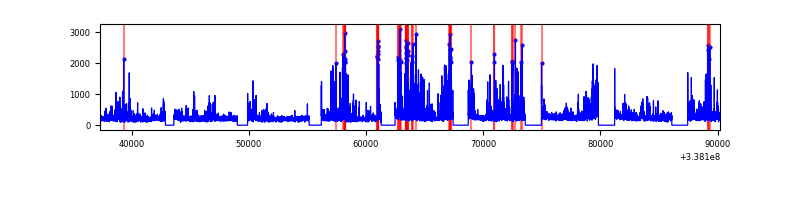 |
| B | 52902 | 43529 | 0 | 0 | 0.00% | 0.00% |  |
| C | 52903 | 43623 | 0 | 0 | 0.00% | 0.00% |  |
| D | 52903 | 43551 | 0 | 0 | 0.00% | 0.00% |  |
Top three noisy pixels from each quadrant. If the there are fewer than three noisy pixels in the level2.evt file, extra rows are filled as -1
| Pixel properties | Quadrant properties | ||||||
|---|---|---|---|---|---|---|---|
| Quadrant | DetID | PixID | Counts | Sigma | Mean | Median | Sigma |
| A | 0 | 29 | 2289 | 8.95 | 742 | 700 | 177.5 |
| A | 7 | 110 | 2255 | 8.76 | 742 | 700 | 177.5 |
| A | 0 | 30 | 2085 | 7.8 | 742 | 700 | 177.5 |
| B | 2 | 9 | 1992 | 10.06 | 679 | 652 | 133.2 |
| B | 5 | 128 | 1713 | 7.97 | 679 | 652 | 133.2 |
| B | 2 | 8 | 1704 | 7.9 | 679 | 652 | 133.2 |
| C | 12 | 241 | 1891 | 6.36 | 743 | 700 | 187.3 |
| C | 3 | 126 | 1891 | 6.36 | 743 | 700 | 187.3 |
| C | 9 | 209 | 1876 | 6.28 | 743 | 700 | 187.3 |
| D | 10 | 189 | 1664 | 5.97 | 667 | 609 | 176.6 |
| D | 6 | 231 | 1661 | 5.96 | 667 | 609 | 176.6 |
| D | 10 | 113 | 1653 | 5.91 | 667 | 609 | 176.6 |
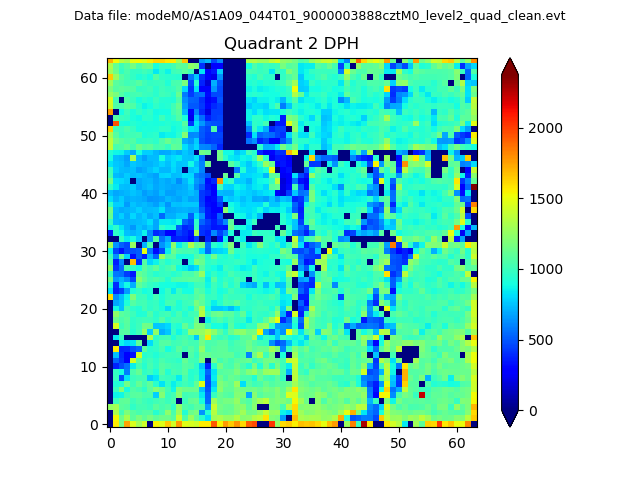
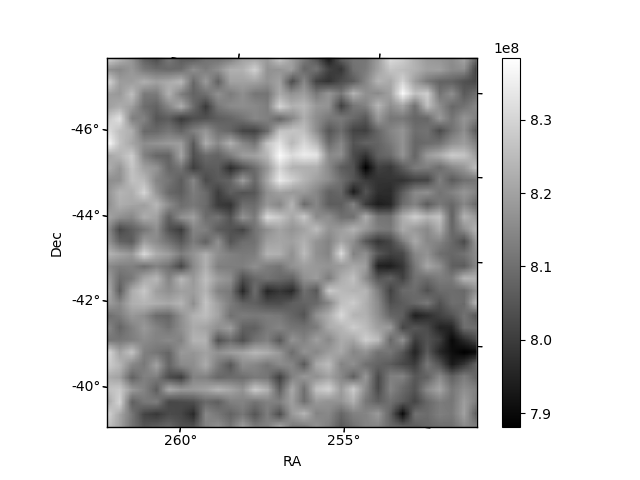
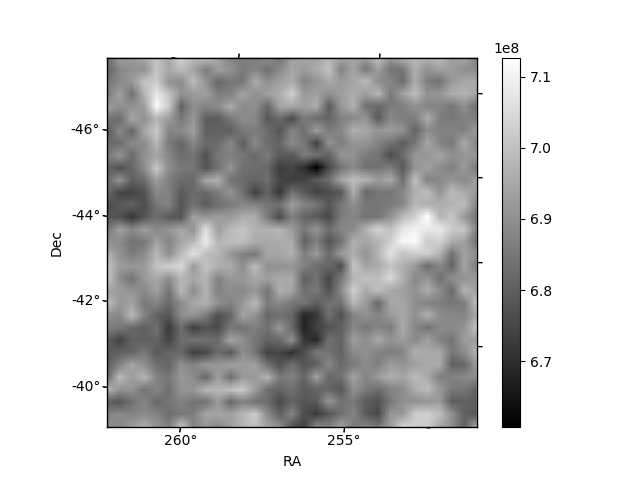
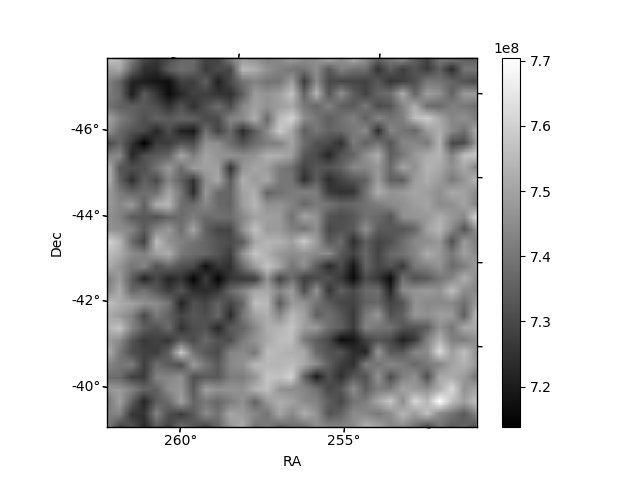
Histogram calculated using DETX and DETY for each event in the final _common_clean file
| Quadrant A | 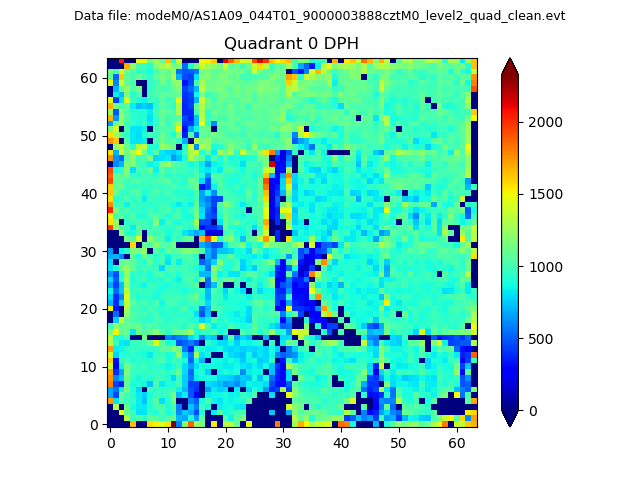 |
 |
Quadrant B |
|---|---|---|---|
| Quadrant D | 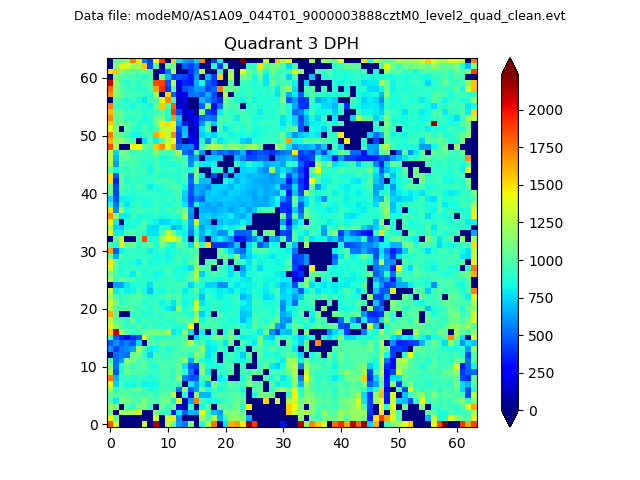 |
 |
Quadrant C |
| Plot type | Count rate plots | Images |
|---|---|---|
| Comparison with Poisson distribution Blue bars denote a histogram of data divided into 1 sec bins. Red curve is a Poisson curve with rate = median count rate of data. |
 |
 |
| Quadrant-wise count rates Data is divided into 100 sec bins |
 |
|
| Module-wise count rates for Quadrant A Data is divided into 100 sec bins |
 |
 |
| Module-wise count rates for Quadrant B Data is divided into 100 sec bins |
 |
 |
| Module-wise count rates for Quadrant C Data is divided into 100 sec bins |
 |
 |
| Module-wise count rates for Quadrant D Data is divided into 100 sec bins |
 |
 |
| Parameter | Plot |
|---|---|
| CZT HV Monitor |  |
| D_VDD |  |
| Temperature 1 |  |
| Veto HV Monitor |  |
| Veto LLD |  |
| Alpha Counter |  |
| _CPM_Rate |  |
| CZT Counter | 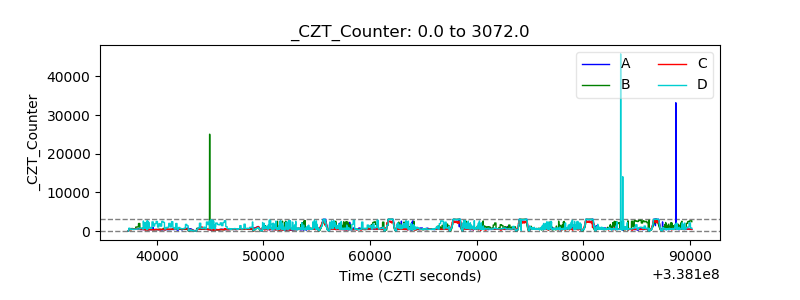 |
| +2.5 Volts monitor |  |
| +5 Volts monitor |  |
| _ROLL_ROT |  |
| _Roll_DEC | 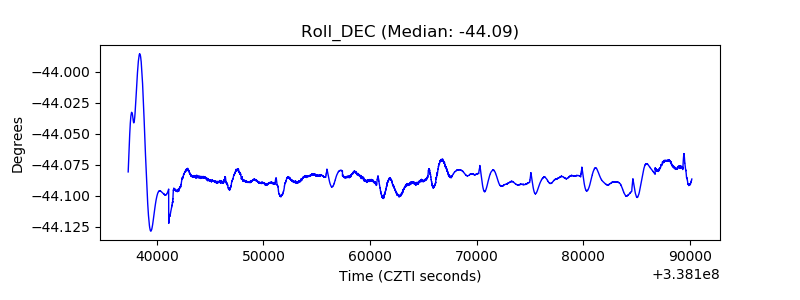 |
| _Roll_RA |  |
| Veto Counter | 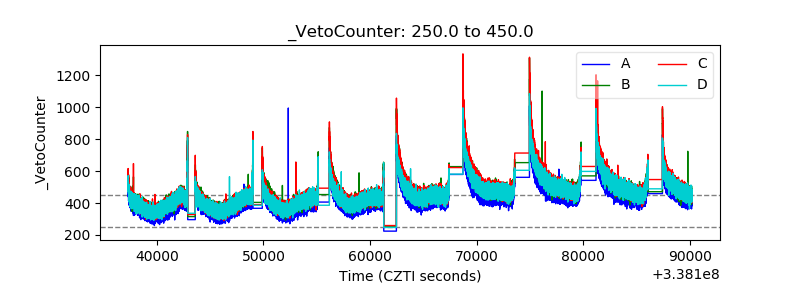 |