| Param | Original file | Final file |
|---|---|---|
| Filename | modeM0/AS1A09_044T01_9000003888_26903cztM0_level2.evt | modeM0/AS1A09_044T01_9000003888_26903cztM0_level2_quad_clean.evt |
| Size (bytes) | 1,141,853,760 | 166,610,880 |
| Size | 1.1 GB | 158.9 MB |
| Events in quadrant A | 6,228,737 | 1,078,874 |
| Events in quadrant B | 7,098,465 | 1,088,721 |
| Events in quadrant C | 5,870,114 | 1,065,460 |
| Events in quadrant D | 14,544,968 | 952,426 |
| Mode M0 | |||
|---|---|---|---|
| Quadrant | BADHDUFLAG | Total packets | Discarded packets |
| A | 0 | 26318 | 0 |
| B | 0 | 29216 | 0 |
| C | 0 | 25534 | 0 |
| D | 0 | 51892 | 0 |
| Mode M9 | |||
|---|---|---|---|
| Quadrant | BADHDUFLAG | Total packets | Discarded packets |
| A | 0 | 16 | 0 |
| B | 0 | 16 | 0 |
| C | 0 | 16 | 0 |
| D | 0 | 16 | 0 |
| Quadrant | Total seconds | Saturated seconds | Saturation percentage |
|---|---|---|---|
| A | 12444 | 77 | 0.618772% |
| B | 12444 | 233 | 1.872388% |
| C | 12444 | 135 | 1.084860% |
| D | 12444 | 1939 | 15.581806% |
Noise dominated data is calculated using 1-second bins in cleaned event files. If a bin has >2000 counts, and if more than 50% of those come from <1% of pixels, then it is considered to be noise-dominated and hence unusable.
| Quadrant | # 1 sec bins | Bins with >0 counts | Bins with >2000 counts | High rate bins dominated by noise | Noise dominated (total time) | Noise dominated (detector-on time) | Marked lightcurve |
|---|---|---|---|---|---|---|---|
| A | 14044 | 12446 | 2 | 2 | 0.01% | 0.02% | 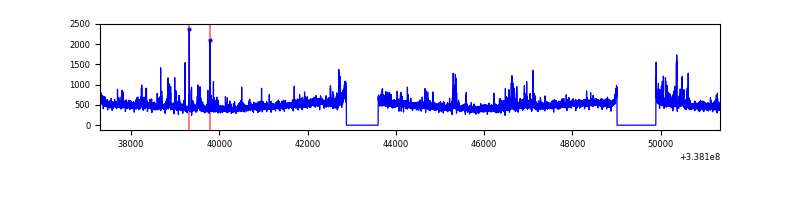 |
| B | 14044 | 12445 | 97 | 97 | 0.69% | 0.78% | 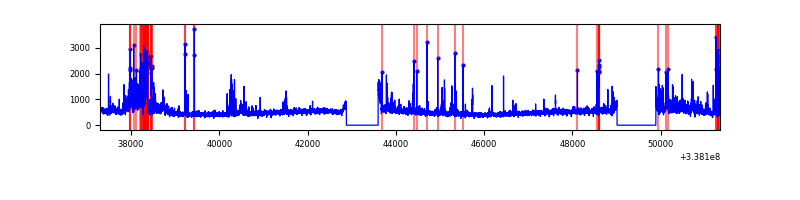 |
| C | 14044 | 12446 | 2 | 2 | 0.01% | 0.02% | 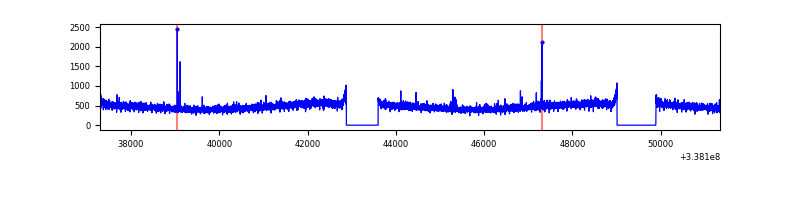 |
| D | 14044 | 12446 | 1880 | 1880 | 13.39% | 15.11% | 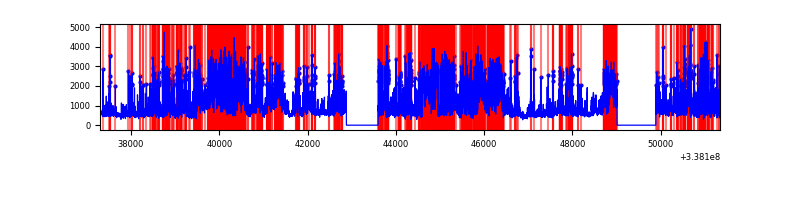 |
Top three noisy pixels from each quadrant. If the there are fewer than three noisy pixels in the level2.evt file, extra rows are filled as -1
| Pixel properties | Quadrant properties | ||||||
|---|---|---|---|---|---|---|---|
| Quadrant | DetID | PixID | Counts | Sigma | Mean | Median | Sigma |
| A | 0 | 13 | 300033 | 988.22 | 1505 | 1476 | 302.1 |
| A | 5 | 168 | 92509 | 301.32 | 1505 | 1476 | 302.1 |
| A | 12 | 189 | 22655 | 70.1 | 1505 | 1476 | 302.1 |
| B | 0 | 190 | 463603 | 1626.04 | 1495 | 1458 | 284.2 |
| B | 3 | 64 | 441411 | 1547.96 | 1495 | 1458 | 284.2 |
| B | 10 | 246 | 87578 | 303.01 | 1495 | 1458 | 284.2 |
| C | 14 | 238 | 231417 | 679.32 | 1439 | 1449 | 338.5 |
| C | 15 | 208 | 18163 | 49.37 | 1439 | 1449 | 338.5 |
| C | 13 | 61 | 10068 | 25.46 | 1439 | 1449 | 338.5 |
| D | 7 | 80 | 3755516 | 10764.34 | 1364 | 1331 | 348.8 |
| D | 1 | 52 | 3565518 | 10219.56 | 1364 | 1331 | 348.8 |
| D | 12 | 233 | 1333754 | 3820.44 | 1364 | 1331 | 348.8 |
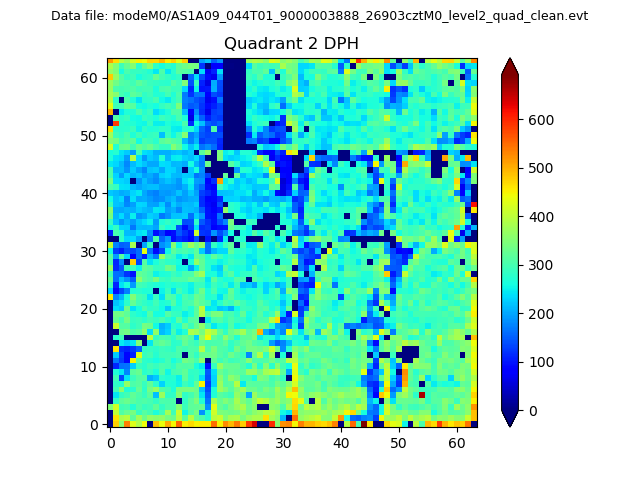
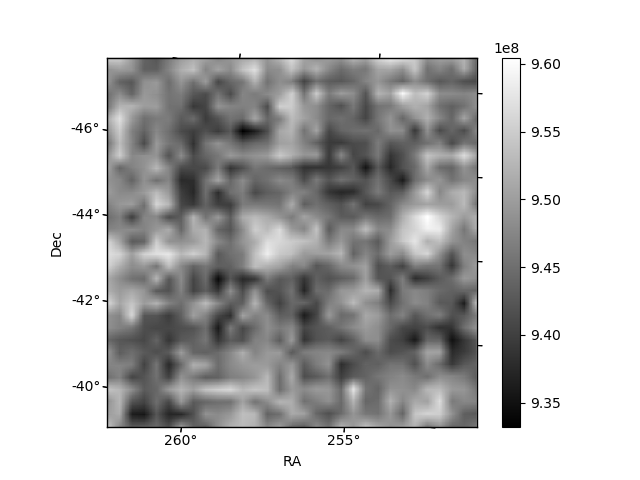
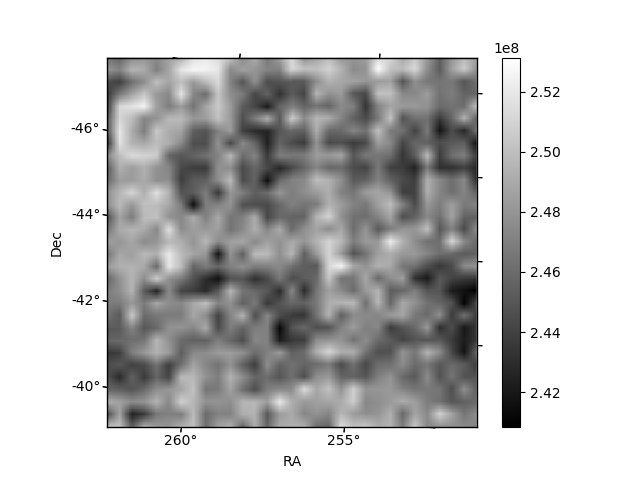
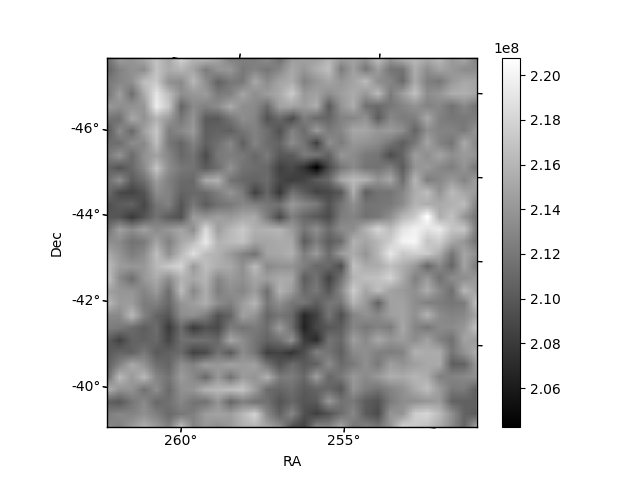
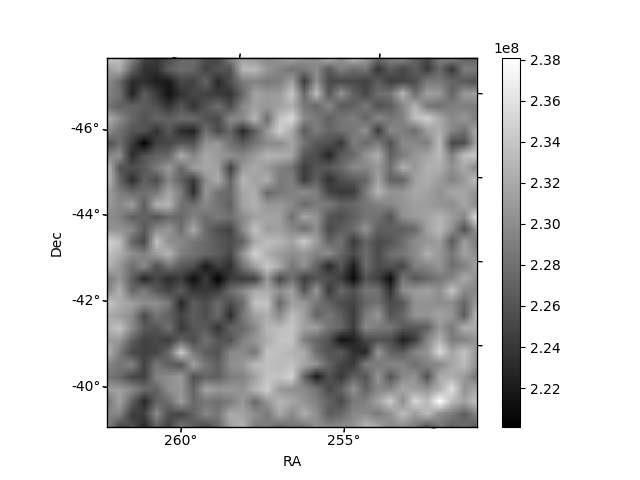
Histogram calculated using DETX and DETY for each event in the final _common_clean file
| Quadrant A | 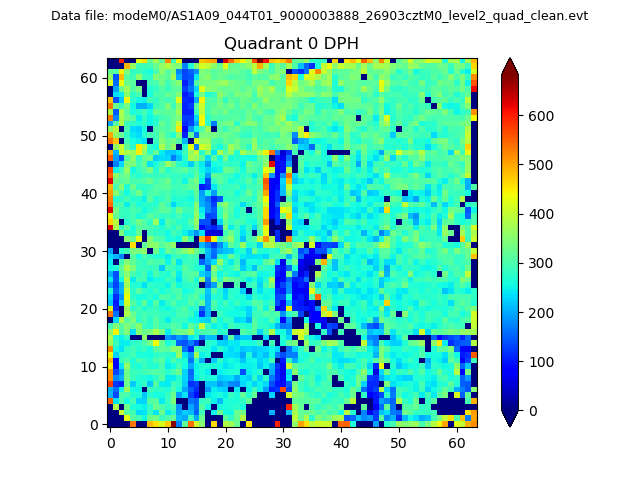 |
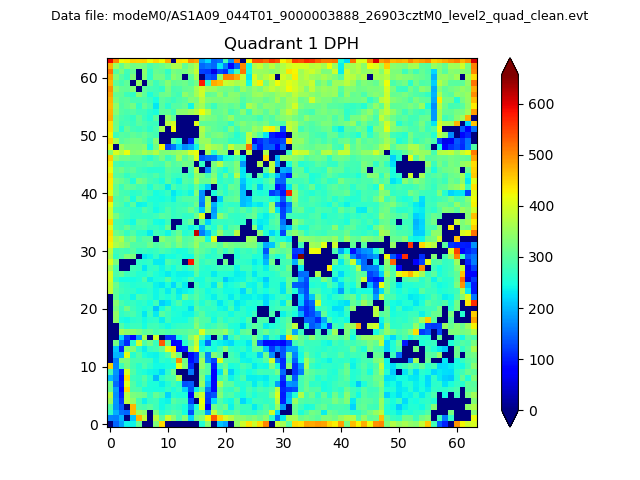 |
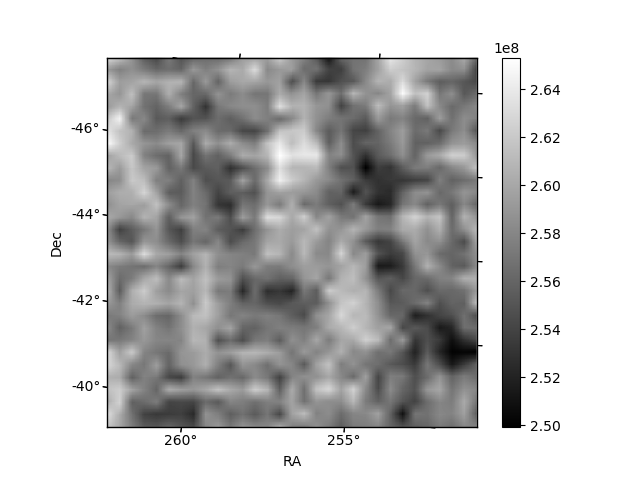
Quadrant B |
|---|---|---|---|
| Quadrant D | 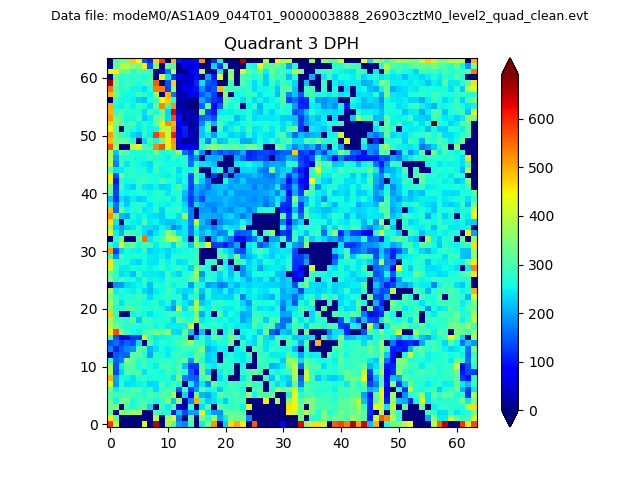 |
 |
Quadrant C |
| Plot type | Count rate plots | Images |
|---|---|---|
| Comparison with Poisson distribution Blue bars denote a histogram of data divided into 1 sec bins. Red curve is a Poisson curve with rate = median count rate of data. |
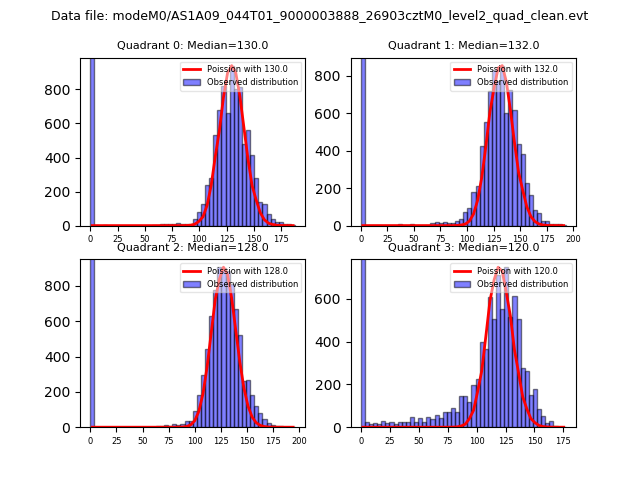 |
 |
| Quadrant-wise count rates Data is divided into 100 sec bins |
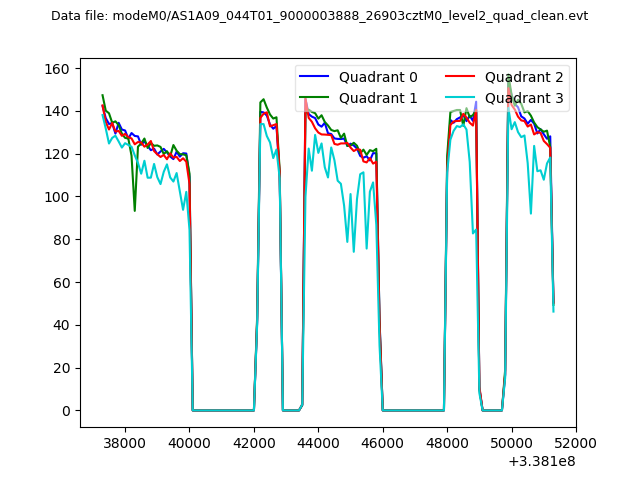 |
|
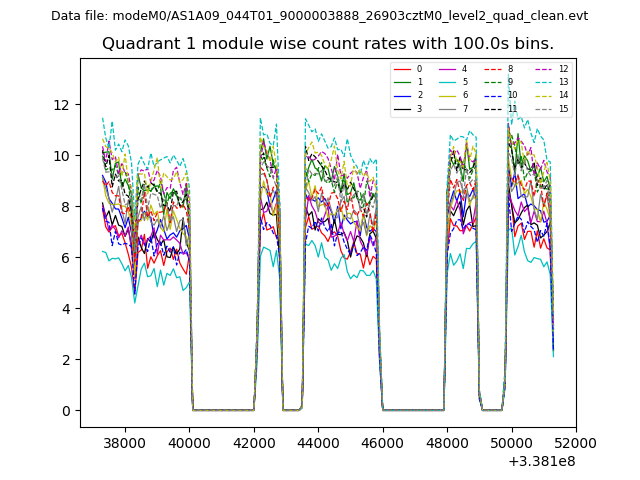
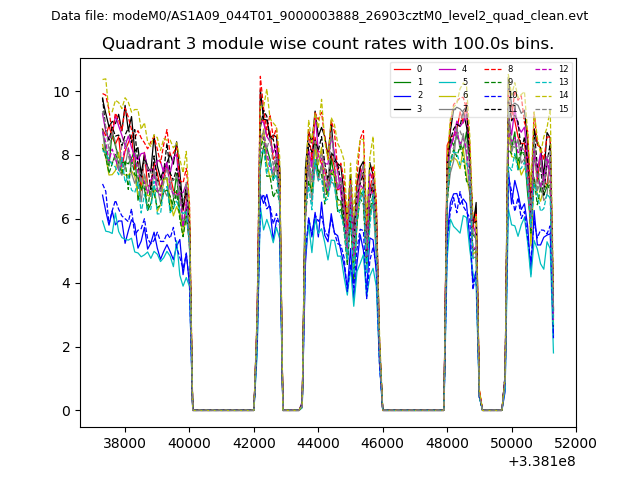
| Module-wise count rates for Quadrant A Data is divided into 100 sec bins |
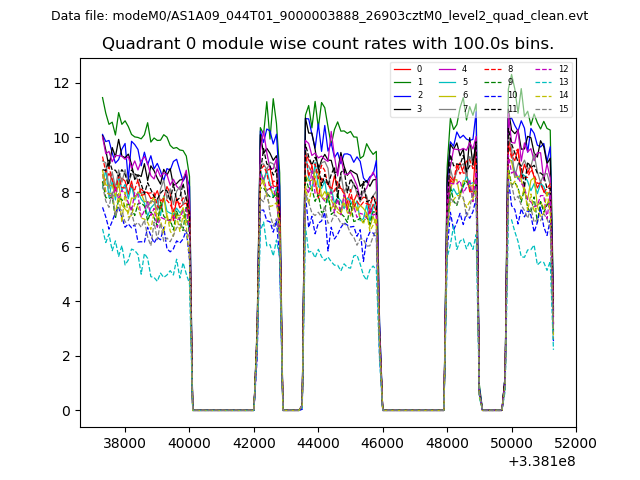 |
 |
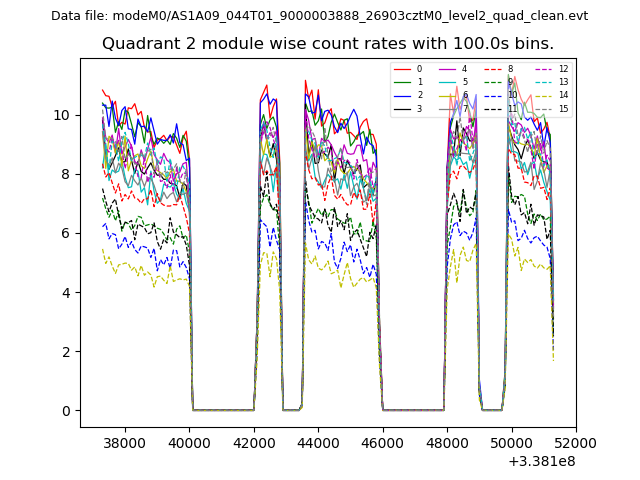
| Module-wise count rates for Quadrant B Data is divided into 100 sec bins |
 |
 |
| Module-wise count rates for Quadrant C Data is divided into 100 sec bins |
 |
 |
| Module-wise count rates for Quadrant D Data is divided into 100 sec bins |
 |
 |
| Parameter | Plot |
|---|---|
| CZT HV Monitor | 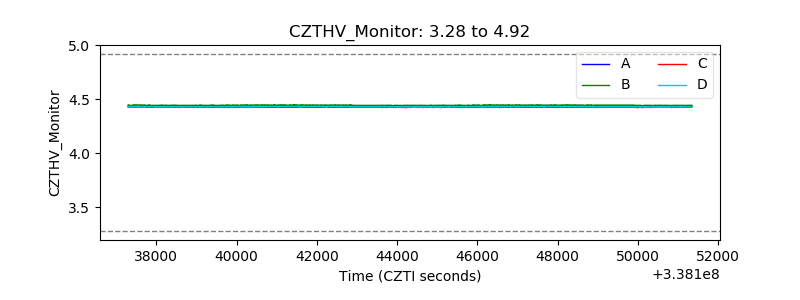 |
| D_VDD | 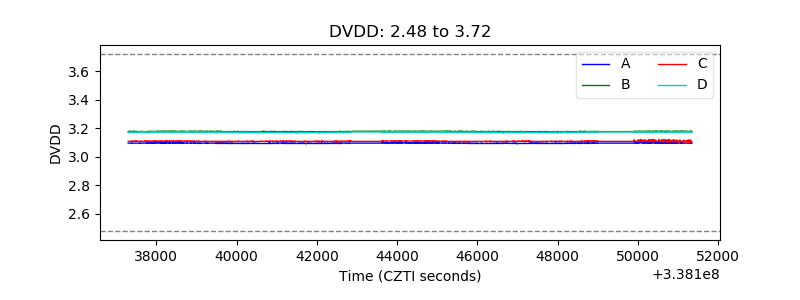 |
| Temperature 1 |  |
| Veto HV Monitor | 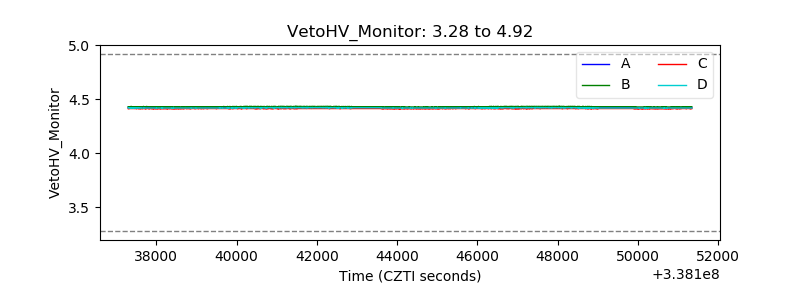 |
| Veto LLD | 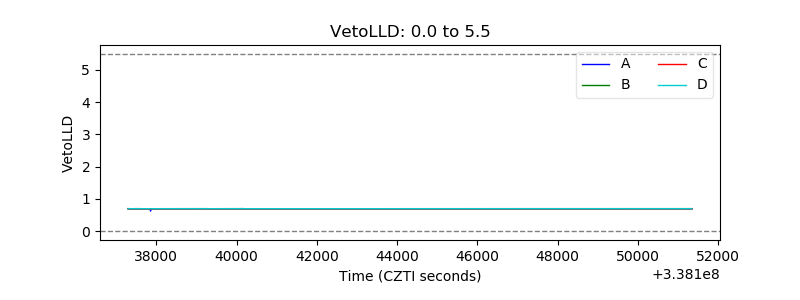 |
| Alpha Counter | 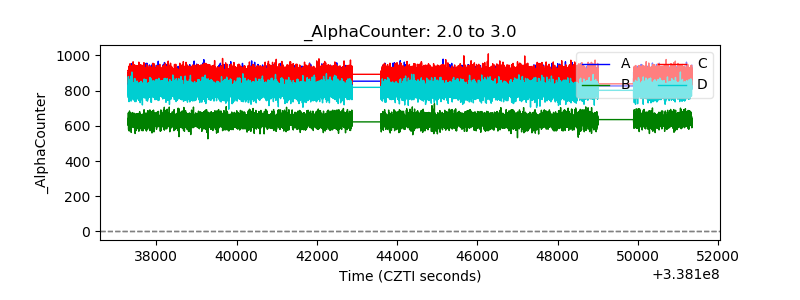 |
| _CPM_Rate | 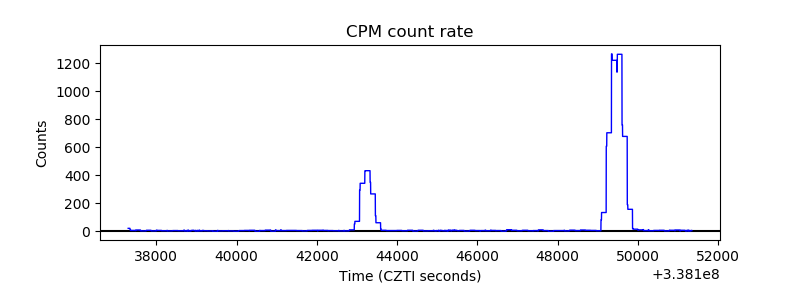 |
| CZT Counter | 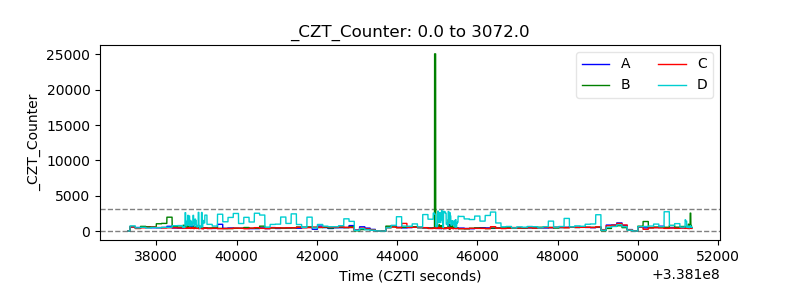 |
| +2.5 Volts monitor |  |
| +5 Volts monitor |  |
| _ROLL_ROT | 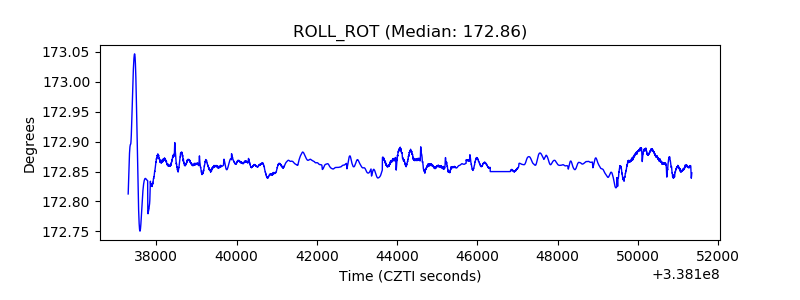 |
| _Roll_DEC | 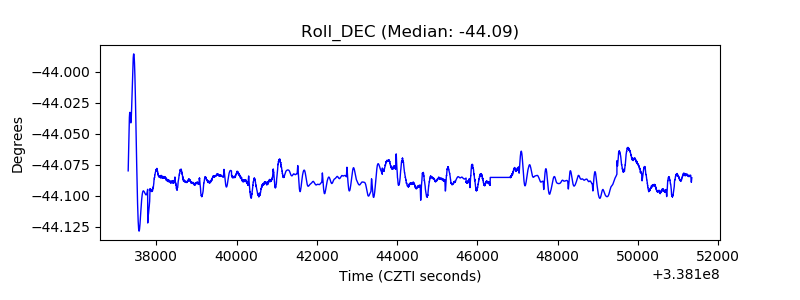 |
| _Roll_RA | 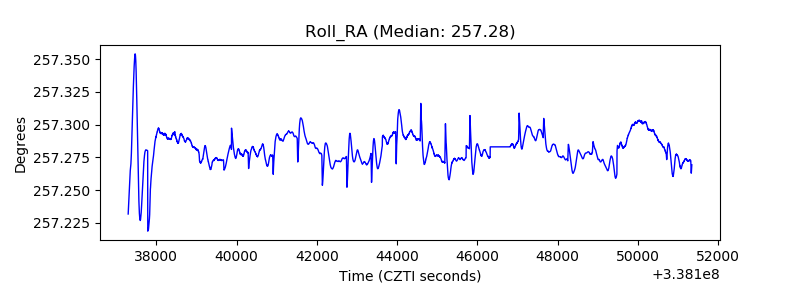 |
| Veto Counter | 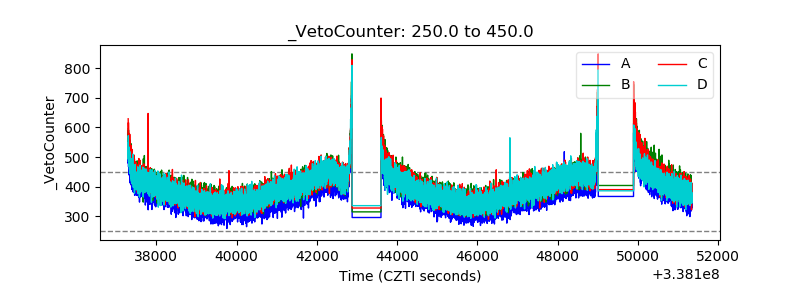 |