| Param | Original file | Final file |
|---|---|---|
| Filename | modeM0/AS1A09_044T01_9000003888_26904cztM0_level2.evt | modeM0/AS1A09_044T01_9000003888_26904cztM0_level2_quad_clean.evt |
| Size (bytes) | 595,497,600 | 93,381,120 |
| Size | 567.9 MB | 89.1 MB |
| Events in quadrant A | 3,358,697 | 611,052 |
| Events in quadrant B | 4,488,951 | 614,595 |
| Events in quadrant C | 3,140,802 | 603,012 |
| Events in quadrant D | 6,606,516 | 546,034 |
| Mode M0 | |||
|---|---|---|---|
| Quadrant | BADHDUFLAG | Total packets | Discarded packets |
| A | 0 | 14022 | 0 |
| B | 0 | 17647 | 0 |
| C | 0 | 13376 | 0 |
| D | 0 | 24126 | 0 |
| Mode M9 | |||
|---|---|---|---|
| Quadrant | BADHDUFLAG | Total packets | Discarded packets |
| A | 0 | 14 | 0 |
| B | 0 | 15 | 0 |
| C | 0 | 15 | 0 |
| D | 0 | 15 | 0 |
| Quadrant | Total seconds | Saturated seconds | Saturation percentage |
|---|---|---|---|
| A | 6501 | 38 | 0.584525% |
| B | 6501 | 427 | 6.568220% |
| C | 6501 | 53 | 0.815259% |
| D | 6501 | 734 | 11.290571% |
Noise dominated data is calculated using 1-second bins in cleaned event files. If a bin has >2000 counts, and if more than 50% of those come from <1% of pixels, then it is considered to be noise-dominated and hence unusable.
| Quadrant | # 1 sec bins | Bins with >0 counts | Bins with >2000 counts | High rate bins dominated by noise | Noise dominated (total time) | Noise dominated (detector-on time) | Marked lightcurve |
|---|---|---|---|---|---|---|---|
| A | 7546 | 6502 | 15 | 15 | 0.20% | 0.23% | 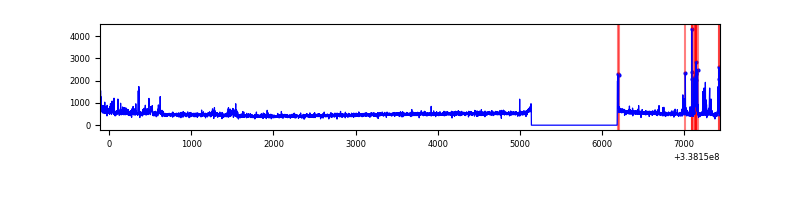 |
| B | 7546 | 6501 | 283 | 283 | 3.75% | 4.35% | 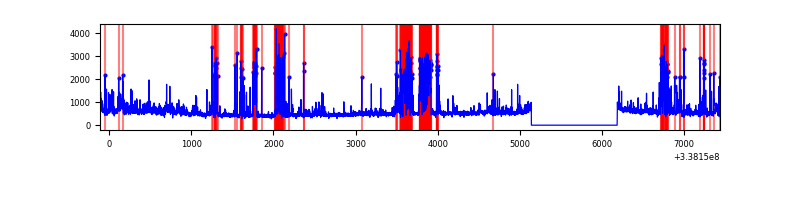 |
| C | 7546 | 6502 | 0 | 0 | 0.00% | 0.00% | 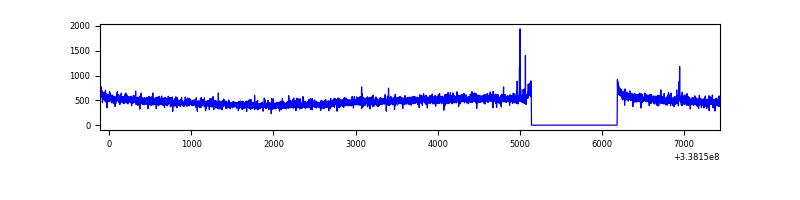 |
| D | 7546 | 6502 | 687 | 687 | 9.10% | 10.57% | 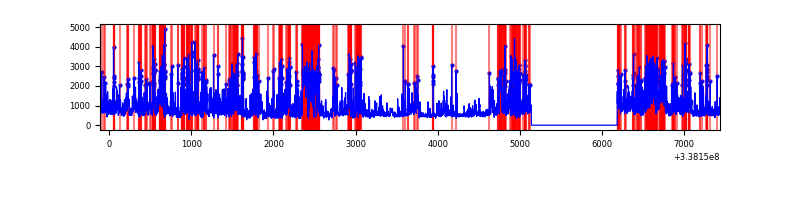 |
Top three noisy pixels from each quadrant. If the there are fewer than three noisy pixels in the level2.evt file, extra rows are filled as -1
| Pixel properties | Quadrant properties | ||||||
|---|---|---|---|---|---|---|---|
| Quadrant | DetID | PixID | Counts | Sigma | Mean | Median | Sigma |
| A | 0 | 13 | 200835 | 1242.3 | 800 | 785 | 161.0 |
| A | 5 | 168 | 50673 | 309.8 | 800 | 785 | 161.0 |
| A | 12 | 189 | 21861 | 130.88 | 800 | 785 | 161.0 |
| B | 3 | 64 | 946888 | 6405.44 | 780 | 761 | 147.7 |
| B | 10 | 246 | 222155 | 1498.87 | 780 | 761 | 147.7 |
| B | 0 | 190 | 194007 | 1308.31 | 780 | 761 | 147.7 |
| C | 14 | 238 | 120413 | 664.31 | 766 | 774 | 180.1 |
| C | 8 | 128 | 10181 | 52.23 | 766 | 774 | 180.1 |
| C | 15 | 208 | 9211 | 46.85 | 766 | 774 | 180.1 |
| D | 1 | 52 | 1914445 | 10597.36 | 725 | 709 | 180.6 |
| D | 7 | 80 | 722918 | 3999.25 | 725 | 709 | 180.6 |
| D | 11 | 176 | 475416 | 2628.7 | 725 | 709 | 180.6 |
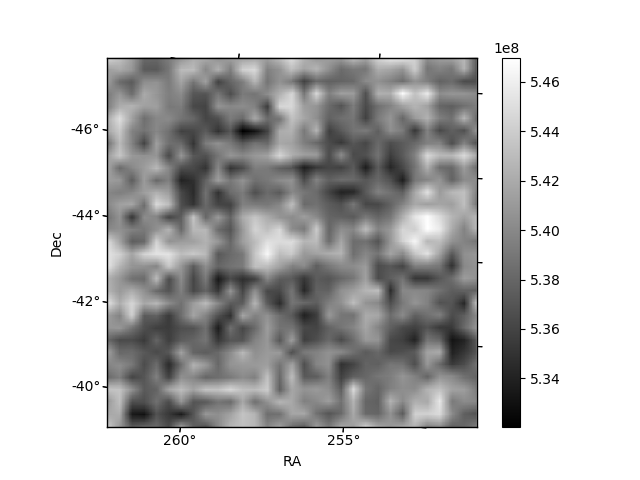
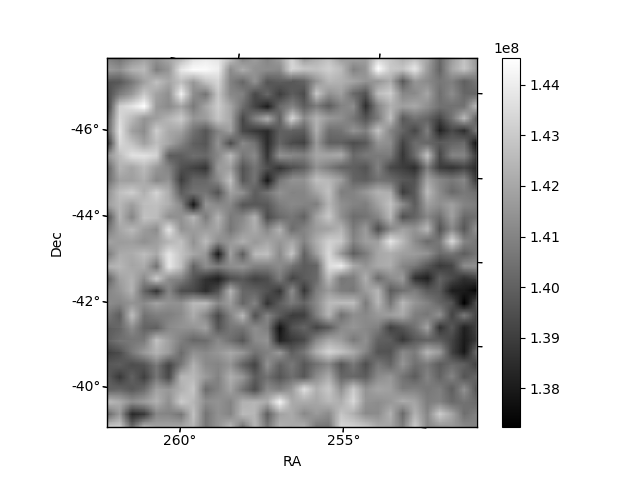
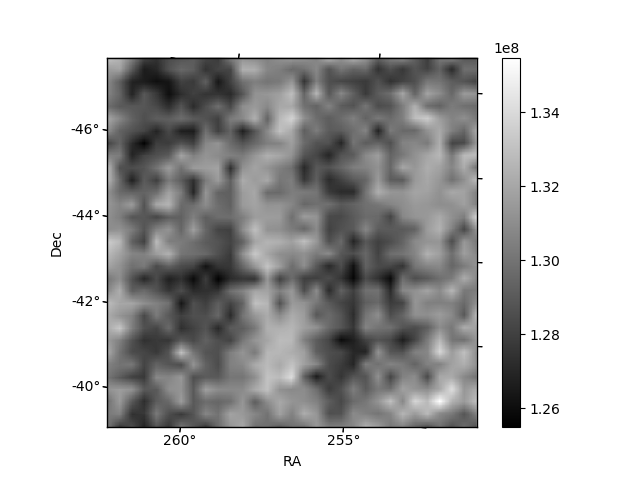
Histogram calculated using DETX and DETY for each event in the final _common_clean file
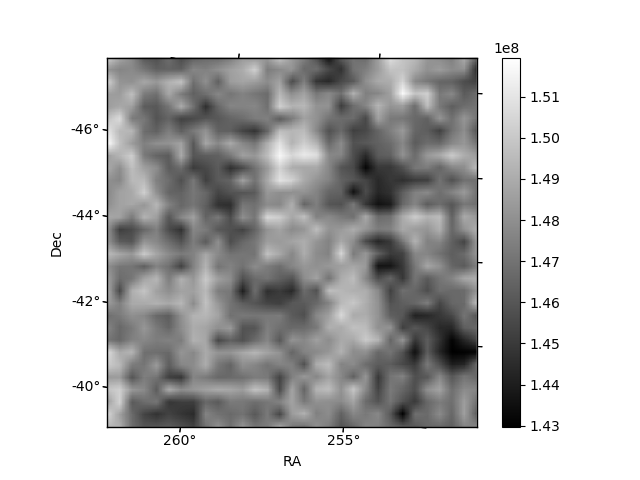
| Quadrant A | 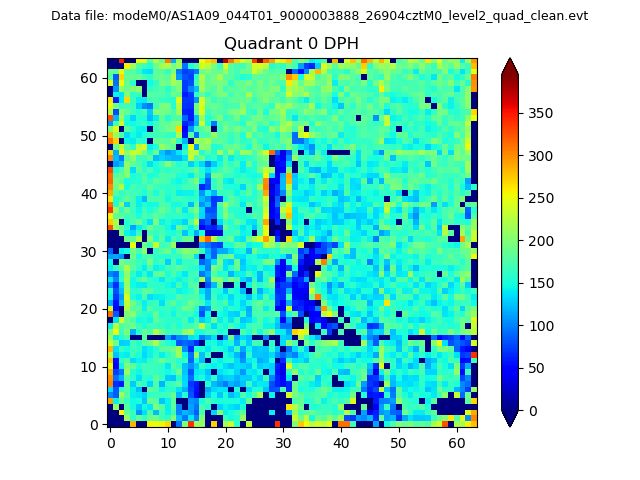 |
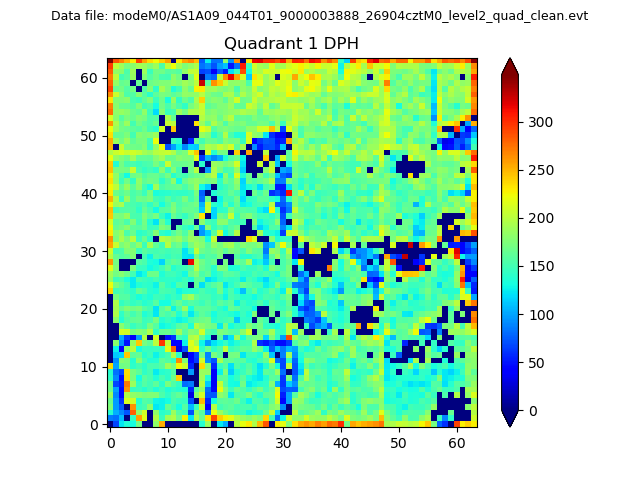 |
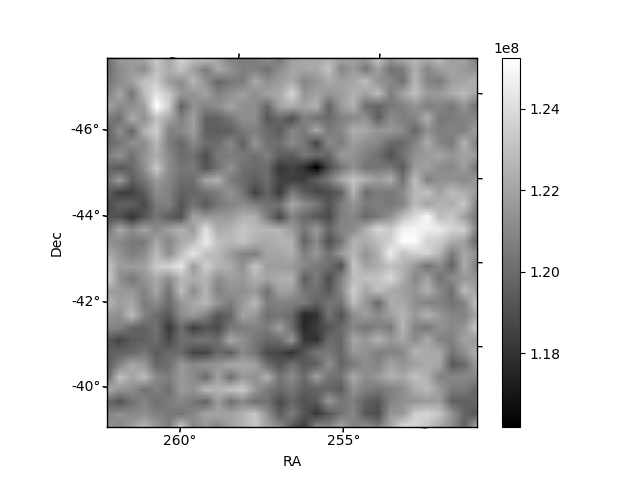
Quadrant B |
|---|---|---|---|
| Quadrant D | 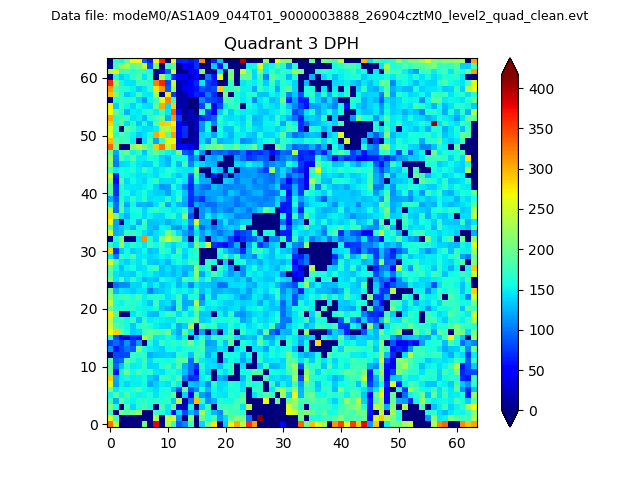 |
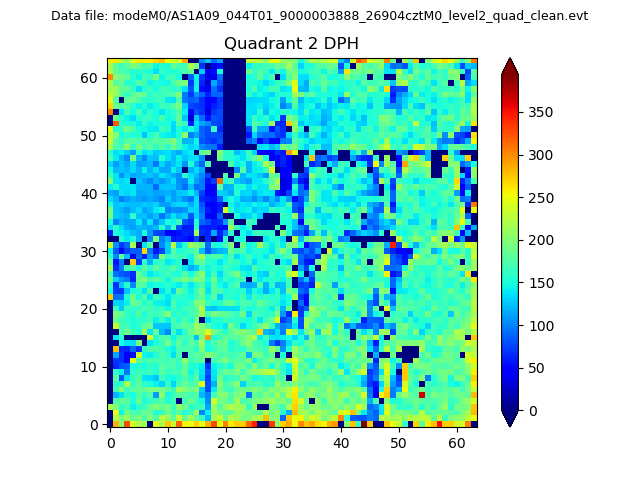 |
Quadrant C |
| Plot type | Count rate plots | Images |
|---|---|---|
| Comparison with Poisson distribution Blue bars denote a histogram of data divided into 1 sec bins. Red curve is a Poisson curve with rate = median count rate of data. |
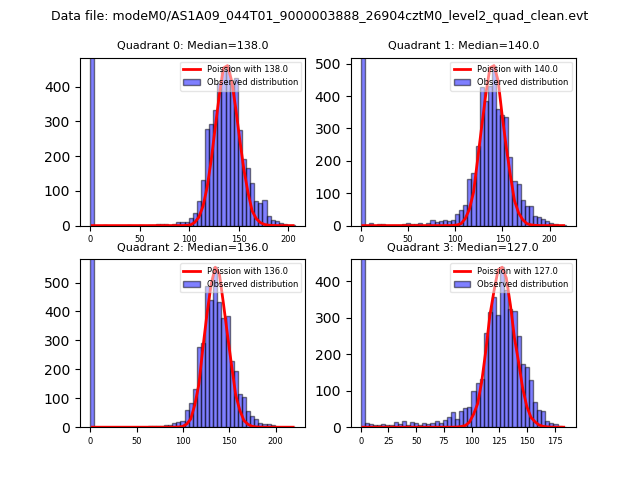 |
 |
| Quadrant-wise count rates Data is divided into 100 sec bins |
 |
|
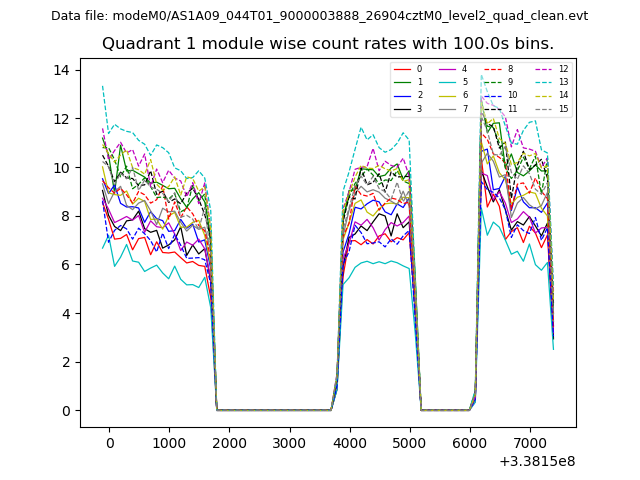
| Module-wise count rates for Quadrant A Data is divided into 100 sec bins |
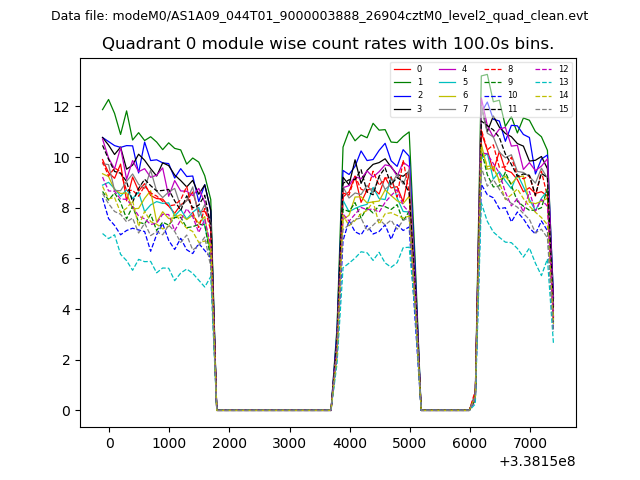 |
 |
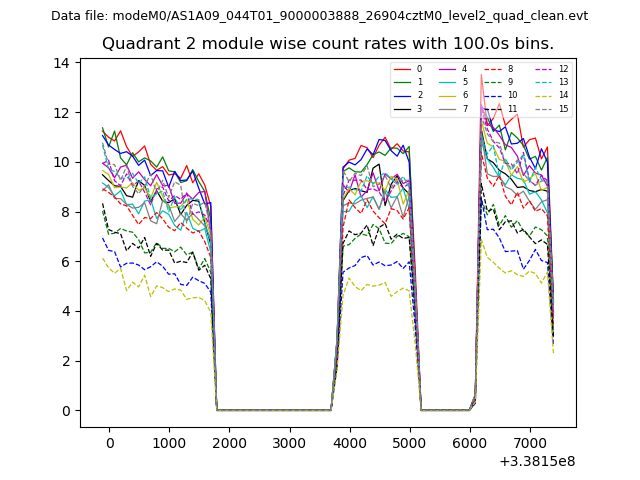
| Module-wise count rates for Quadrant B Data is divided into 100 sec bins |
 |
 |
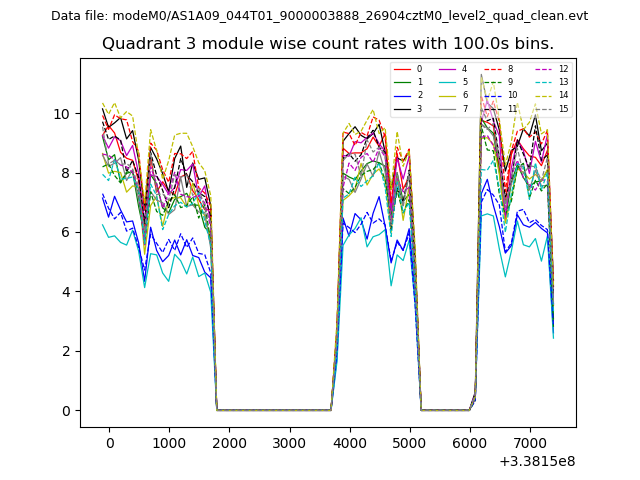
| Module-wise count rates for Quadrant C Data is divided into 100 sec bins |
 |
 |
| Module-wise count rates for Quadrant D Data is divided into 100 sec bins |
 |
 |
| Parameter | Plot |
|---|---|
| CZT HV Monitor | 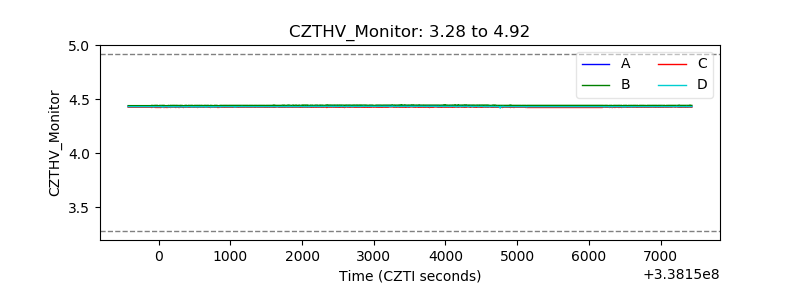 |
| D_VDD | 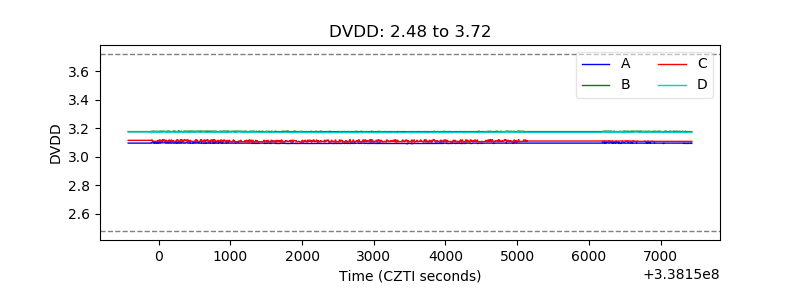 |
| Temperature 1 | 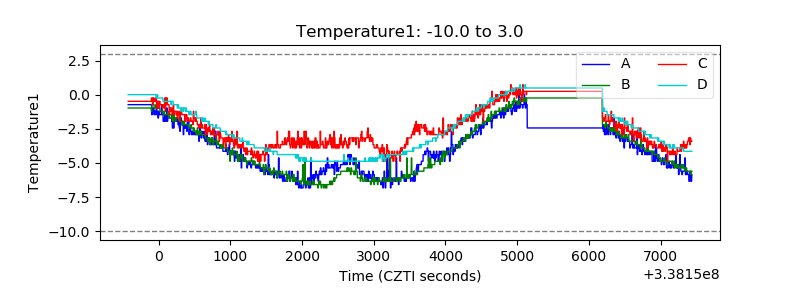 |
| Veto HV Monitor | 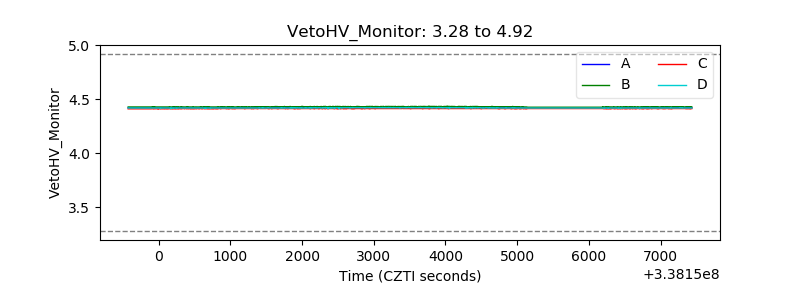 |
| Veto LLD | 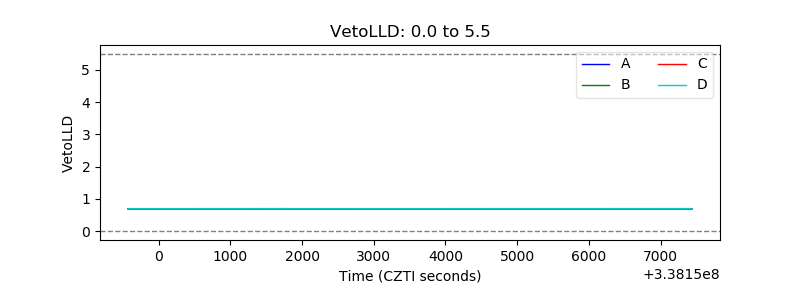 |
| Alpha Counter | 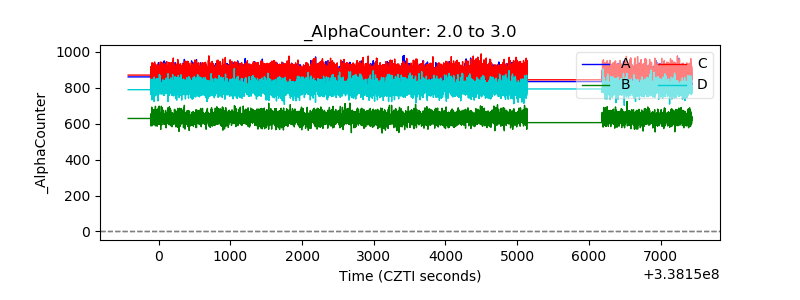 |
| _CPM_Rate | 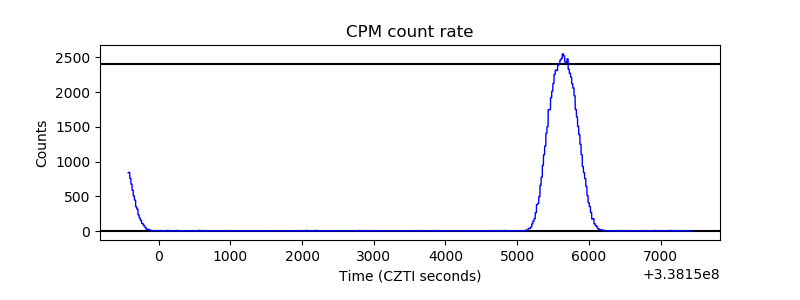 |
| CZT Counter |  |
| +2.5 Volts monitor |  |
| +5 Volts monitor |  |
| _ROLL_ROT | 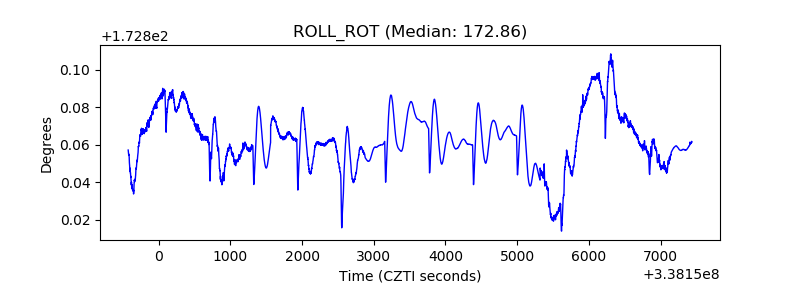 |
| _Roll_DEC | 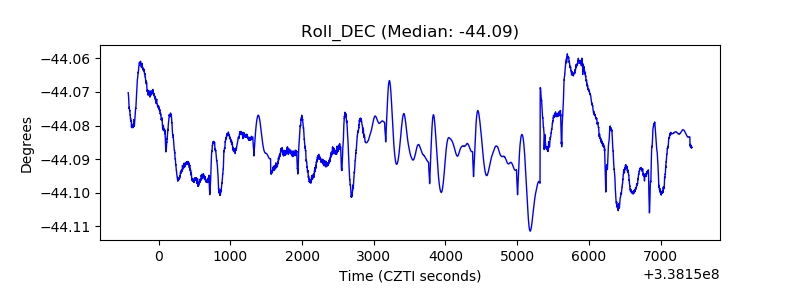 |
| _Roll_RA | 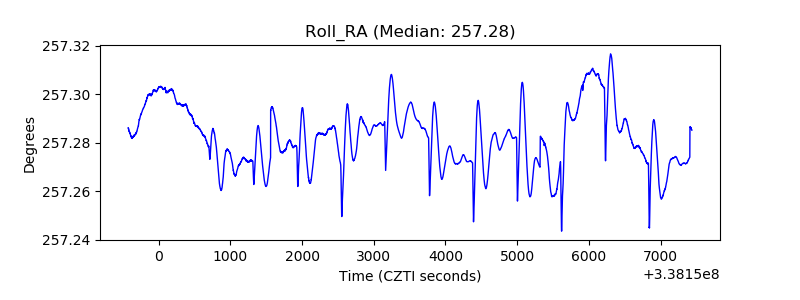 |
| Veto Counter | 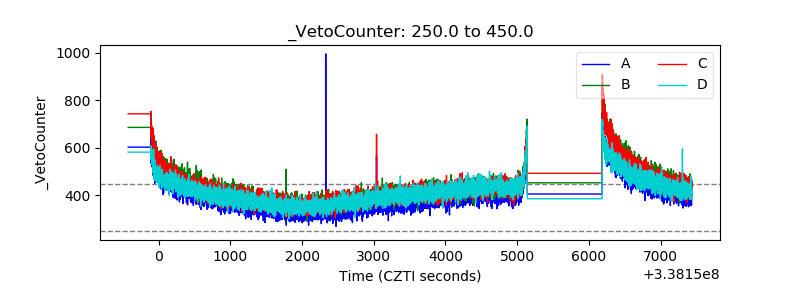 |