| Param | Original file | Final file |
|---|---|---|
| Filename | modeM0/AS1A09_044T01_9000003888_26906cztM0_level2.evt | modeM0/AS1A09_044T01_9000003888_26906cztM0_level2_quad_clean.evt |
| Size (bytes) | 646,237,440 | 89,631,360 |
| Size | 616.3 MB | 85.5 MB |
| Events in quadrant A | 3,806,229 | 593,078 |
| Events in quadrant B | 5,853,691 | 565,228 |
| Events in quadrant C | 3,143,894 | 590,317 |
| Events in quadrant D | 6,342,286 | 526,003 |
| Mode M0 | |||
|---|---|---|---|
| Quadrant | BADHDUFLAG | Total packets | Discarded packets |
| A | 0 | 15290 | 0 |
| B | 0 | 21555 | 0 |
| C | 0 | 13149 | 0 |
| D | 0 | 23224 | 0 |
| Mode M9 | |||
|---|---|---|---|
| Quadrant | BADHDUFLAG | Total packets | Discarded packets |
| A | 0 | 18 | 0 |
| B | 0 | 19 | 0 |
| C | 0 | 19 | 0 |
| D | 0 | 19 | 0 |
| Quadrant | Total seconds | Saturated seconds | Saturation percentage |
|---|---|---|---|
| A | 6290 | 106 | 1.685215% |
| B | 6290 | 877 | 13.942766% |
| C | 6290 | 48 | 0.763116% |
| D | 6290 | 653 | 10.381558% |
Noise dominated data is calculated using 1-second bins in cleaned event files. If a bin has >2000 counts, and if more than 50% of those come from <1% of pixels, then it is considered to be noise-dominated and hence unusable.
| Quadrant | # 1 sec bins | Bins with >0 counts | Bins with >2000 counts | High rate bins dominated by noise | Noise dominated (total time) | Noise dominated (detector-on time) | Marked lightcurve |
|---|---|---|---|---|---|---|---|
| A | 7485 | 6291 | 96 | 96 | 1.28% | 1.53% | 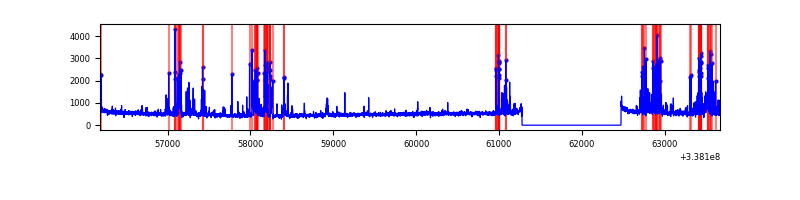 |
| B | 7485 | 6290 | 675 | 675 | 9.02% | 10.73% | 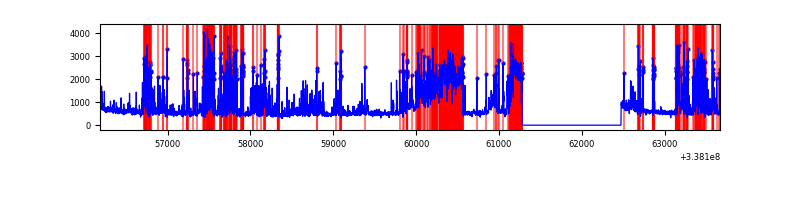 |
| C | 7485 | 6291 | 2 | 2 | 0.03% | 0.03% | 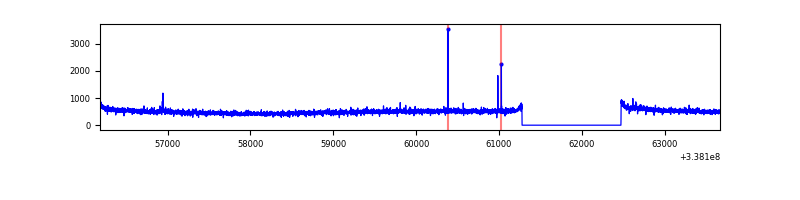 |
| D | 7485 | 6291 | 562 | 562 | 7.51% | 8.93% | 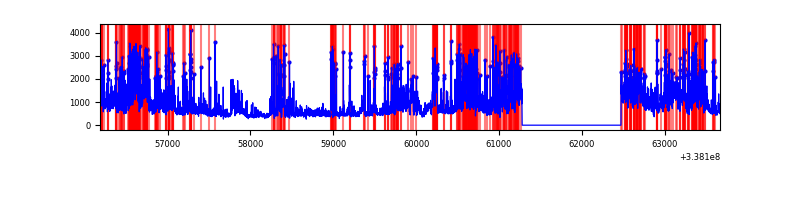 |
Top three noisy pixels from each quadrant. If the there are fewer than three noisy pixels in the level2.evt file, extra rows are filled as -1
| Pixel properties | Quadrant properties | ||||||
|---|---|---|---|---|---|---|---|
| Quadrant | DetID | PixID | Counts | Sigma | Mean | Median | Sigma |
| A | 0 | 13 | 731539 | 4607.55 | 794 | 781 | 158.6 |
| A | 13 | 254 | 10602 | 61.92 | 794 | 781 | 158.6 |
| A | 5 | 168 | 8903 | 51.21 | 794 | 781 | 158.6 |
| B | 3 | 64 | 2104596 | 14898.13 | 762 | 746 | 141.2 |
| B | 10 | 245 | 404307 | 2857.76 | 762 | 746 | 141.2 |
| B | 0 | 189 | 186080 | 1312.42 | 762 | 746 | 141.2 |
| C | 14 | 238 | 125143 | 689.52 | 770 | 775 | 180.4 |
| C | 15 | 208 | 19427 | 103.41 | 770 | 775 | 180.4 |
| C | 13 | 61 | 5292 | 25.04 | 770 | 775 | 180.4 |
| D | 1 | 52 | 2179597 | 12214.81 | 734 | 717 | 178.4 |
| D | 7 | 80 | 426529 | 2387.1 | 734 | 717 | 178.4 |
| D | 2 | 250 | 374449 | 2095.14 | 734 | 717 | 178.4 |
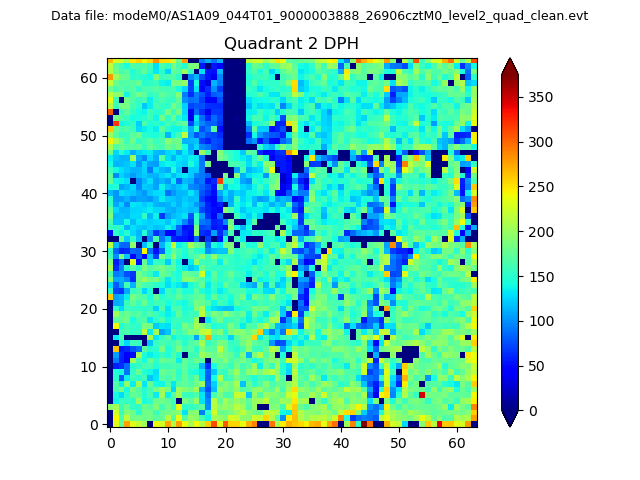
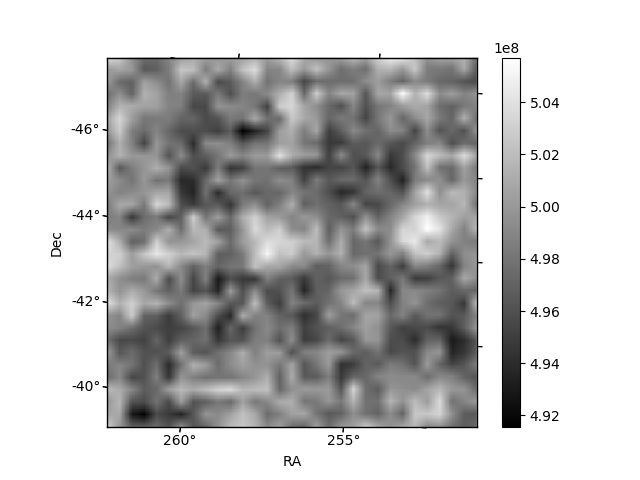
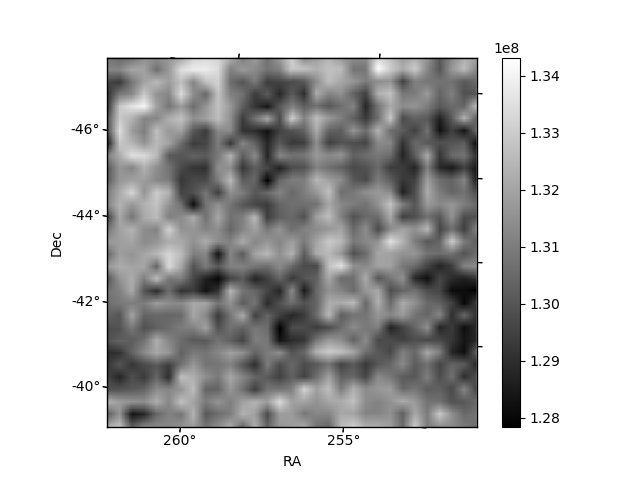
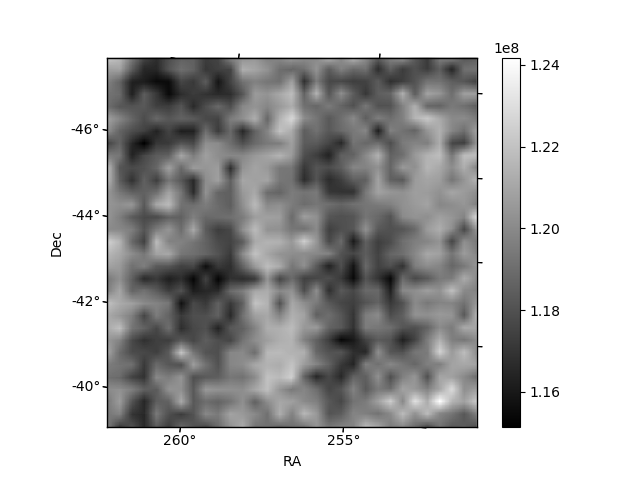
Histogram calculated using DETX and DETY for each event in the final _common_clean file
| Quadrant A | 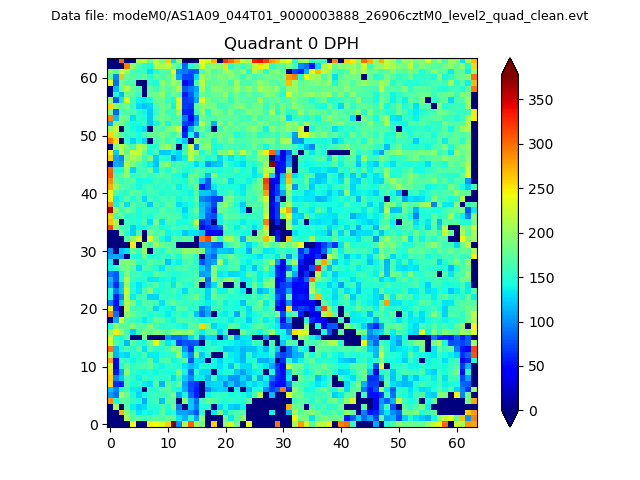 |
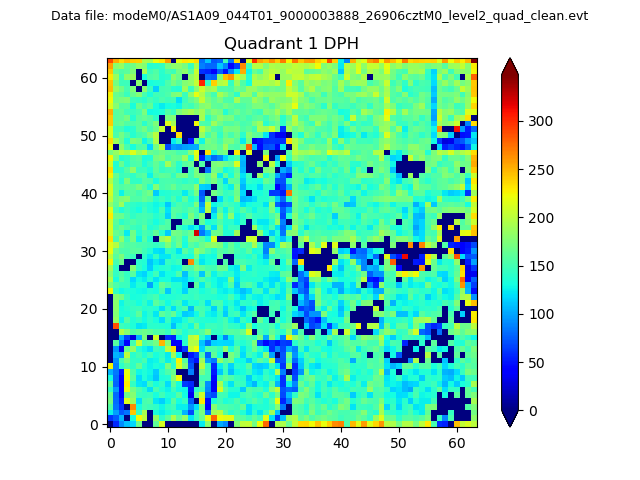 |
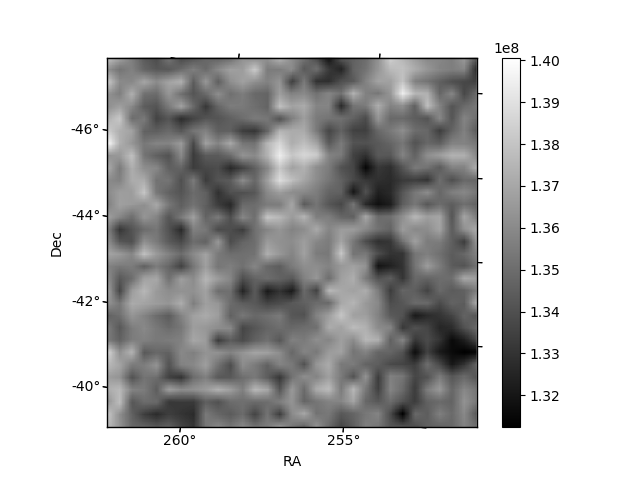
Quadrant B |
|---|---|---|---|
| Quadrant D | 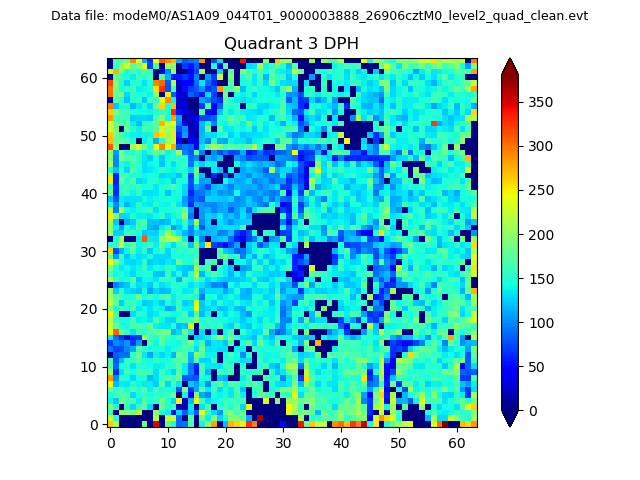 |
 |
Quadrant C |
| Plot type | Count rate plots | Images |
|---|---|---|
| Comparison with Poisson distribution Blue bars denote a histogram of data divided into 1 sec bins. Red curve is a Poisson curve with rate = median count rate of data. |
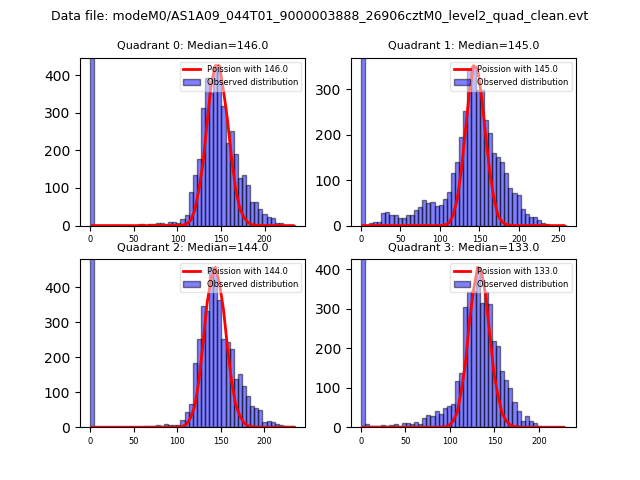 |
 |
| Quadrant-wise count rates Data is divided into 100 sec bins |
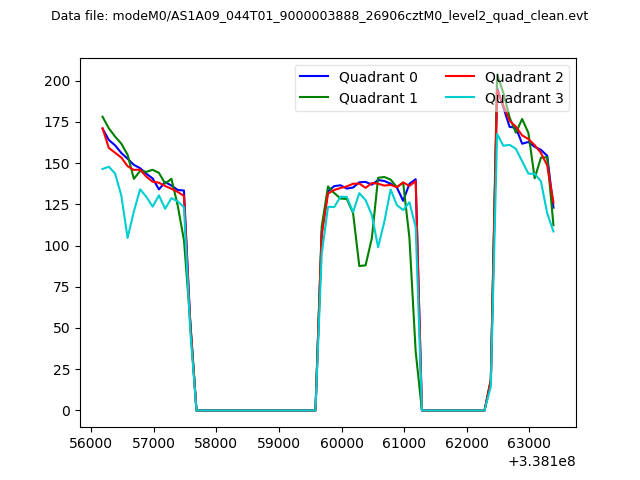 |
|
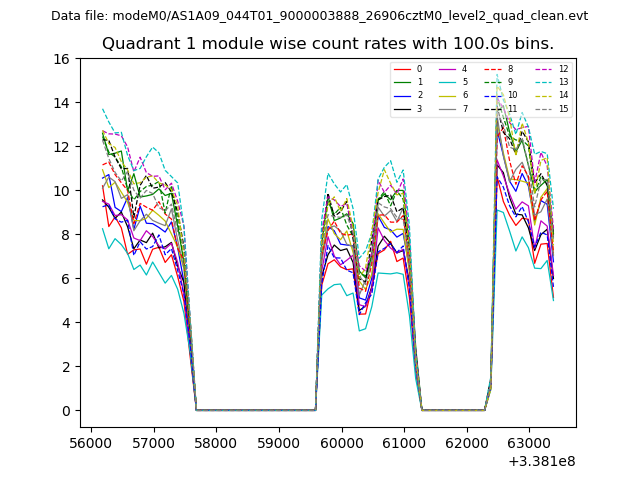
| Module-wise count rates for Quadrant A Data is divided into 100 sec bins |
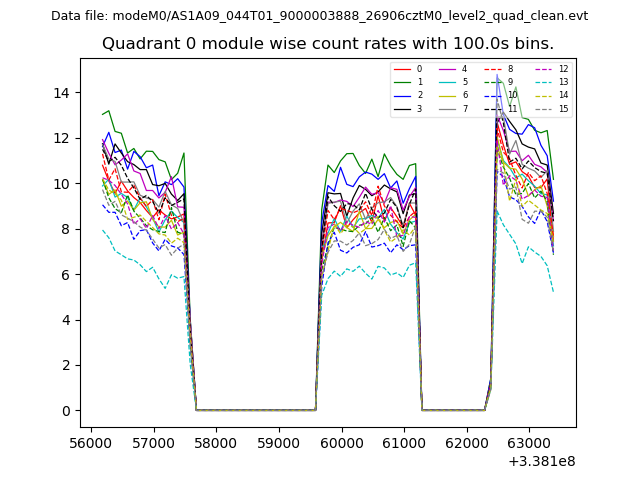 |
 |
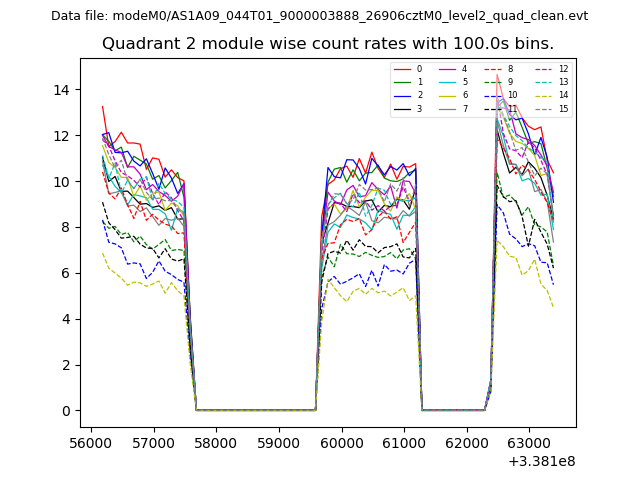
| Module-wise count rates for Quadrant B Data is divided into 100 sec bins |
 |
 |
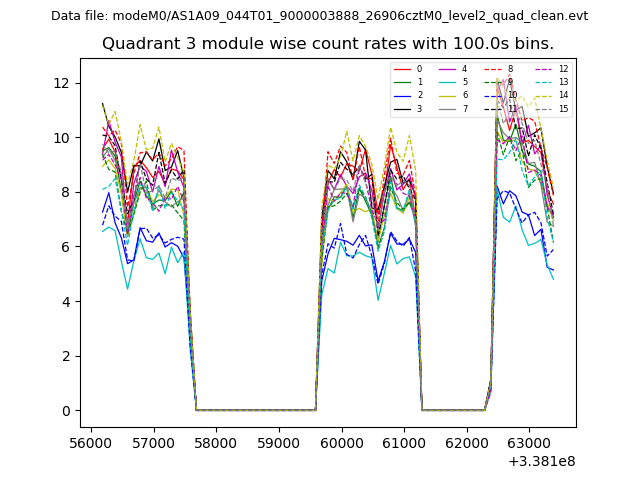
| Module-wise count rates for Quadrant C Data is divided into 100 sec bins |
 |
 |
| Module-wise count rates for Quadrant D Data is divided into 100 sec bins |
 |
 |
| Parameter | Plot |
|---|---|
| CZT HV Monitor | 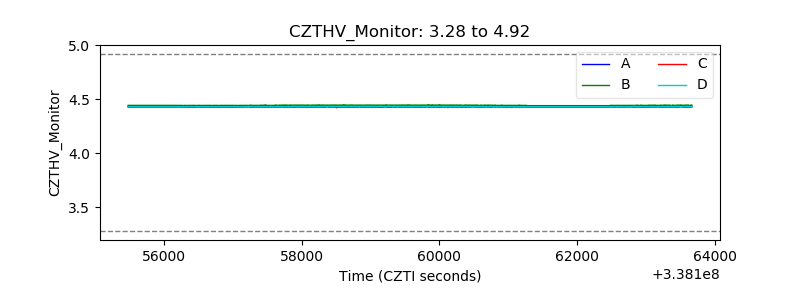 |
| D_VDD | 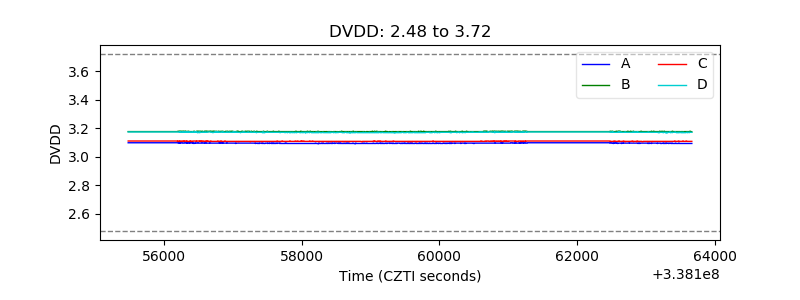 |
| Temperature 1 | 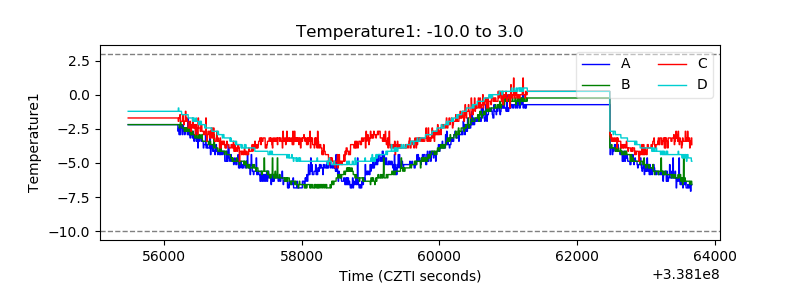 |
| Veto HV Monitor | 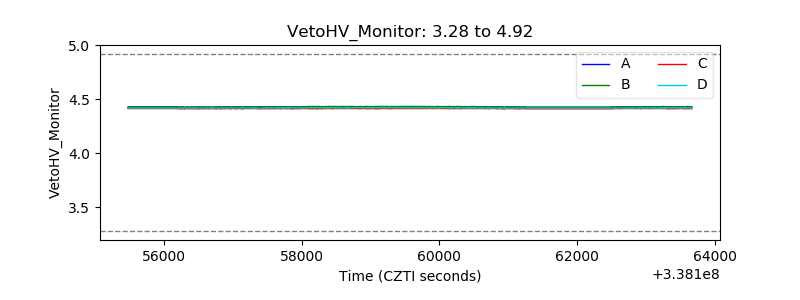 |
| Veto LLD | 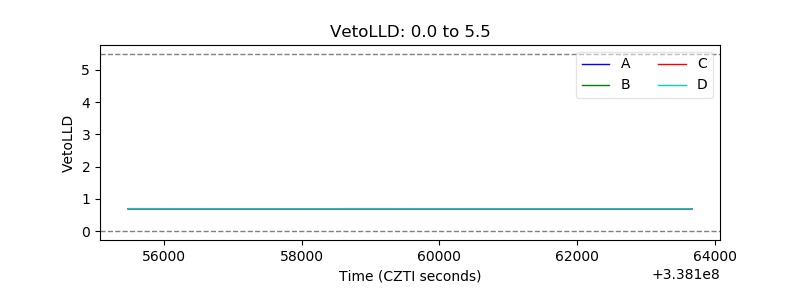 |
| Alpha Counter | 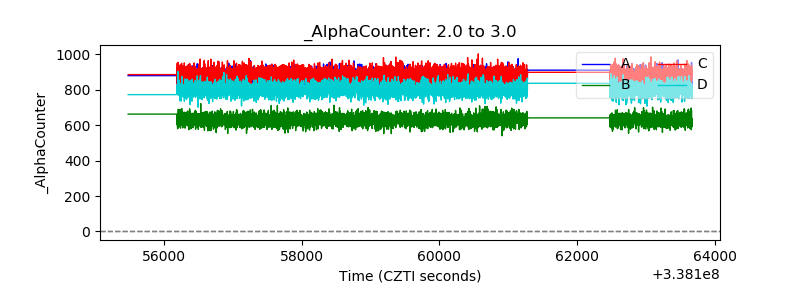 |
| _CPM_Rate | 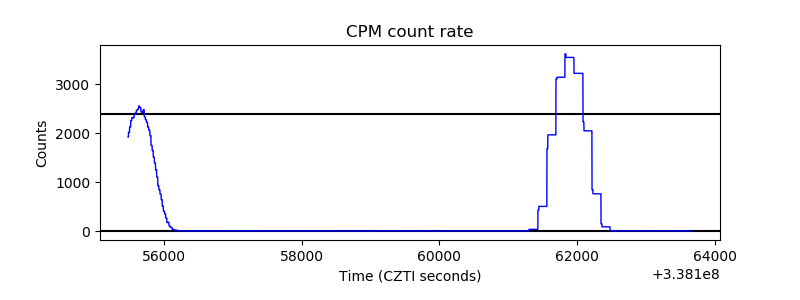 |
| CZT Counter | 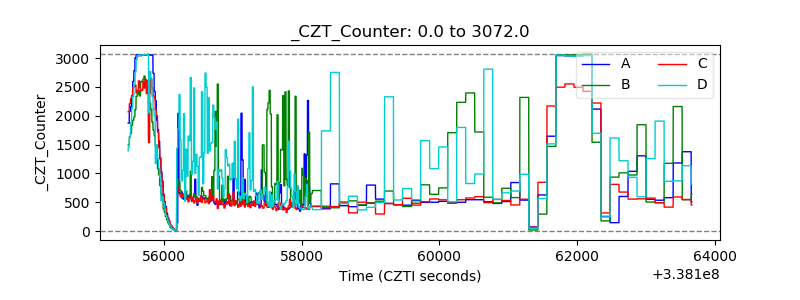 |
| +2.5 Volts monitor |  |
| +5 Volts monitor | 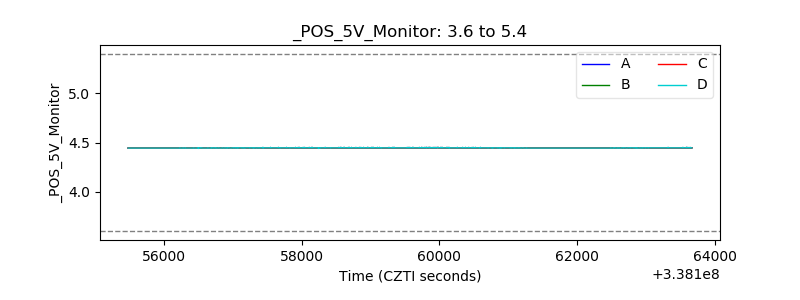 |
| _ROLL_ROT | 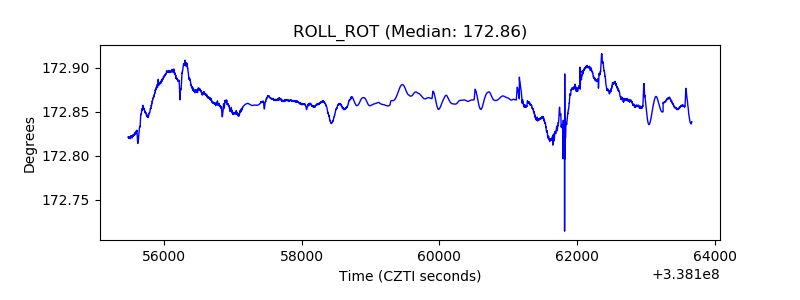 |
| _Roll_DEC | 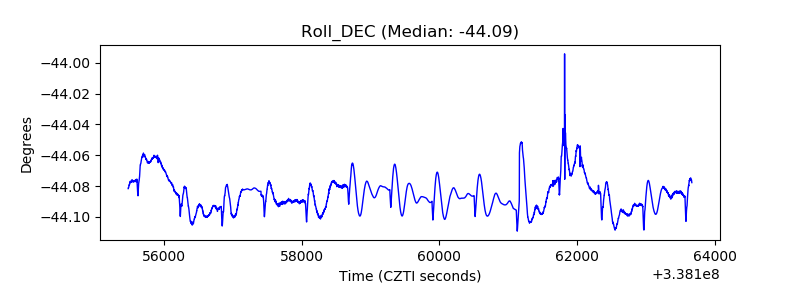 |
| _Roll_RA | 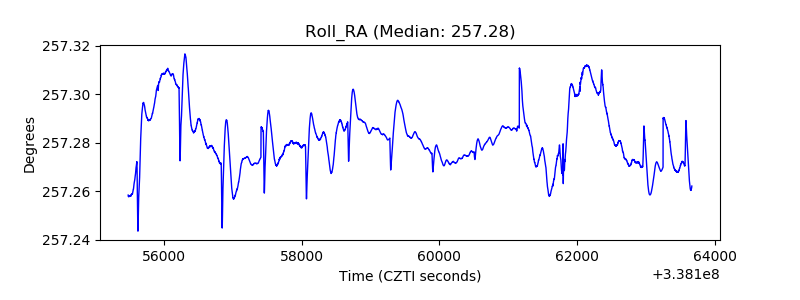 |
| Veto Counter | 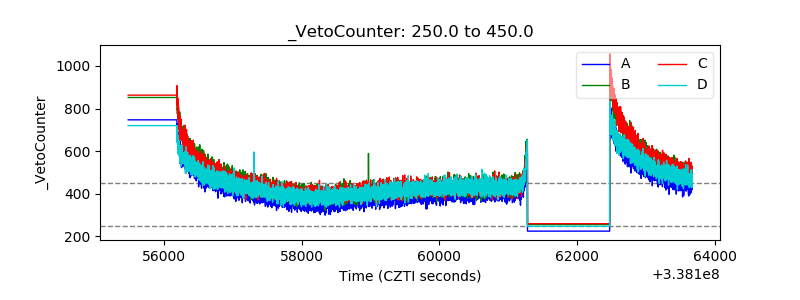 |