| Param | Original file | Final file |
|---|---|---|
| Filename | modeM0/AS1A09_044T01_9000003888_26907cztM0_level2.evt | modeM0/AS1A09_044T01_9000003888_26907cztM0_level2_quad_clean.evt |
| Size (bytes) | 637,116,480 | 82,143,360 |
| Size | 607.6 MB | 78.3 MB |
| Events in quadrant A | 4,081,720 | 540,924 |
| Events in quadrant B | 5,103,049 | 494,674 |
| Events in quadrant C | 3,384,911 | 545,819 |
| Events in quadrant D | 6,303,500 | 469,814 |
| Mode M0 | |||
|---|---|---|---|
| Quadrant | BADHDUFLAG | Total packets | Discarded packets |
| A | 0 | 16006 | 0 |
| B | 0 | 19197 | 0 |
| C | 0 | 13777 | 0 |
| D | 0 | 23011 | 0 |
| Mode M9 | |||
|---|---|---|---|
| Quadrant | BADHDUFLAG | Total packets | Discarded packets |
| A | 0 | 13 | 0 |
| B | 0 | 13 | 0 |
| C | 0 | 13 | 0 |
| D | 0 | 13 | 0 |
| Quadrant | Total seconds | Saturated seconds | Saturation percentage |
|---|---|---|---|
| A | 6235 | 156 | 2.502005% |
| B | 6236 | 768 | 12.315587% |
| C | 6236 | 77 | 1.234766% |
| D | 6236 | 718 | 11.513791% |
Noise dominated data is calculated using 1-second bins in cleaned event files. If a bin has >2000 counts, and if more than 50% of those come from <1% of pixels, then it is considered to be noise-dominated and hence unusable.
| Quadrant | # 1 sec bins | Bins with >0 counts | Bins with >2000 counts | High rate bins dominated by noise | Noise dominated (total time) | Noise dominated (detector-on time) | Marked lightcurve |
|---|---|---|---|---|---|---|---|
| A | 7530 | 6236 | 115 | 115 | 1.53% | 1.84% | 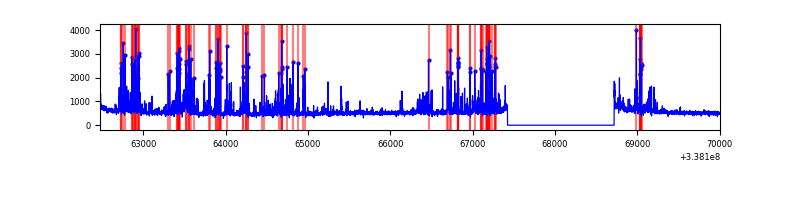 |
| B | 7531 | 6237 | 511 | 511 | 6.79% | 8.19% | 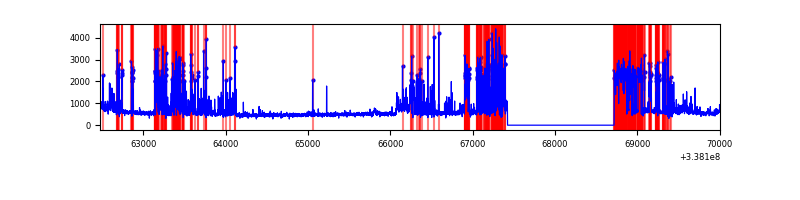 |
| C | 7531 | 6237 | 19 | 19 | 0.25% | 0.30% | 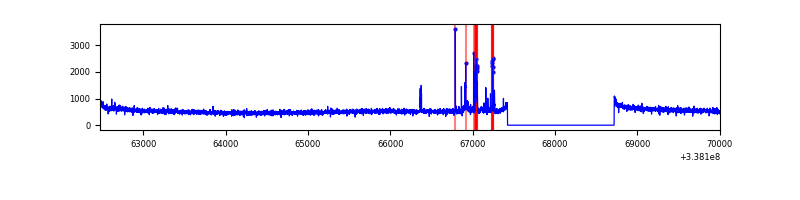 |
| D | 7531 | 6237 | 654 | 654 | 8.68% | 10.49% | 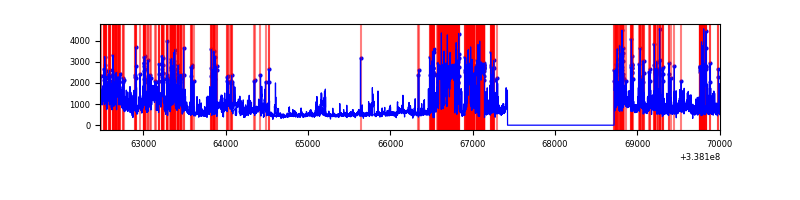 |
Top three noisy pixels from each quadrant. If the there are fewer than three noisy pixels in the level2.evt file, extra rows are filled as -1
| Pixel properties | Quadrant properties | ||||||
|---|---|---|---|---|---|---|---|
| Quadrant | DetID | PixID | Counts | Sigma | Mean | Median | Sigma |
| A | 0 | 13 | 911807 | 5655.95 | 821 | 808 | 161.1 |
| A | 13 | 254 | 10500 | 60.17 | 821 | 808 | 161.1 |
| A | 3 | 137 | 6994 | 38.41 | 821 | 808 | 161.1 |
| B | 3 | 64 | 1775832 | 12474.87 | 772 | 756 | 142.3 |
| B | 10 | 245 | 209234 | 1465.14 | 772 | 756 | 142.3 |
| B | 0 | 189 | 39574 | 272.8 | 772 | 756 | 142.3 |
| C | 14 | 238 | 131913 | 710.73 | 804 | 812 | 184.5 |
| C | 0 | 207 | 97449 | 523.89 | 804 | 812 | 184.5 |
| C | 15 | 208 | 11456 | 57.7 | 804 | 812 | 184.5 |
| D | 1 | 52 | 2566160 | 14488.49 | 754 | 738 | 177.1 |
| D | 7 | 80 | 412497 | 2325.45 | 754 | 738 | 177.1 |
| D | 2 | 250 | 265761 | 1496.74 | 754 | 738 | 177.1 |
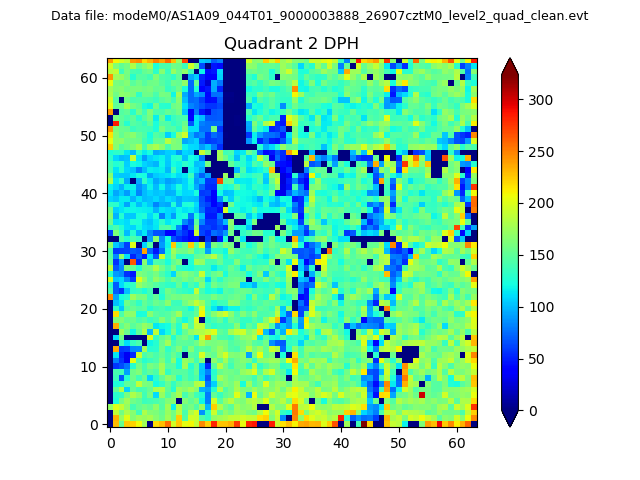
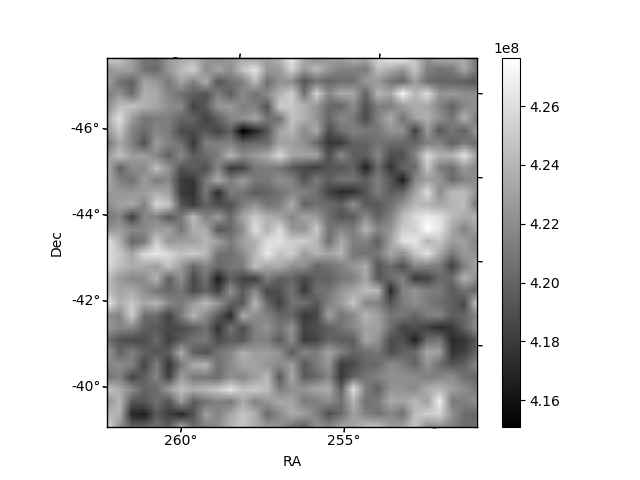
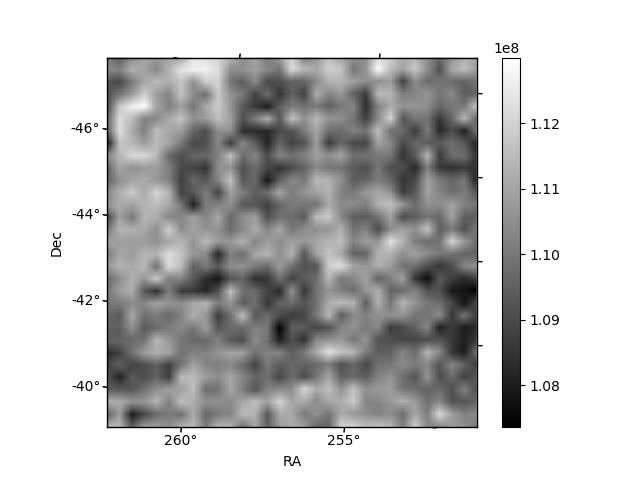
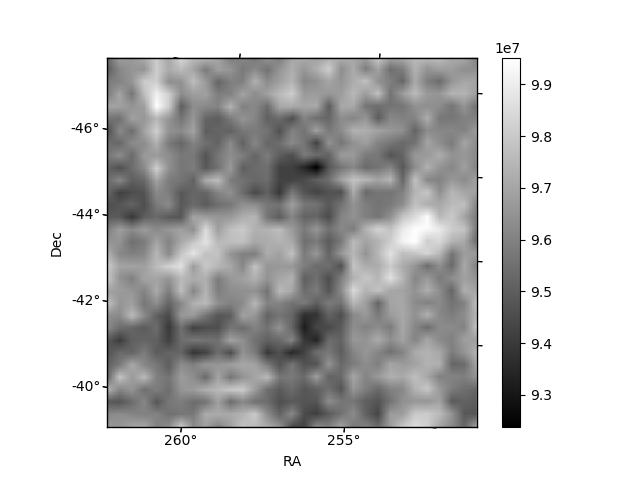
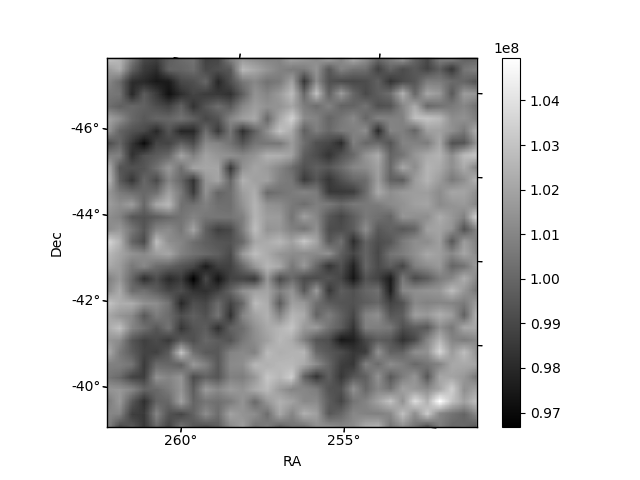
Histogram calculated using DETX and DETY for each event in the final _common_clean file
| Quadrant A | 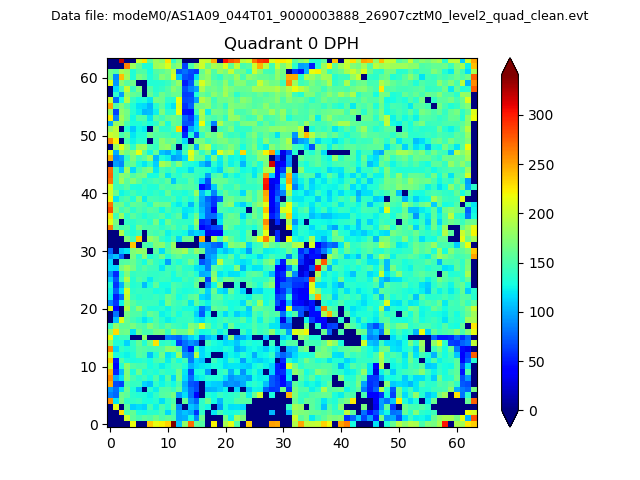 |
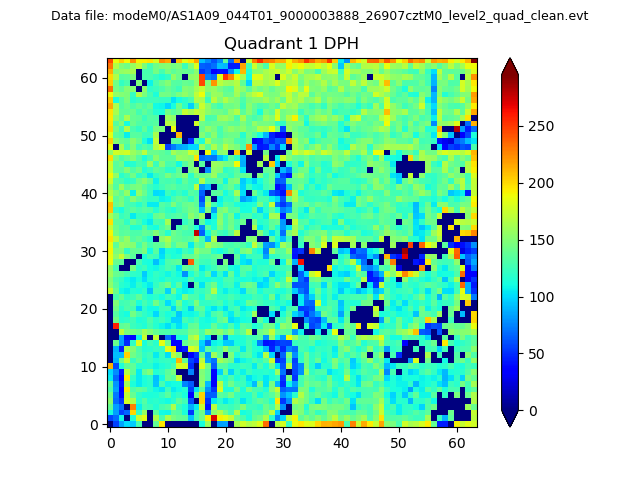 |
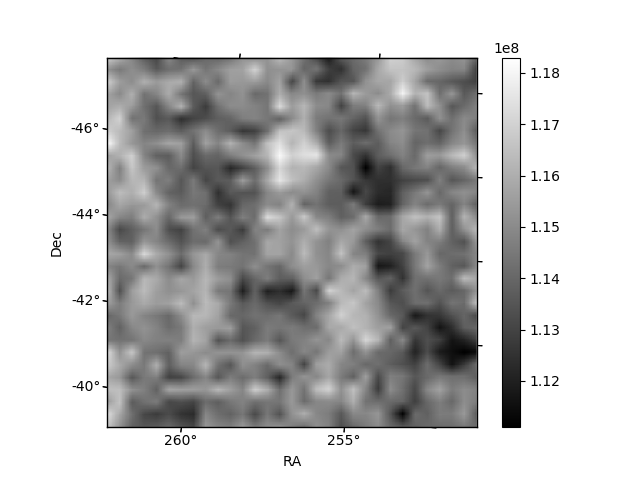
Quadrant B |
|---|---|---|---|
| Quadrant D | 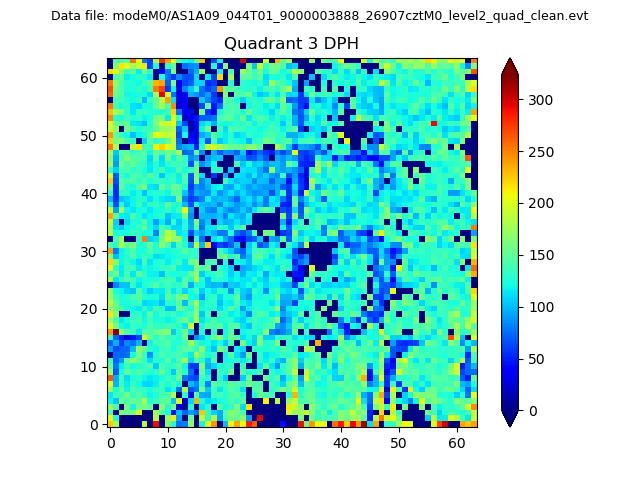 |
 |
Quadrant C |
| Plot type | Count rate plots | Images |
|---|---|---|
| Comparison with Poisson distribution Blue bars denote a histogram of data divided into 1 sec bins. Red curve is a Poisson curve with rate = median count rate of data. |
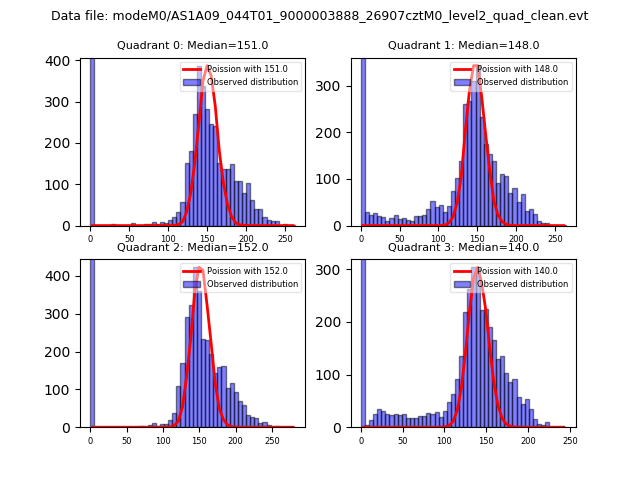 |
 |
| Quadrant-wise count rates Data is divided into 100 sec bins |
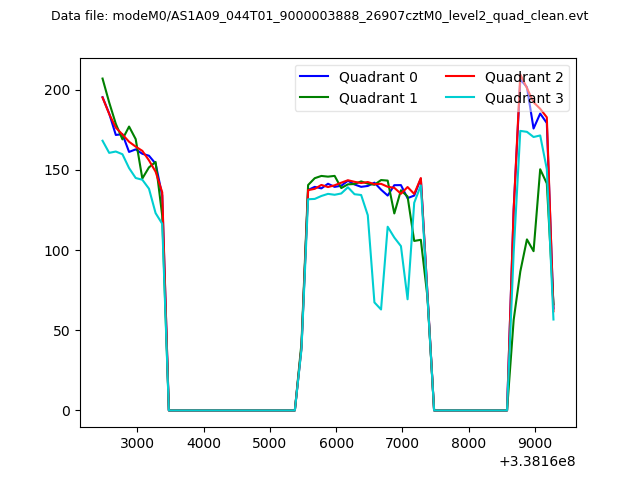 |
|
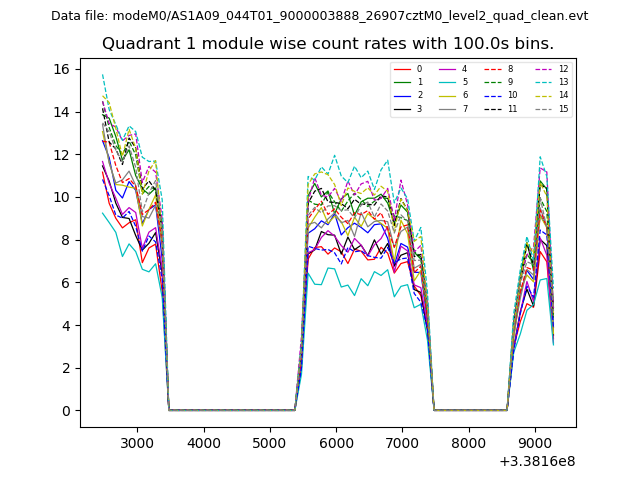
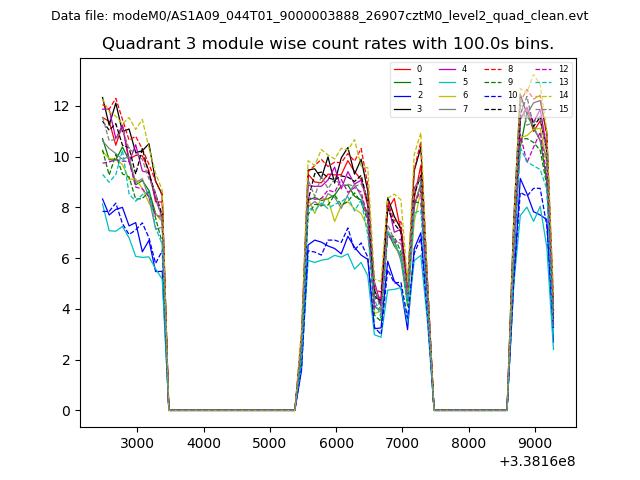
| Module-wise count rates for Quadrant A Data is divided into 100 sec bins |
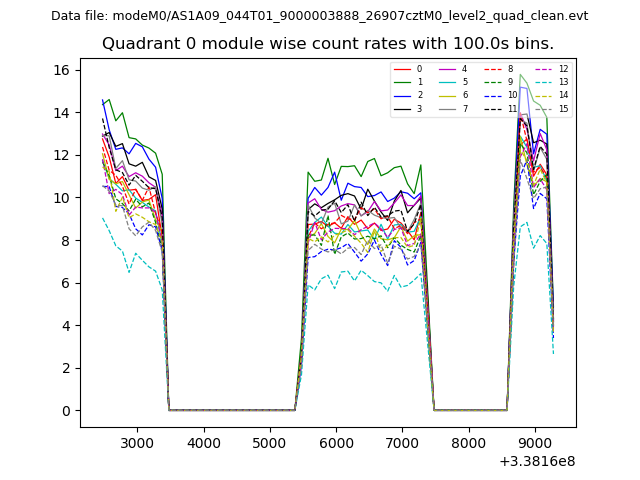 |
 |
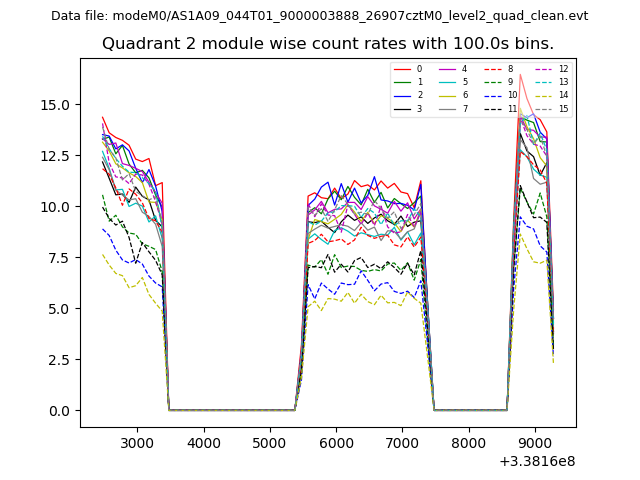
| Module-wise count rates for Quadrant B Data is divided into 100 sec bins |
 |
 |
| Module-wise count rates for Quadrant C Data is divided into 100 sec bins |
 |
 |
| Module-wise count rates for Quadrant D Data is divided into 100 sec bins |
 |
 |
| Parameter | Plot |
|---|---|
| CZT HV Monitor | 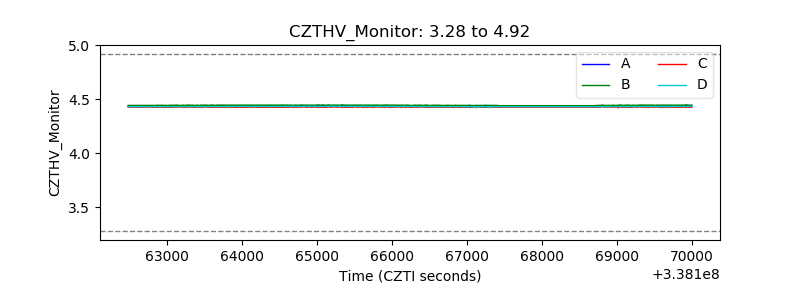 |
| D_VDD | 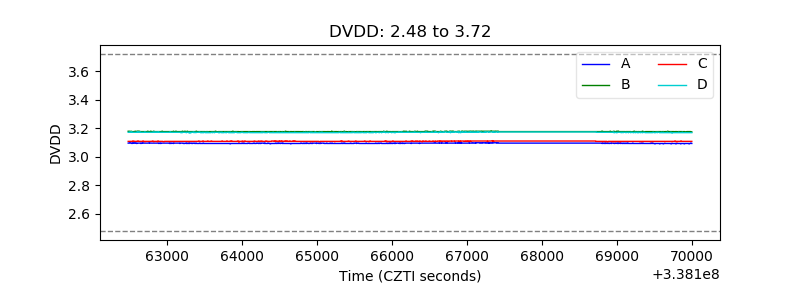 |
| Temperature 1 | 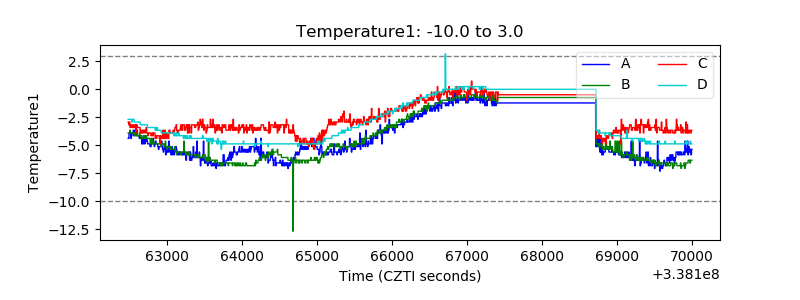 |
| Veto HV Monitor | 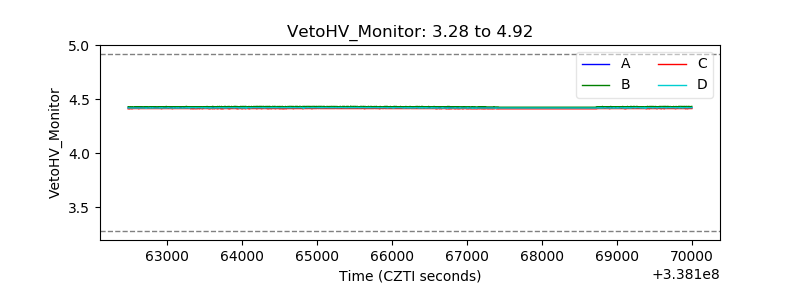 |
| Veto LLD | 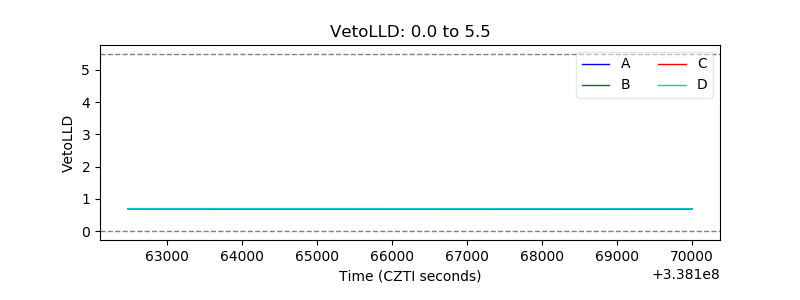 |
| Alpha Counter | 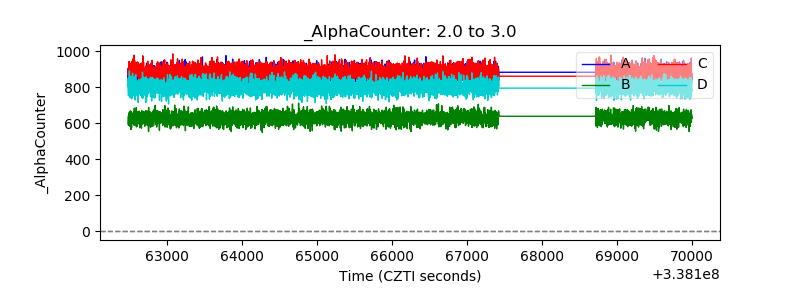 |
| _CPM_Rate | 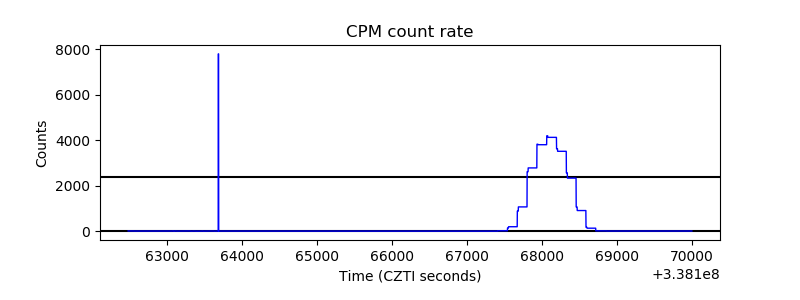 |
| CZT Counter | 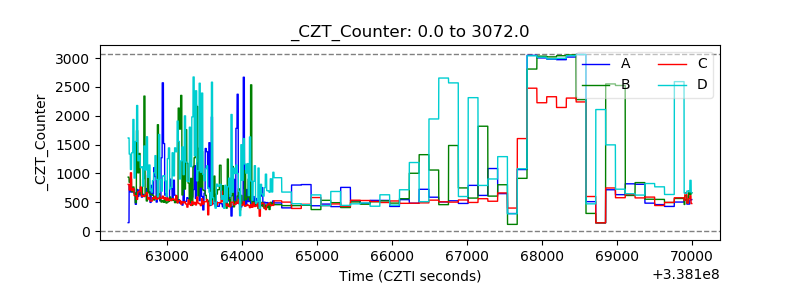 |
| +2.5 Volts monitor |  |
| +5 Volts monitor |  |
| _ROLL_ROT | 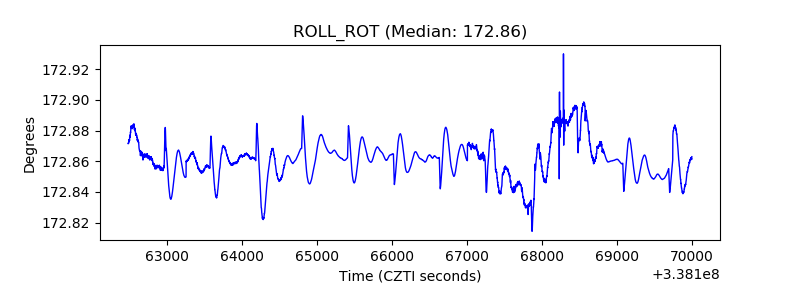 |
| _Roll_DEC | 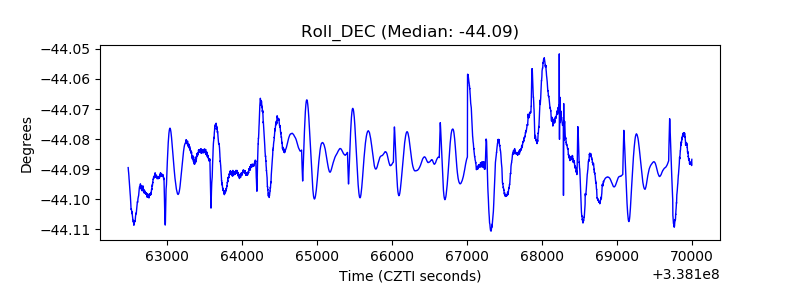 |
| _Roll_RA | 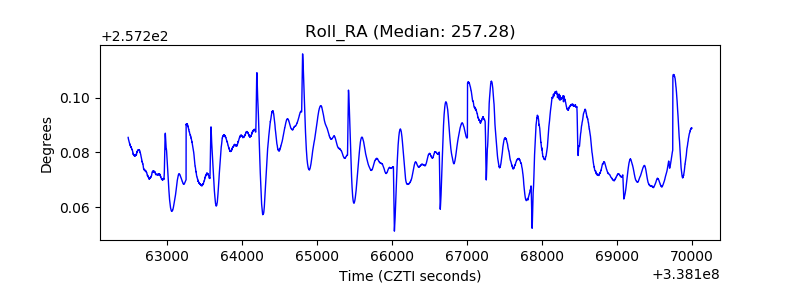 |
| Veto Counter | 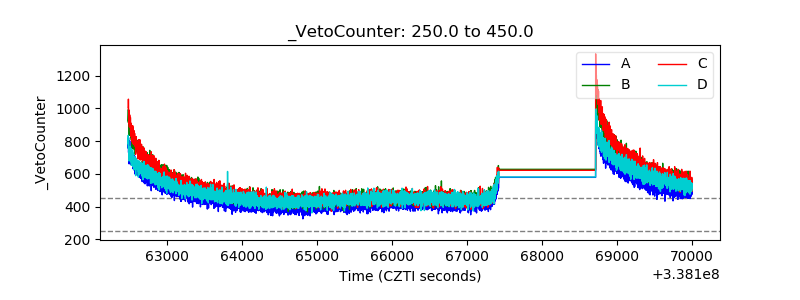 |