| Param | Original file | Final file |
|---|---|---|
| Filename | modeM0/AS1A09_044T01_9000003888_26909cztM0_level2.evt | modeM0/AS1A09_044T01_9000003888_26909cztM0_level2_quad_clean.evt |
| Size (bytes) | 591,906,240 | 70,439,040 |
| Size | 564.5 MB | 67.2 MB |
| Events in quadrant A | 3,953,235 | 423,517 |
| Events in quadrant B | 4,577,551 | 433,338 |
| Events in quadrant C | 3,629,185 | 429,123 |
| Events in quadrant D | 5,333,581 | 400,614 |
| Mode M0 | |||
|---|---|---|---|
| Quadrant | BADHDUFLAG | Total packets | Discarded packets |
| A | 0 | 15642 | 0 |
| B | 0 | 17807 | 0 |
| C | 0 | 14476 | 0 |
| D | 0 | 20020 | 0 |
| Mode M9 | |||
|---|---|---|---|
| Quadrant | BADHDUFLAG | Total packets | Discarded packets |
| A | 0 | 17 | 0 |
| B | 0 | 18 | 0 |
| C | 0 | 18 | 0 |
| D | 0 | 18 | 0 |
| Quadrant | Total seconds | Saturated seconds | Saturation percentage |
|---|---|---|---|
| A | 6392 | 112 | 1.752190% |
| B | 6392 | 292 | 4.568210% |
| C | 6391 | 145 | 2.268816% |
| D | 6391 | 457 | 7.150681% |
Noise dominated data is calculated using 1-second bins in cleaned event files. If a bin has >2000 counts, and if more than 50% of those come from <1% of pixels, then it is considered to be noise-dominated and hence unusable.
| Quadrant | # 1 sec bins | Bins with >0 counts | Bins with >2000 counts | High rate bins dominated by noise | Noise dominated (total time) | Noise dominated (detector-on time) | Marked lightcurve |
|---|---|---|---|---|---|---|---|
| A | 7787 | 6392 | 27 | 27 | 0.35% | 0.42% | 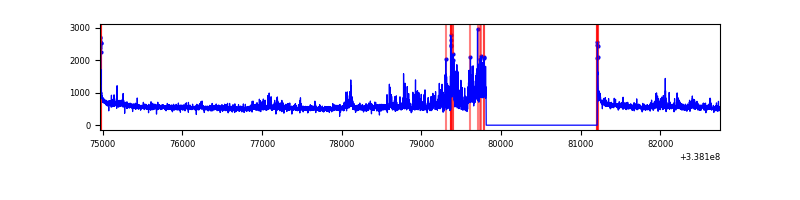 |
| B | 7787 | 6393 | 164 | 164 | 2.11% | 2.57% | 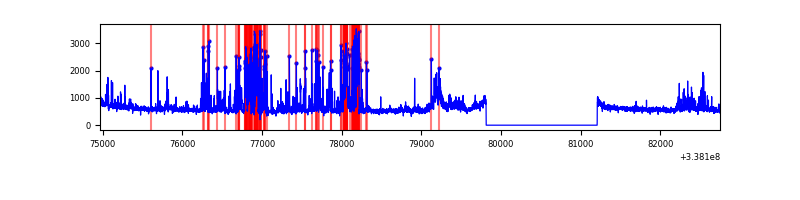 |
| C | 7786 | 6392 | 3 | 3 | 0.04% | 0.05% | 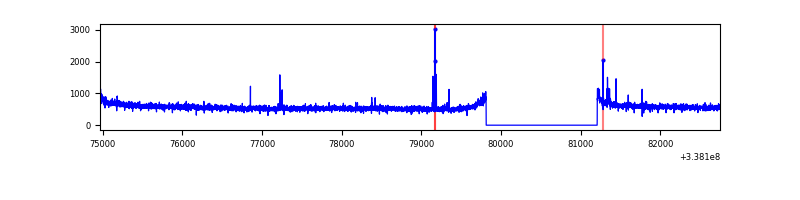 |
| D | 7786 | 6391 | 385 | 385 | 4.94% | 6.02% | 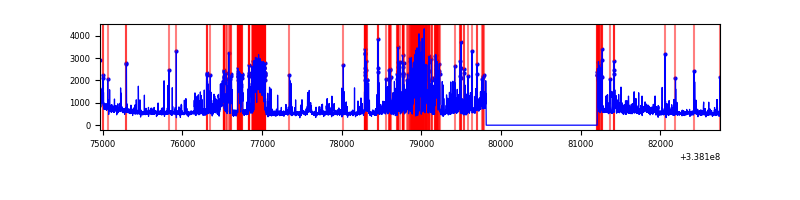 |
Top three noisy pixels from each quadrant. If the there are fewer than three noisy pixels in the level2.evt file, extra rows are filled as -1
| Pixel properties | Quadrant properties | ||||||
|---|---|---|---|---|---|---|---|
| Quadrant | DetID | PixID | Counts | Sigma | Mean | Median | Sigma |
| A | 0 | 13 | 457392 | 2598.6 | 896 | 883 | 175.7 |
| A | 8 | 192 | 40833 | 227.41 | 896 | 883 | 175.7 |
| A | 13 | 254 | 10134 | 52.66 | 896 | 883 | 175.7 |
| B | 10 | 245 | 859339 | 5259.45 | 896 | 877 | 163.2 |
| B | 15 | 33 | 114573 | 696.57 | 896 | 877 | 163.2 |
| B | 0 | 190 | 62693 | 378.72 | 896 | 877 | 163.2 |
| C | 14 | 238 | 146405 | 720.86 | 883 | 892 | 201.9 |
| C | 3 | 233 | 25295 | 120.89 | 883 | 892 | 201.9 |
| C | 15 | 208 | 17604 | 82.79 | 883 | 892 | 201.9 |
| D | 1 | 52 | 1435507 | 7119.48 | 861 | 844 | 201.5 |
| D | 7 | 80 | 380102 | 1882.06 | 861 | 844 | 201.5 |
| D | 2 | 250 | 139576 | 688.45 | 861 | 844 | 201.5 |
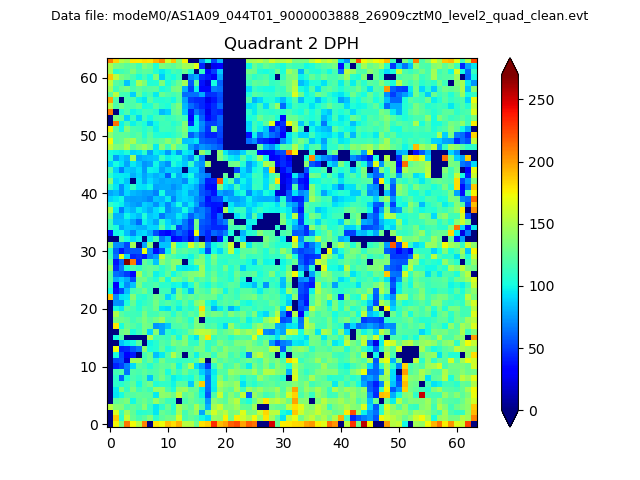
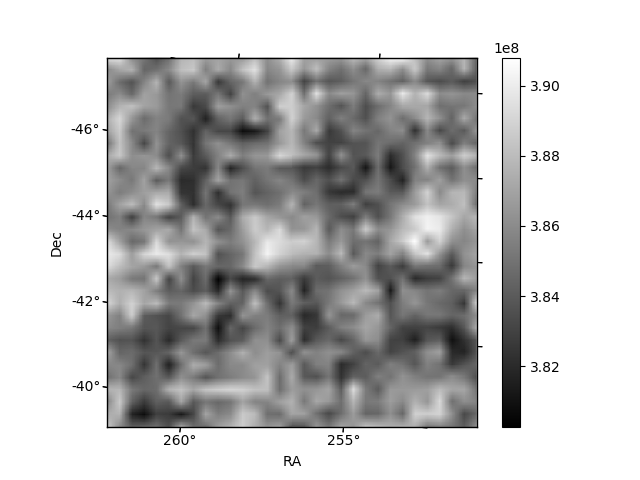
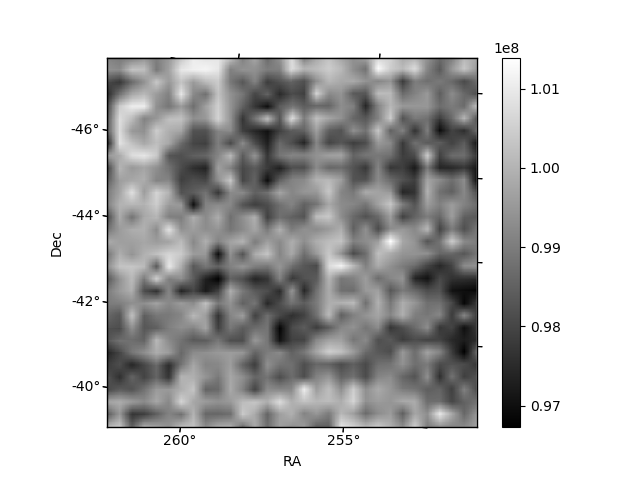
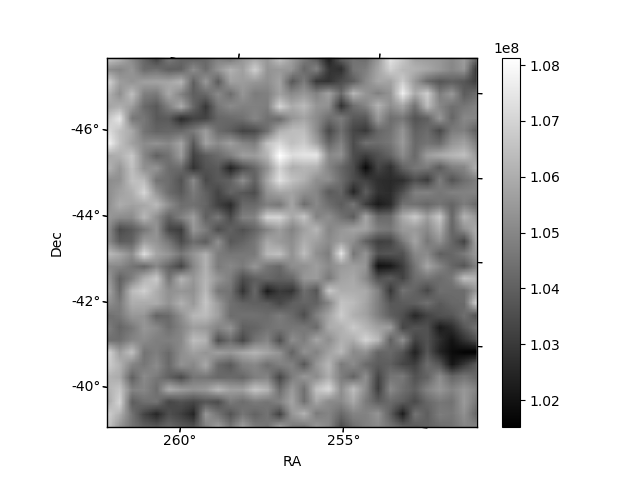
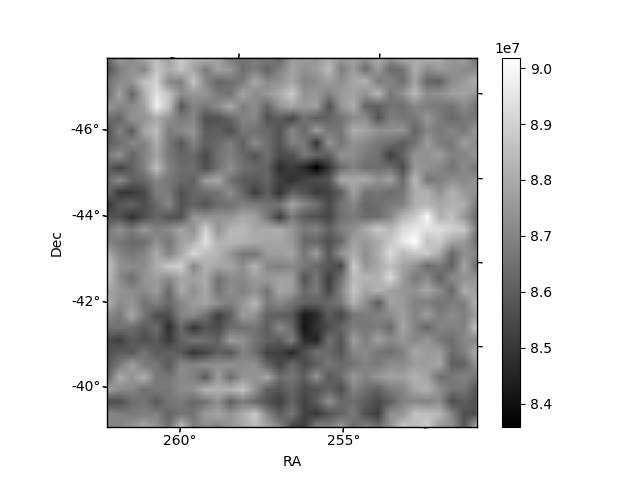
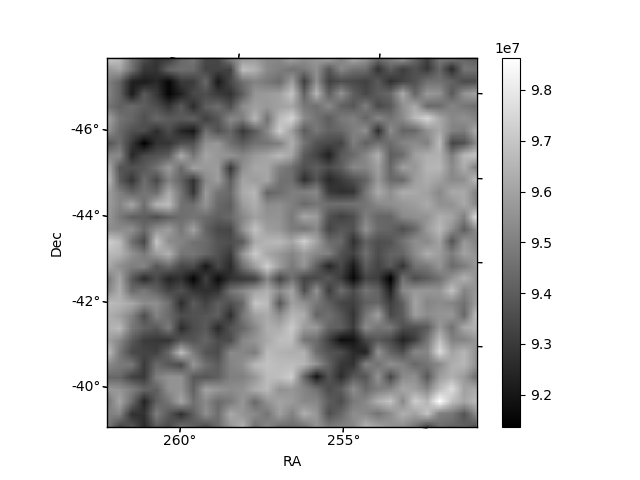
Histogram calculated using DETX and DETY for each event in the final _common_clean file
| Quadrant A | 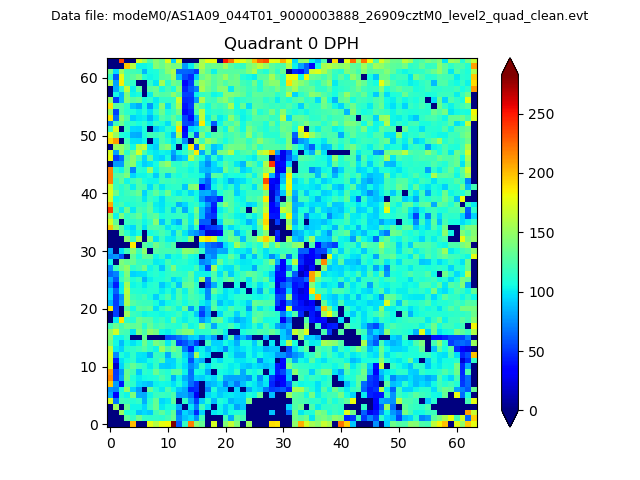 |
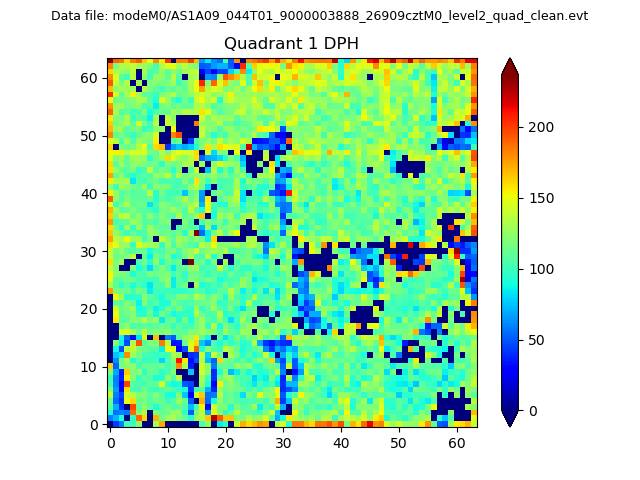 |
Quadrant B |
|---|---|---|---|
| Quadrant D | 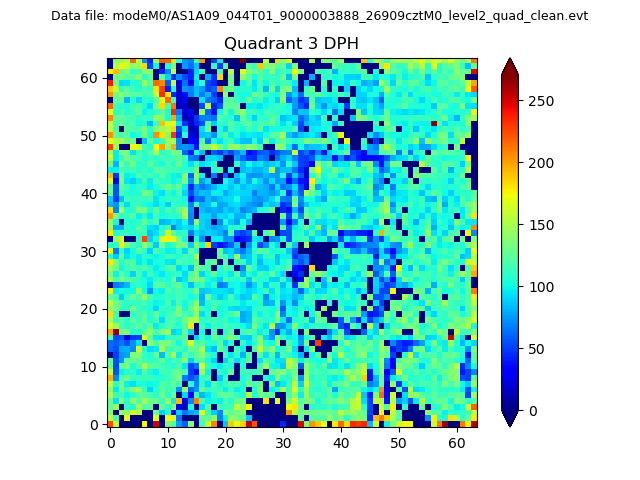 |
 |
Quadrant C |
| Plot type | Count rate plots | Images |
|---|---|---|
| Comparison with Poisson distribution Blue bars denote a histogram of data divided into 1 sec bins. Red curve is a Poisson curve with rate = median count rate of data. |
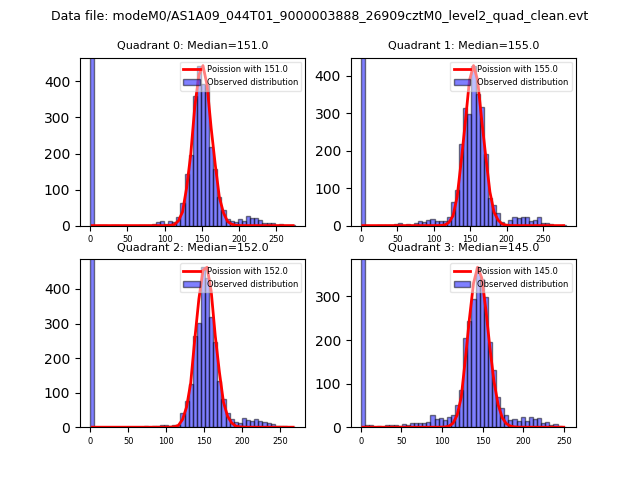 |
 |
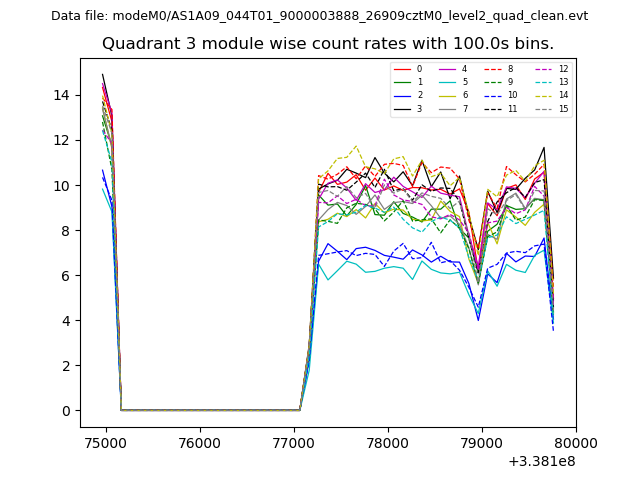
| Quadrant-wise count rates Data is divided into 100 sec bins |
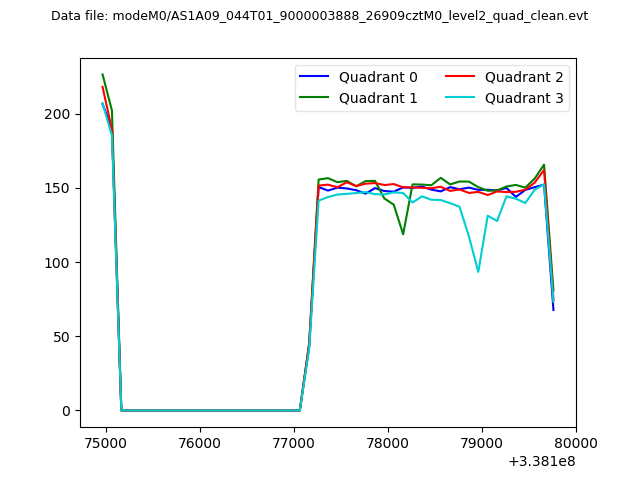 |
|
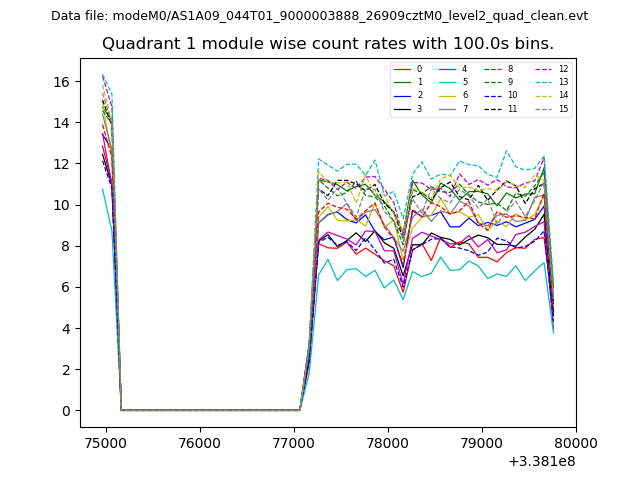
| Module-wise count rates for Quadrant A Data is divided into 100 sec bins |
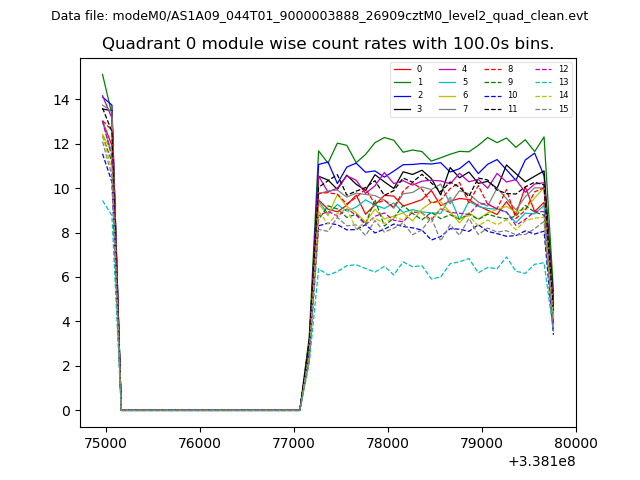 |
 |
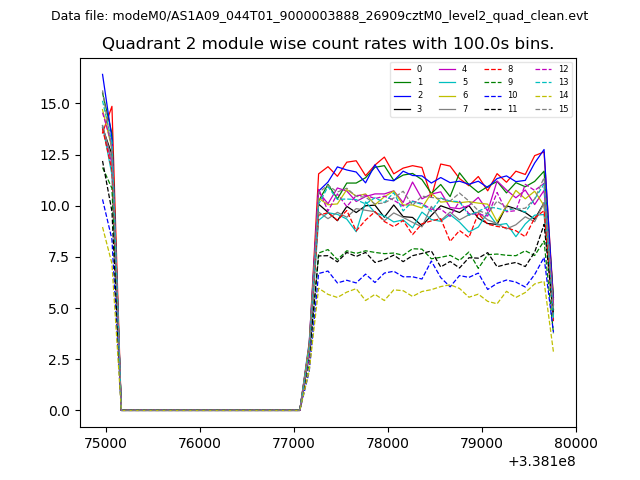
| Module-wise count rates for Quadrant B Data is divided into 100 sec bins |
 |
 |
| Module-wise count rates for Quadrant C Data is divided into 100 sec bins |
 |
 |
| Module-wise count rates for Quadrant D Data is divided into 100 sec bins |
 |
 |
| Parameter | Plot |
|---|---|
| CZT HV Monitor | 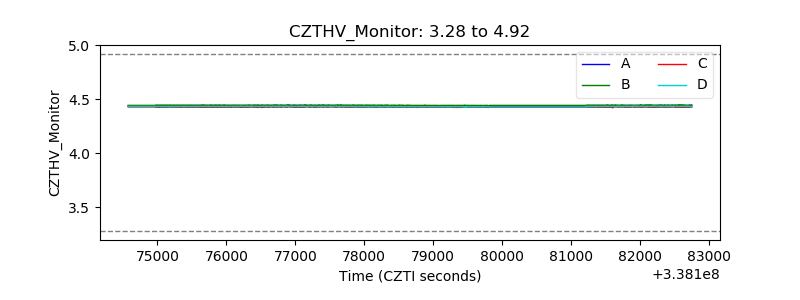 |
| D_VDD | 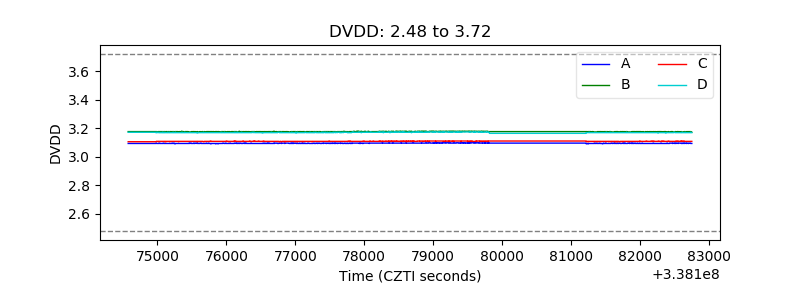 |
| Temperature 1 | 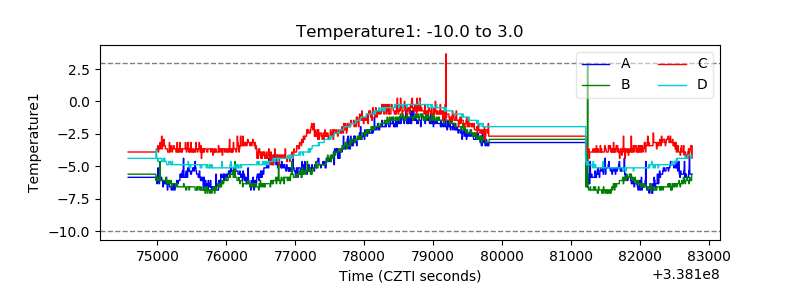 |
| Veto HV Monitor | 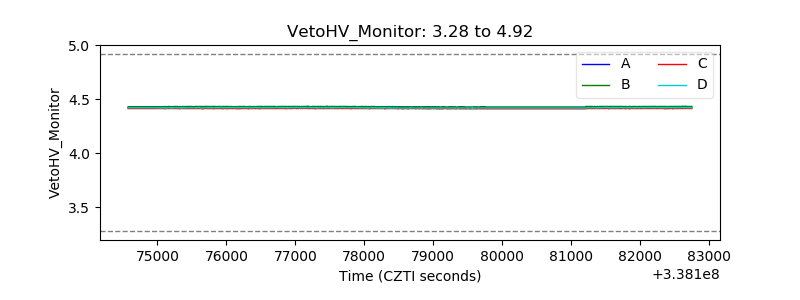 |
| Veto LLD | 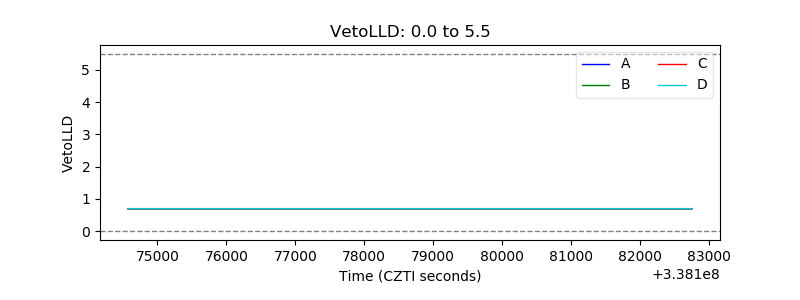 |
| Alpha Counter | 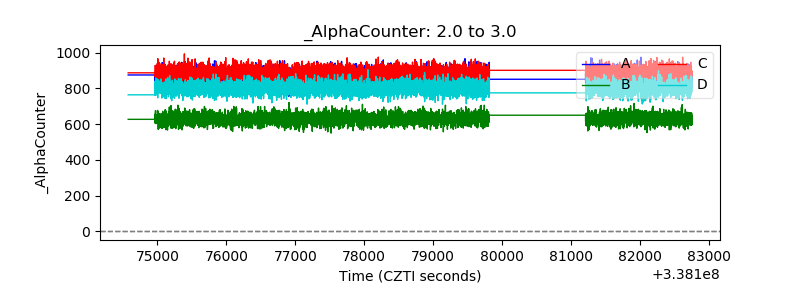 |
| _CPM_Rate | 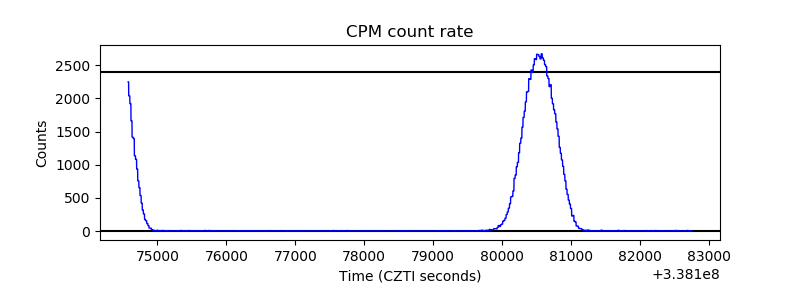 |
| CZT Counter | 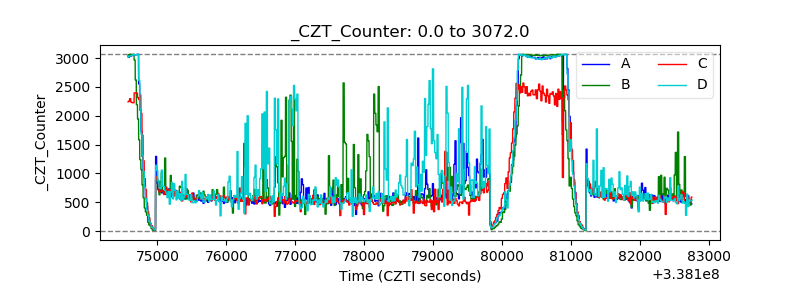 |
| +2.5 Volts monitor |  |
| +5 Volts monitor |  |
| _ROLL_ROT | 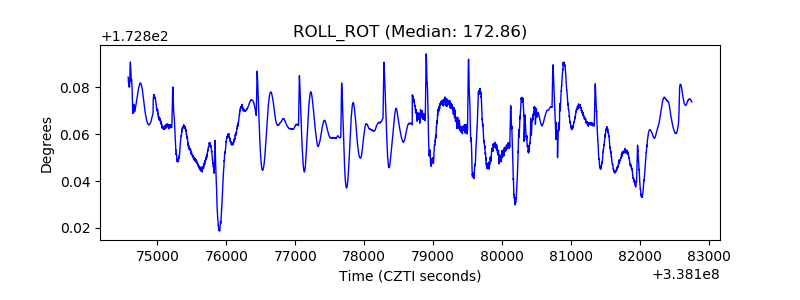 |
| _Roll_DEC | 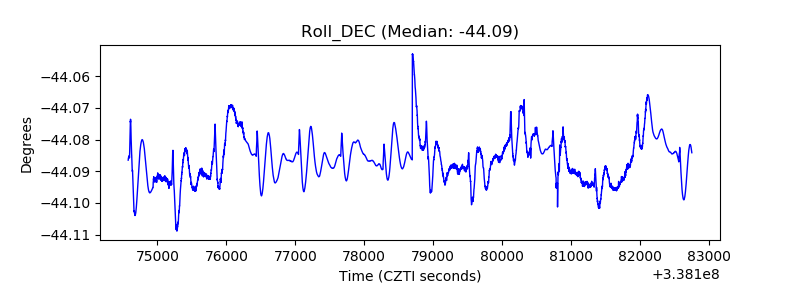 |
| _Roll_RA | 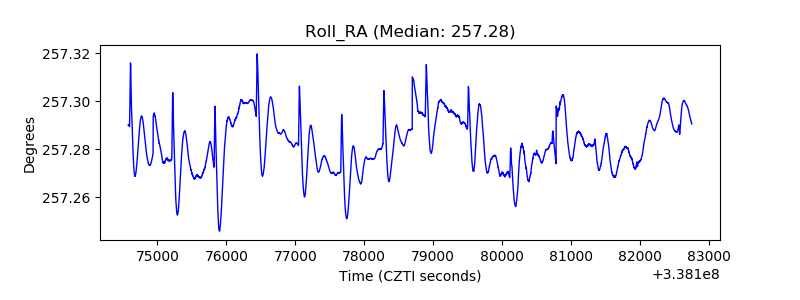 |
| Veto Counter | 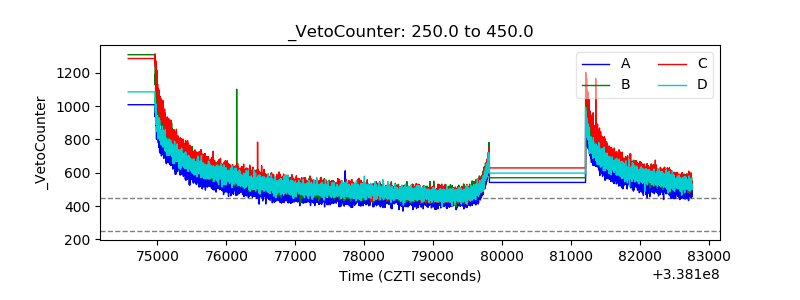 |