| Param | Original file | Final file |
|---|---|---|
| Filename | modeM0/AS1A09_044T01_9000003888_26910cztM0_level2.evt | modeM0/AS1A09_044T01_9000003888_26910cztM0_level2_quad_clean.evt |
| Size (bytes) | 637,652,160 | 67,763,520 |
| Size | 608.1 MB | 64.6 MB |
| Events in quadrant A | 3,346,969 | 447,999 |
| Events in quadrant B | 7,852,944 | 312,070 |
| Events in quadrant C | 3,271,638 | 448,300 |
| Events in quadrant D | 4,432,791 | 422,449 |
| Mode M0 | |||
|---|---|---|---|
| Quadrant | BADHDUFLAG | Total packets | Discarded packets |
| A | 0 | 13416 | 0 |
| B | 0 | 27304 | 0 |
| C | 0 | 13100 | 0 |
| D | 0 | 17123 | 0 |
| Mode M9 | |||
|---|---|---|---|
| Quadrant | BADHDUFLAG | Total packets | Discarded packets |
| A | 0 | 13 | 0 |
| B | 0 | 13 | 0 |
| C | 0 | 13 | 0 |
| D | 0 | 13 | 0 |
| Quadrant | Total seconds | Saturated seconds | Saturation percentage |
|---|---|---|---|
| A | 6014 | 25 | 0.415697% |
| B | 6015 | 1960 | 32.585204% |
| C | 6015 | 87 | 1.446384% |
| D | 6015 | 209 | 3.474647% |
Noise dominated data is calculated using 1-second bins in cleaned event files. If a bin has >2000 counts, and if more than 50% of those come from <1% of pixels, then it is considered to be noise-dominated and hence unusable.
| Quadrant | # 1 sec bins | Bins with >0 counts | Bins with >2000 counts | High rate bins dominated by noise | Noise dominated (total time) | Noise dominated (detector-on time) | Marked lightcurve |
|---|---|---|---|---|---|---|---|
| A | 7374 | 6015 | 6 | 6 | 0.08% | 0.10% | 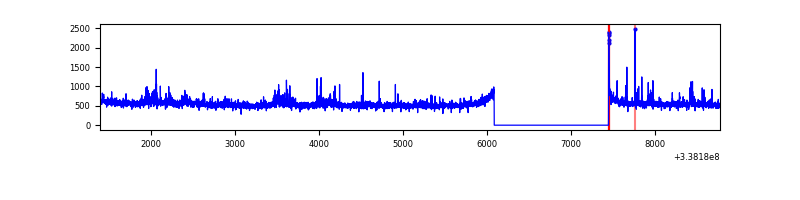 |
| B | 7375 | 6015 | 1672 | 1672 | 22.67% | 27.80% | 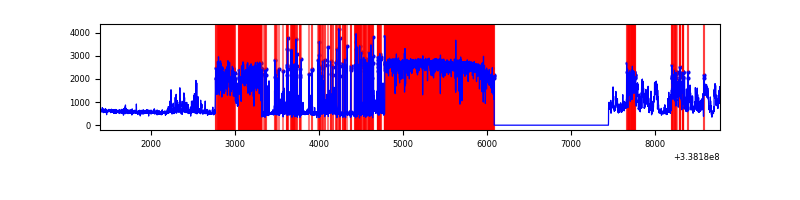 |
| C | 7375 | 6016 | 0 | 0 | 0.00% | 0.00% | 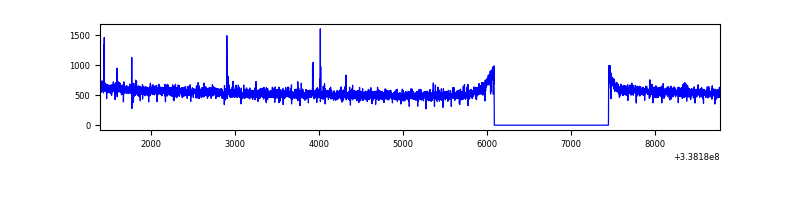 |
| D | 7375 | 6015 | 172 | 172 | 2.33% | 2.86% | 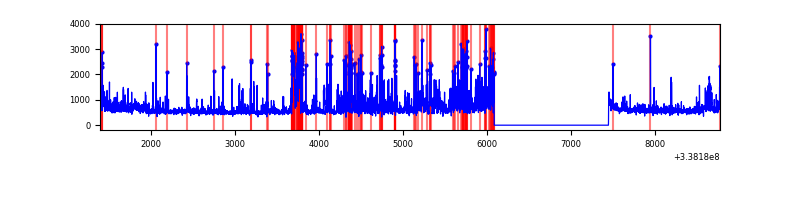 |
Top three noisy pixels from each quadrant. If the there are fewer than three noisy pixels in the level2.evt file, extra rows are filled as -1
| Pixel properties | Quadrant properties | ||||||
|---|---|---|---|---|---|---|---|
| Quadrant | DetID | PixID | Counts | Sigma | Mean | Median | Sigma |
| A | 0 | 13 | 168784 | 1029.93 | 820 | 806 | 163.1 |
| A | 8 | 192 | 15572 | 90.54 | 820 | 806 | 163.1 |
| A | 13 | 254 | 9029 | 50.42 | 820 | 806 | 163.1 |
| B | 0 | 189 | 4702228 | 36110.24 | 703 | 688 | 130.2 |
| B | 10 | 245 | 334727 | 2565.59 | 703 | 688 | 130.2 |
| B | 0 | 190 | 50913 | 385.75 | 703 | 688 | 130.2 |
| C | 14 | 238 | 130761 | 710.73 | 801 | 810 | 182.8 |
| C | 15 | 208 | 18290 | 95.6 | 801 | 810 | 182.8 |
| C | 13 | 61 | 5540 | 25.87 | 801 | 810 | 182.8 |
| D | 1 | 52 | 994316 | 5322.9 | 788 | 771 | 186.7 |
| D | 15 | 36 | 226775 | 1210.81 | 788 | 771 | 186.7 |
| D | 2 | 250 | 74468 | 394.83 | 788 | 771 | 186.7 |
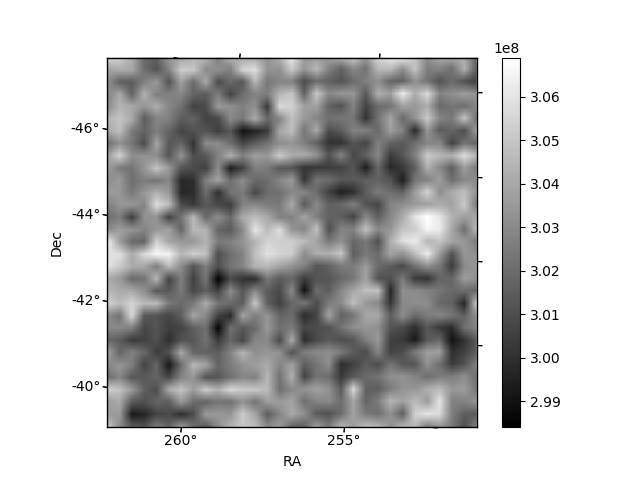
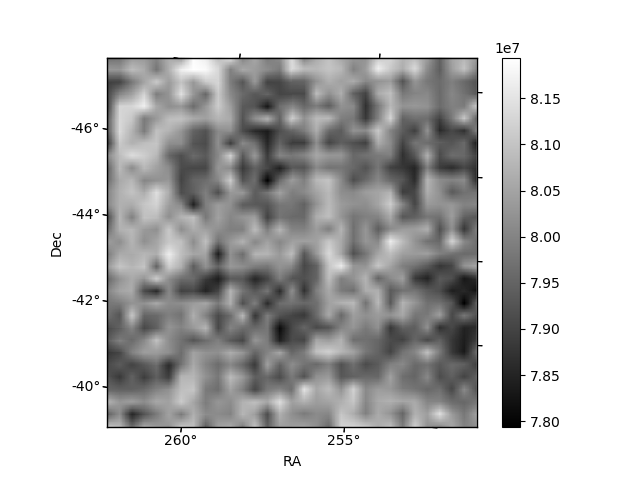
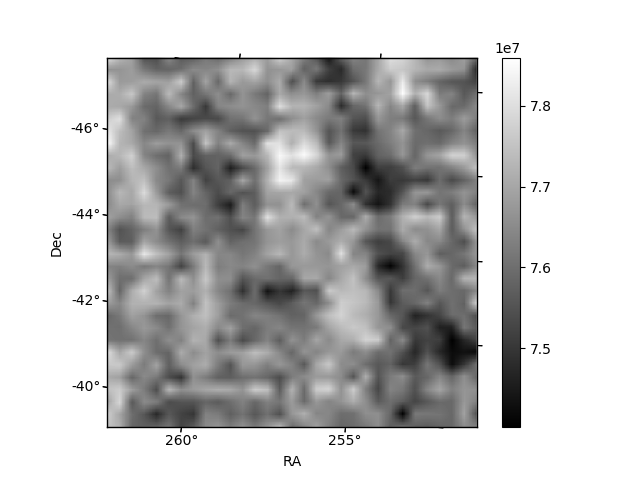
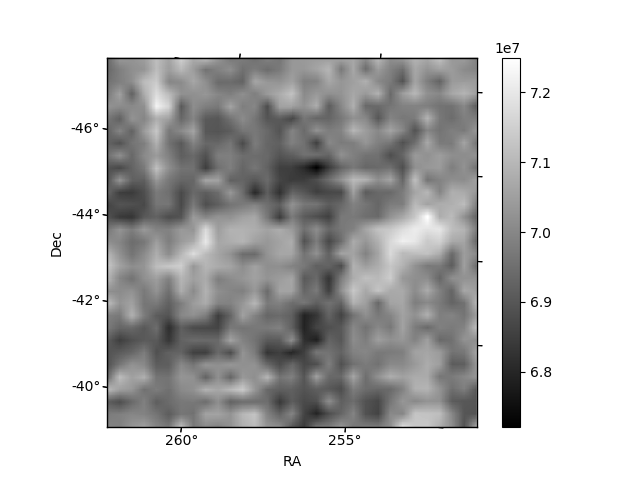
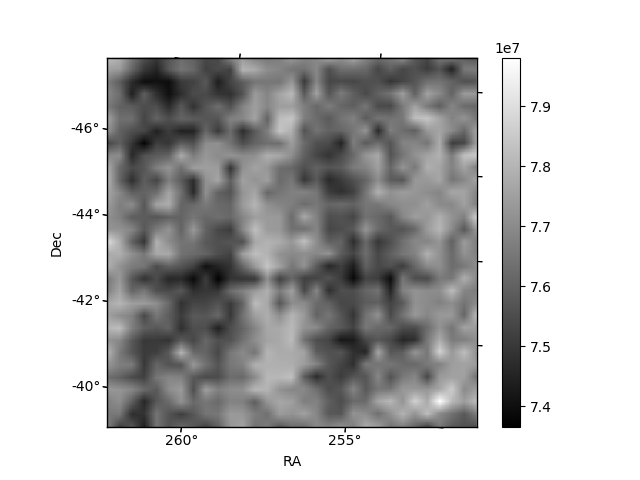
Histogram calculated using DETX and DETY for each event in the final _common_clean file
| Quadrant A | 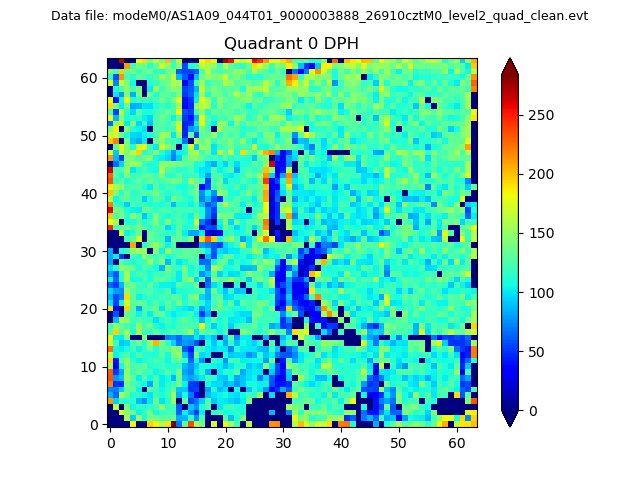 |
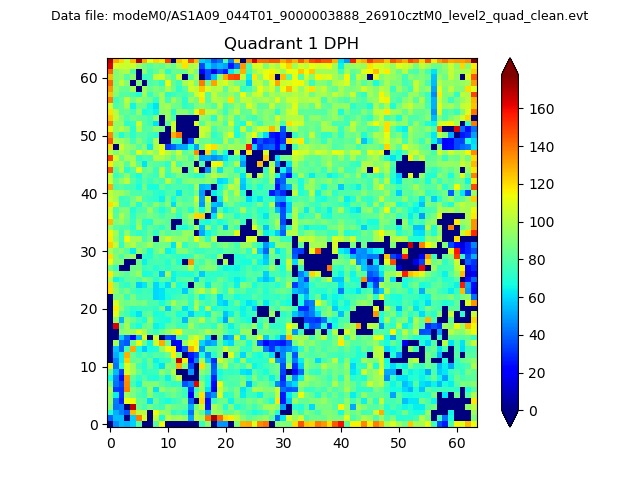 |
Quadrant B |
|---|---|---|---|
| Quadrant D | 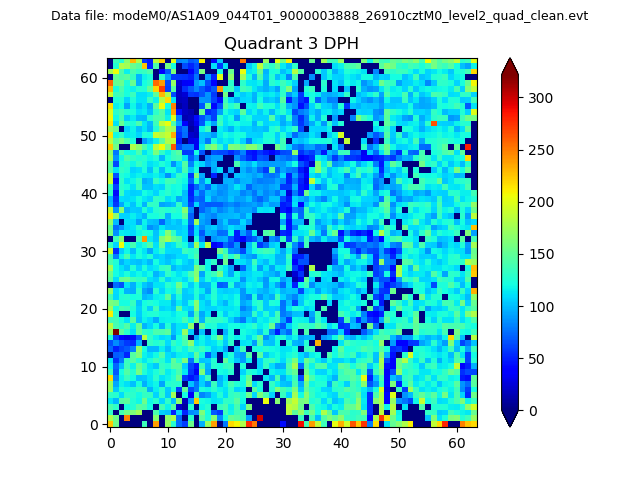 |
 |
Quadrant C |
| Plot type | Count rate plots | Images |
|---|---|---|
| Comparison with Poisson distribution Blue bars denote a histogram of data divided into 1 sec bins. Red curve is a Poisson curve with rate = median count rate of data. |
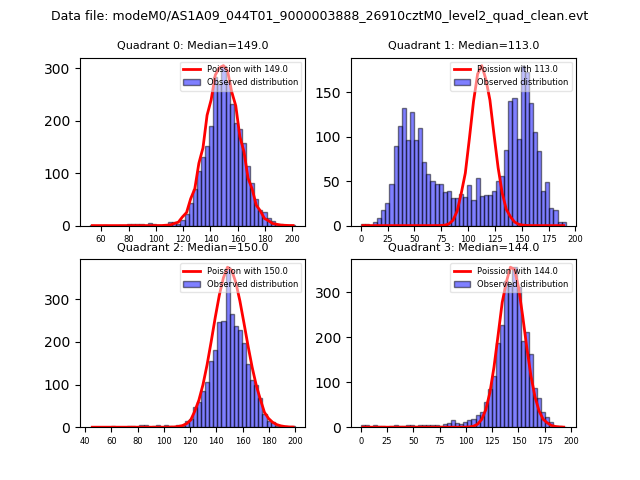 |
 |
| Quadrant-wise count rates Data is divided into 100 sec bins |
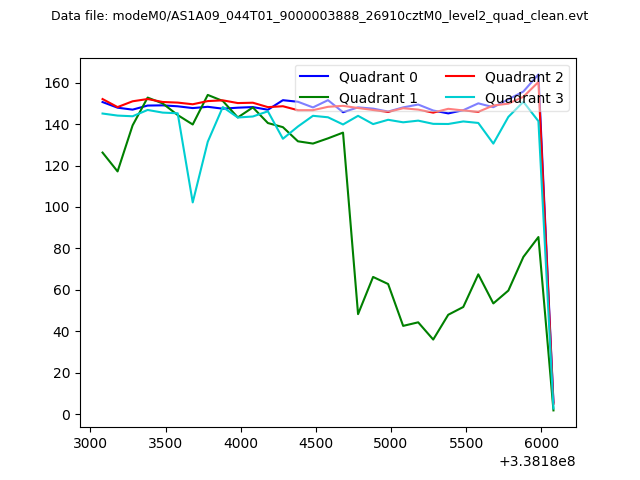 |
|
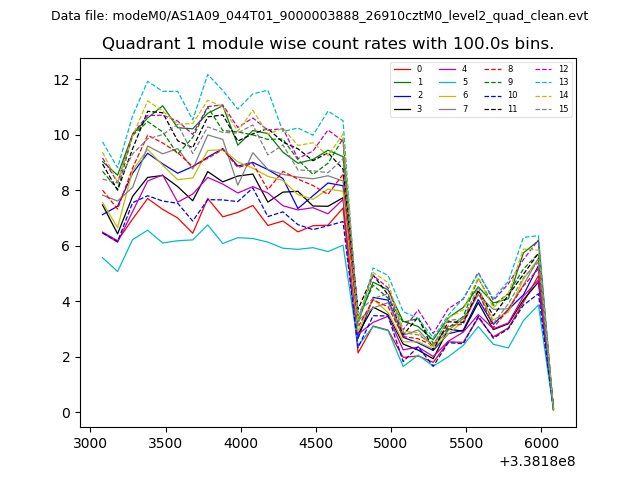
| Module-wise count rates for Quadrant A Data is divided into 100 sec bins |
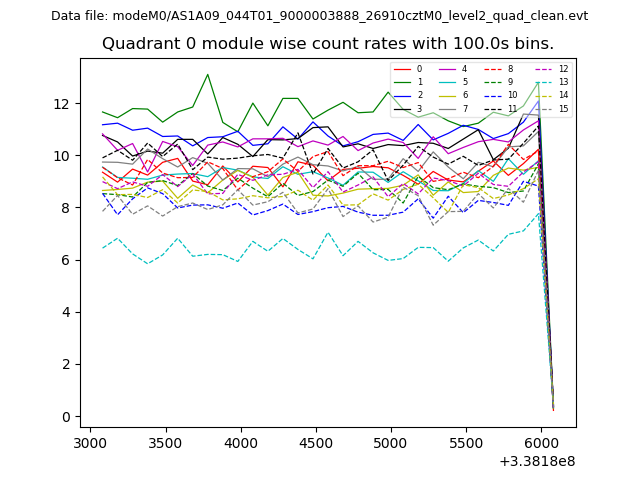 |
 |
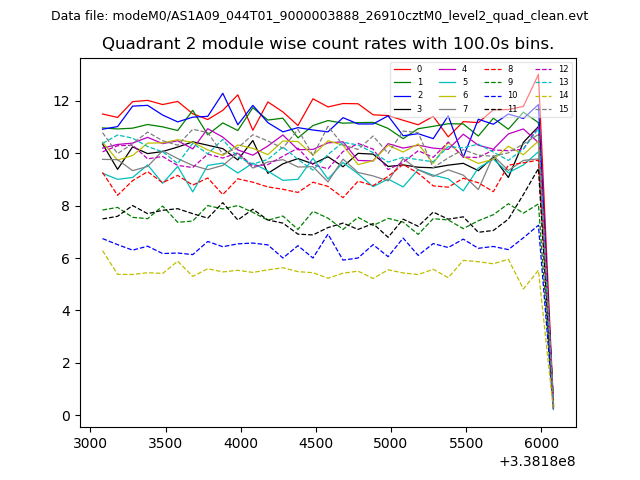
| Module-wise count rates for Quadrant B Data is divided into 100 sec bins |
 |
 |
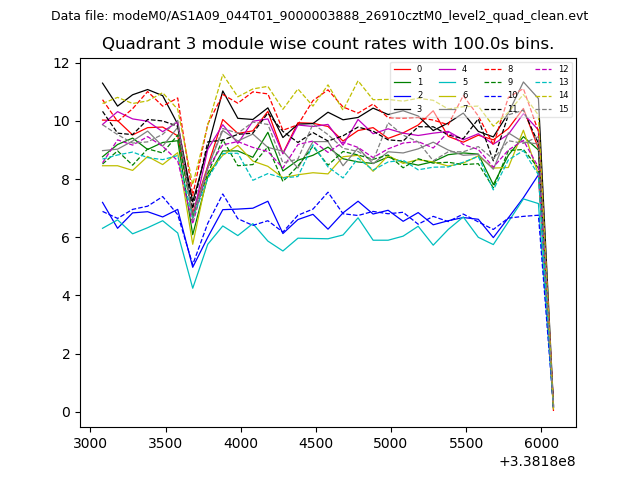
| Module-wise count rates for Quadrant C Data is divided into 100 sec bins |
 |
 |
| Module-wise count rates for Quadrant D Data is divided into 100 sec bins |
 |
 |
| Parameter | Plot |
|---|---|
| CZT HV Monitor |  |
| D_VDD | 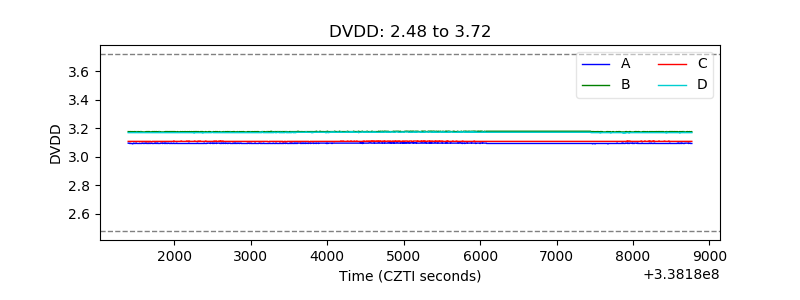 |
| Temperature 1 | 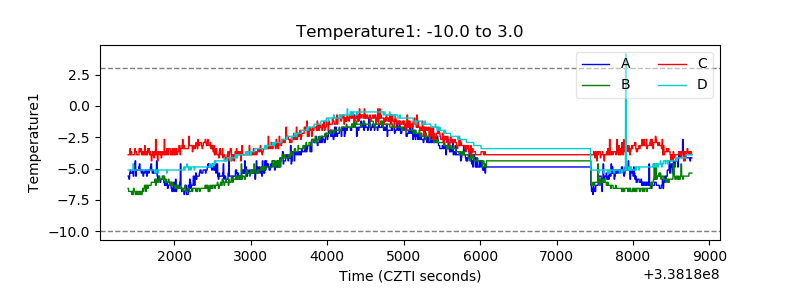 |
| Veto HV Monitor | 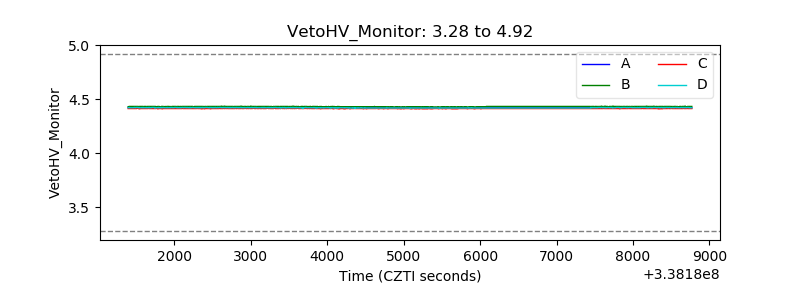 |
| Veto LLD | 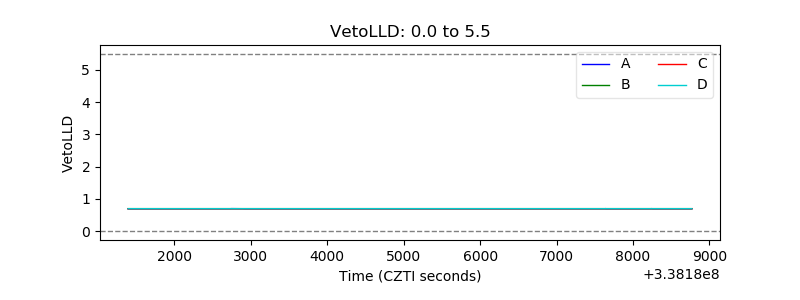 |
| Alpha Counter | 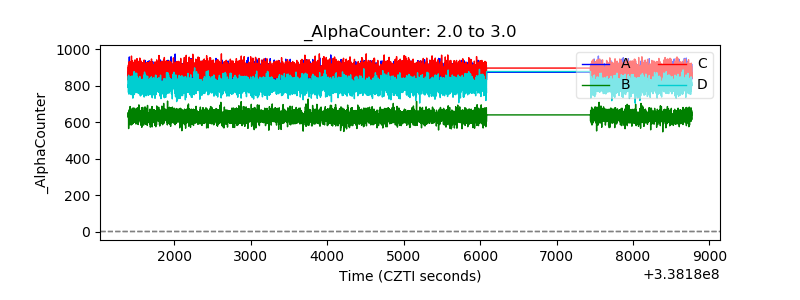 |
| _CPM_Rate | 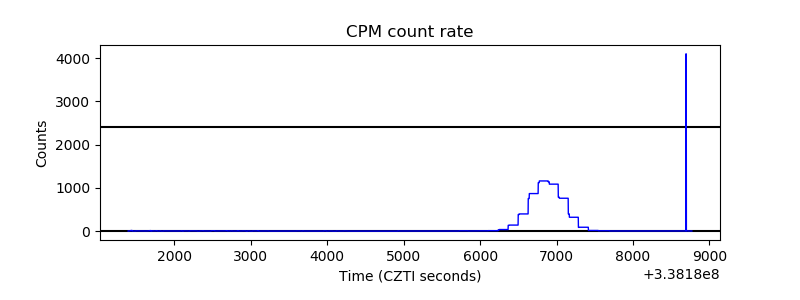 |
| CZT Counter | 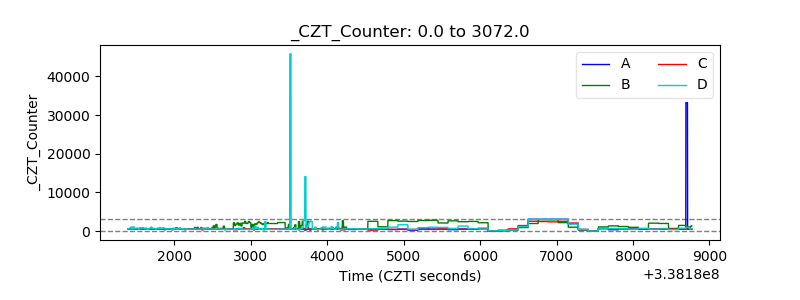 |
| +2.5 Volts monitor |  |
| +5 Volts monitor |  |
| _ROLL_ROT | 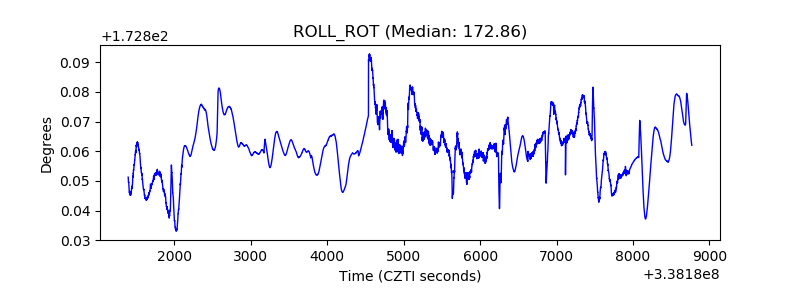 |
| _Roll_DEC |  |
| _Roll_RA | 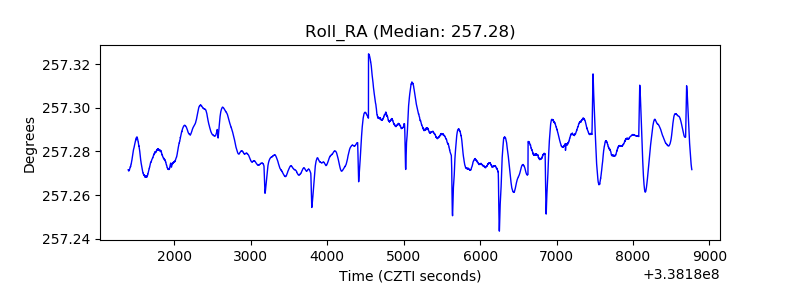 |
| Veto Counter | 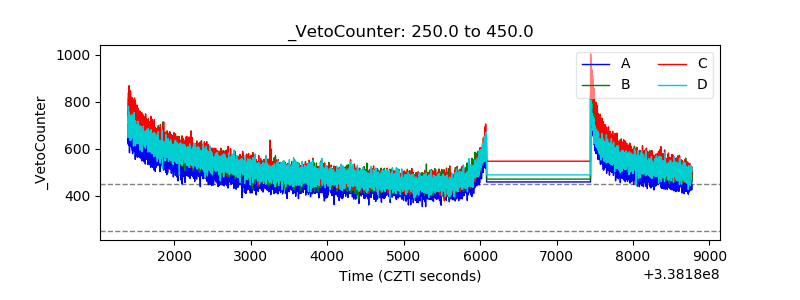 |