| Param | Original file | Final file |
|---|---|---|
| Filename | modeM0/AS1A09_044T01_9000003888_26911cztM0_level2.evt | modeM0/AS1A09_044T01_9000003888_26911cztM0_level2_quad_clean.evt |
| Size (bytes) | 301,029,120 | 29,165,760 |
| Size | 287.1 MB | 27.8 MB |
| Events in quadrant A | 1,587,339 | 180,054 |
| Events in quadrant B | 3,858,767 | 149,429 |
| Events in quadrant C | 1,473,221 | 182,185 |
| Events in quadrant D | 2,008,719 | 173,183 |
| Mode M0 | |||
|---|---|---|---|
| Quadrant | BADHDUFLAG | Total packets | Discarded packets |
| A | 0 | 6295 | 0 |
| B | 0 | 13379 | 0 |
| C | 0 | 5892 | 0 |
| D | 0 | 7803 | 0 |
| Mode M9 | |||
|---|---|---|---|
| Quadrant | BADHDUFLAG | Total packets | Discarded packets |
| A | 0 | 6 | 0 |
| B | 0 | 7 | 0 |
| C | 0 | 7 | 0 |
| D | 0 | 7 | 0 |
| Quadrant | Total seconds | Saturated seconds | Saturation percentage |
|---|---|---|---|
| A | 2757 | 36 | 1.305767% |
| B | 2757 | 820 | 29.742474% |
| C | 2757 | 36 | 1.305767% |
| D | 2757 | 74 | 2.684077% |
Noise dominated data is calculated using 1-second bins in cleaned event files. If a bin has >2000 counts, and if more than 50% of those come from <1% of pixels, then it is considered to be noise-dominated and hence unusable.
| Quadrant | # 1 sec bins | Bins with >0 counts | Bins with >2000 counts | High rate bins dominated by noise | Noise dominated (total time) | Noise dominated (detector-on time) | Marked lightcurve |
|---|---|---|---|---|---|---|---|
| A | 2757 | 2757 | 22 | 22 | 0.80% | 0.80% | 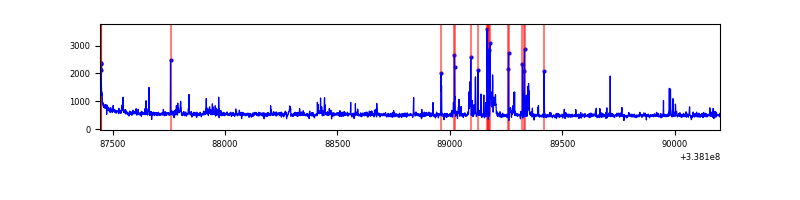 |
| B | 2756 | 2756 | 643 | 643 | 23.33% | 23.33% | 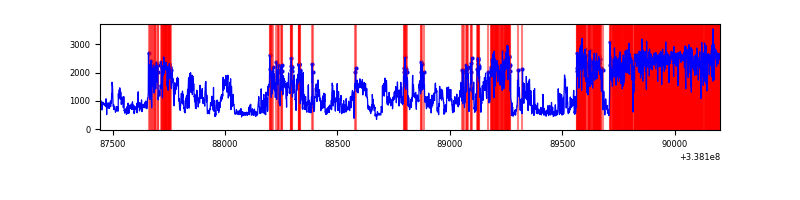 |
| C | 2757 | 2757 | 0 | 0 | 0.00% | 0.00% | 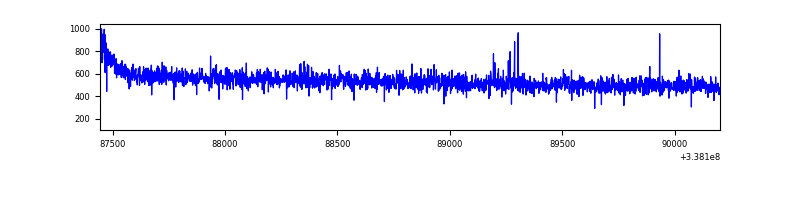 |
| D | 2757 | 2757 | 62 | 62 | 2.25% | 2.25% | 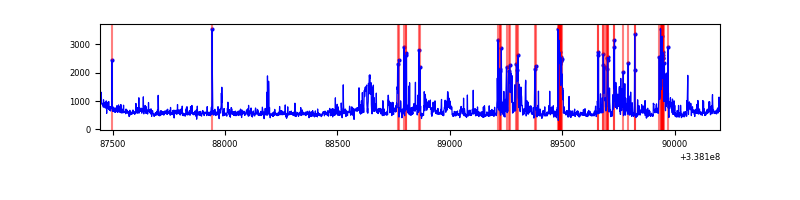 |
Top three noisy pixels from each quadrant. If the there are fewer than three noisy pixels in the level2.evt file, extra rows are filled as -1
| Pixel properties | Quadrant properties | ||||||
|---|---|---|---|---|---|---|---|
| Quadrant | DetID | PixID | Counts | Sigma | Mean | Median | Sigma |
| A | 0 | 13 | 164400 | 2255.43 | 364 | 357 | 72.7 |
| A | 8 | 192 | 14745 | 197.82 | 364 | 357 | 72.7 |
| A | 13 | 254 | 4136 | 51.96 | 364 | 357 | 72.7 |
| B | 0 | 189 | 2383948 | 37169.21 | 337 | 330 | 64.1 |
| B | 10 | 245 | 148199 | 2305.81 | 337 | 330 | 64.1 |
| B | 12 | 111 | 7326 | 109.09 | 337 | 330 | 64.1 |
| C | 14 | 238 | 60326 | 719.2 | 360 | 363 | 83.4 |
| C | 15 | 208 | 6020 | 67.85 | 360 | 363 | 83.4 |
| C | 13 | 61 | 2554 | 26.28 | 360 | 363 | 83.4 |
| D | 1 | 52 | 346827 | 4051.74 | 357 | 349 | 85.5 |
| D | 15 | 36 | 196039 | 2288.41 | 357 | 349 | 85.5 |
| D | 2 | 250 | 50497 | 586.43 | 357 | 349 | 85.5 |
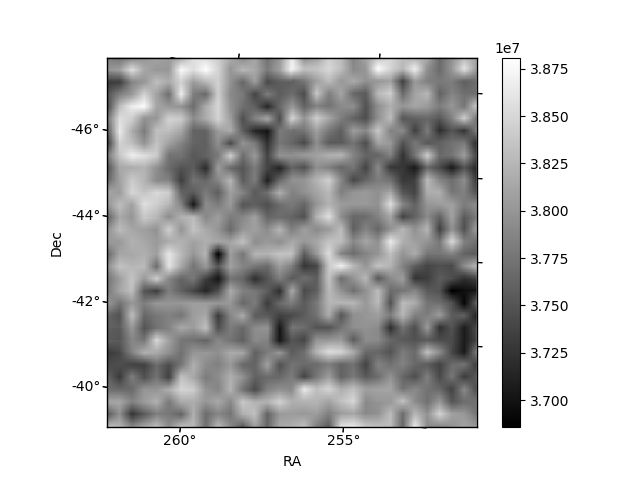
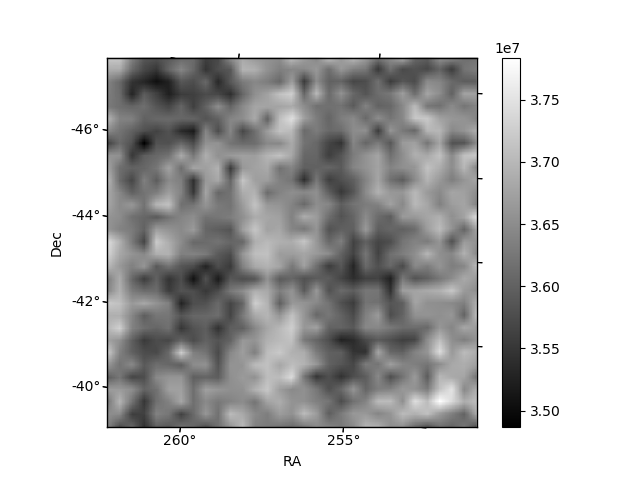
Histogram calculated using DETX and DETY for each event in the final _common_clean file
| Quadrant A | 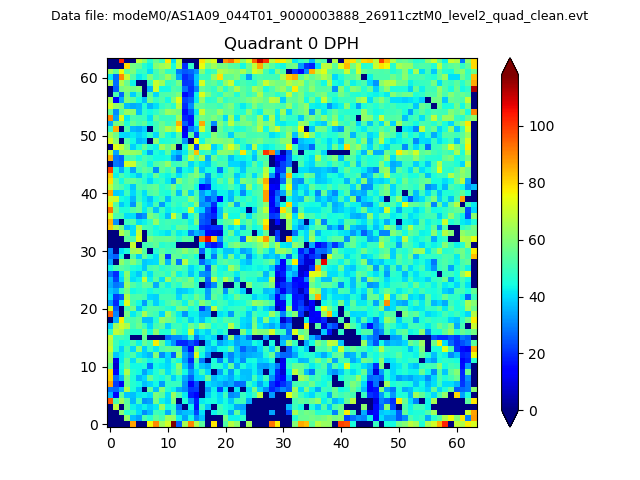 |
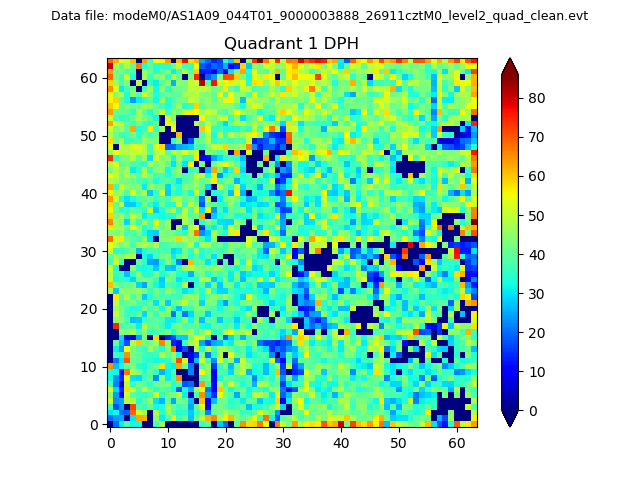 |
Quadrant B |
|---|---|---|---|
| Quadrant D |  |
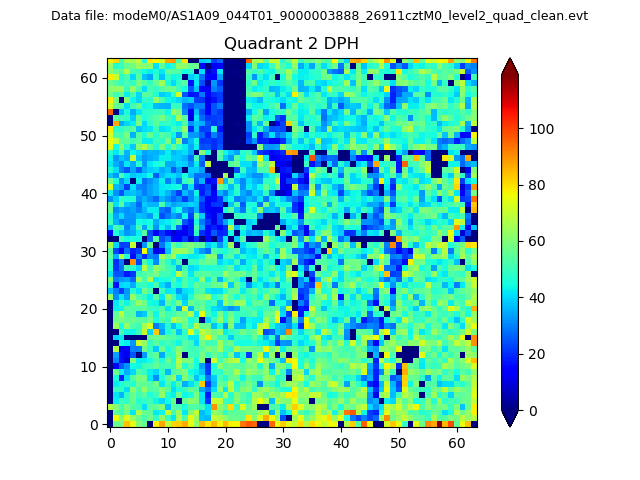 |
Quadrant C |
| Plot type | Count rate plots | Images |
|---|---|---|
| Comparison with Poisson distribution Blue bars denote a histogram of data divided into 1 sec bins. Red curve is a Poisson curve with rate = median count rate of data. |
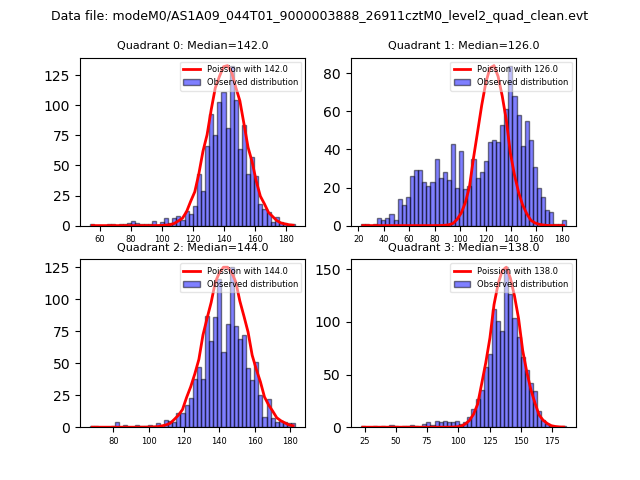 |
 |
| Quadrant-wise count rates Data is divided into 100 sec bins |
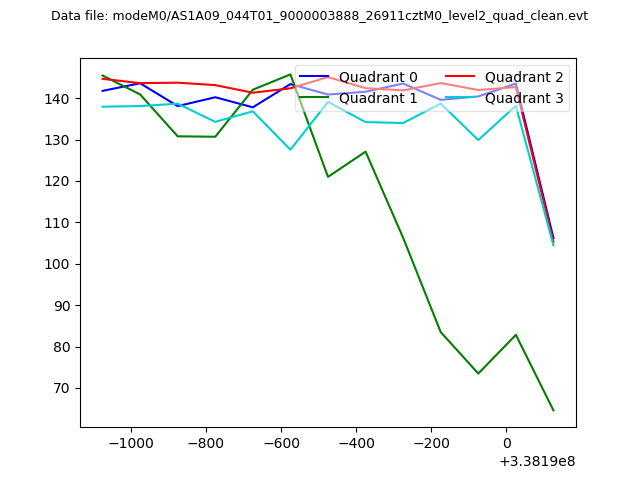 |
|
| Module-wise count rates for Quadrant A Data is divided into 100 sec bins |
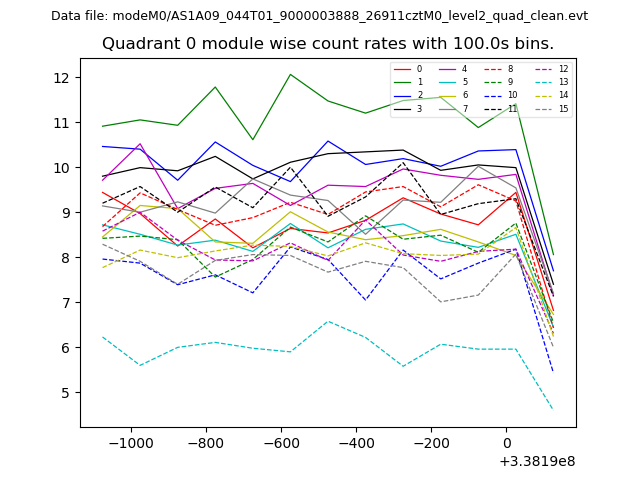 |
 |
| Module-wise count rates for Quadrant B Data is divided into 100 sec bins |
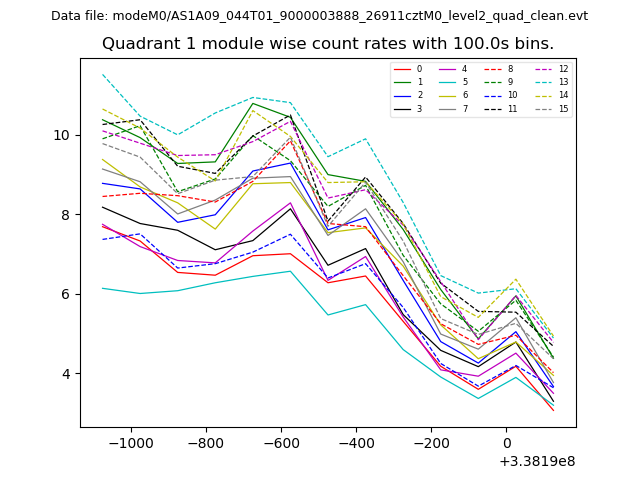 |
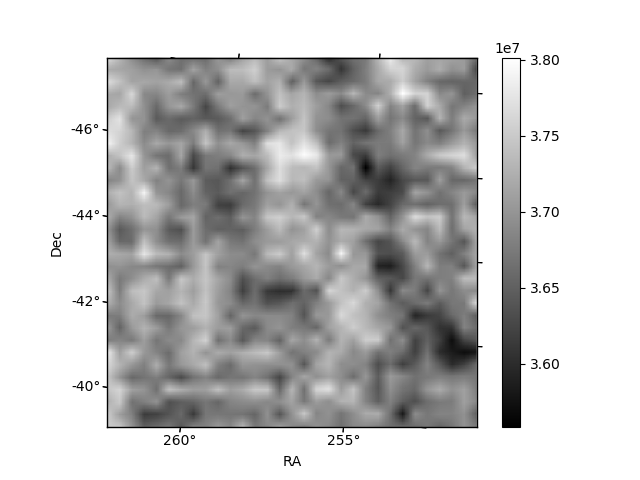 |
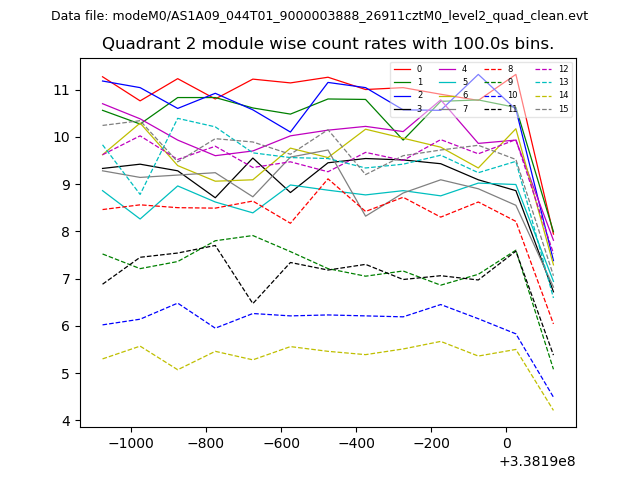
| Module-wise count rates for Quadrant C Data is divided into 100 sec bins |
 |
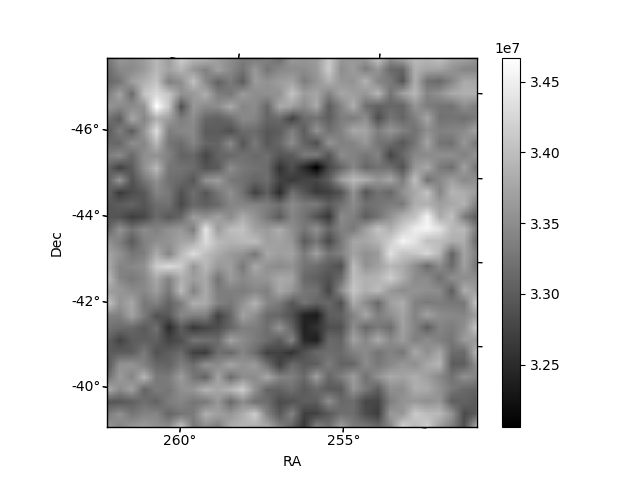 |
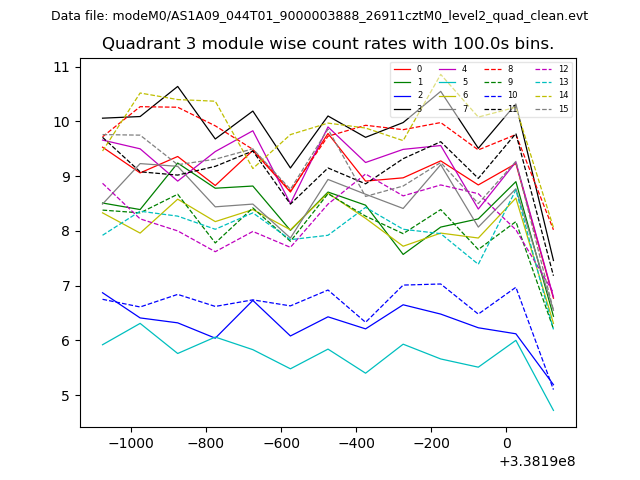
| Module-wise count rates for Quadrant D Data is divided into 100 sec bins |
 |
 |
| Parameter | Plot |
|---|---|
| CZT HV Monitor | 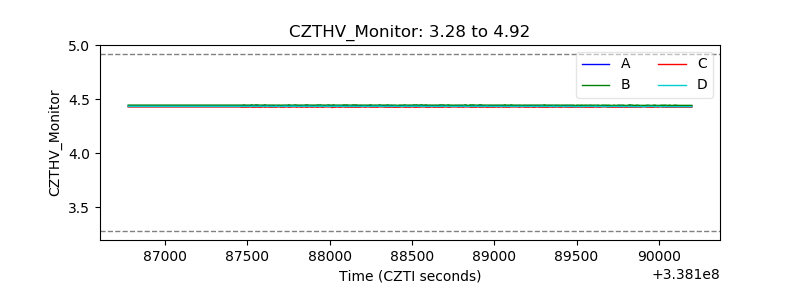 |
| D_VDD | 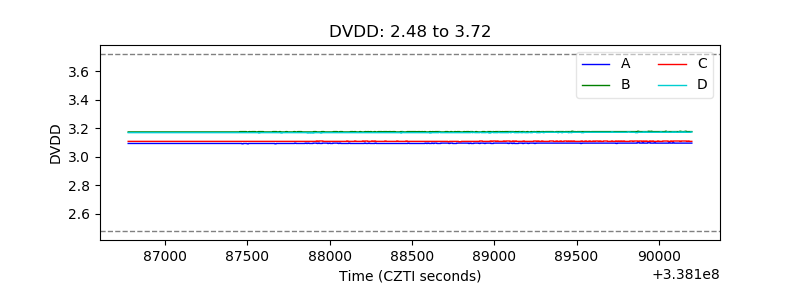 |
| Temperature 1 | 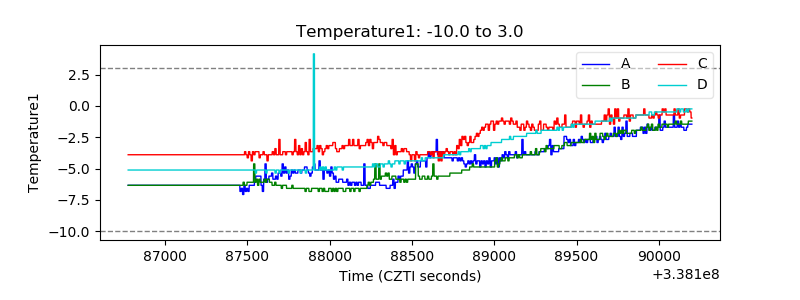 |
| Veto HV Monitor | 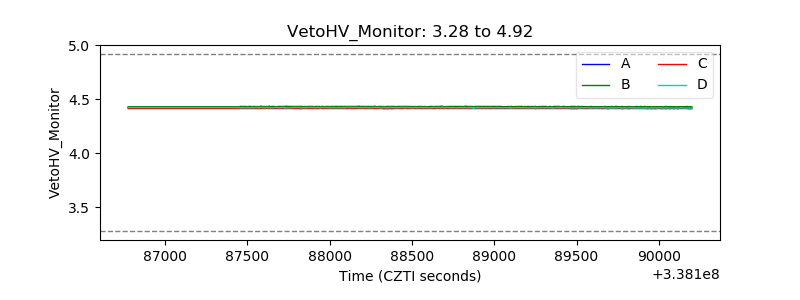 |
| Veto LLD | 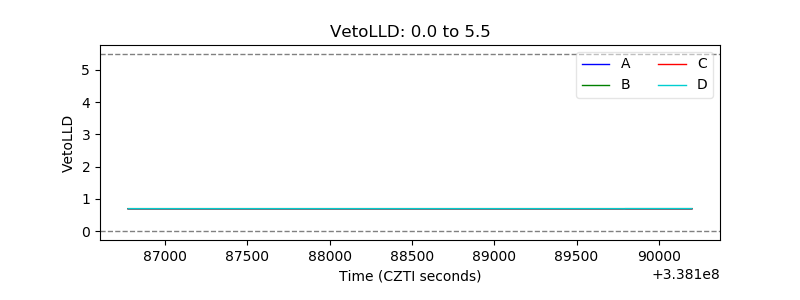 |
| Alpha Counter | 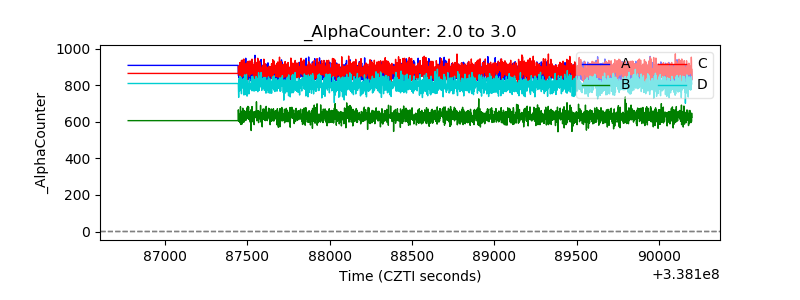 |
| _CPM_Rate | 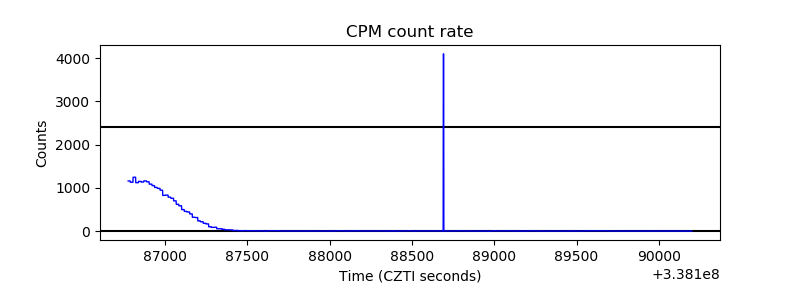 |
| CZT Counter |  |
| +2.5 Volts monitor |  |
| +5 Volts monitor |  |
| _ROLL_ROT | 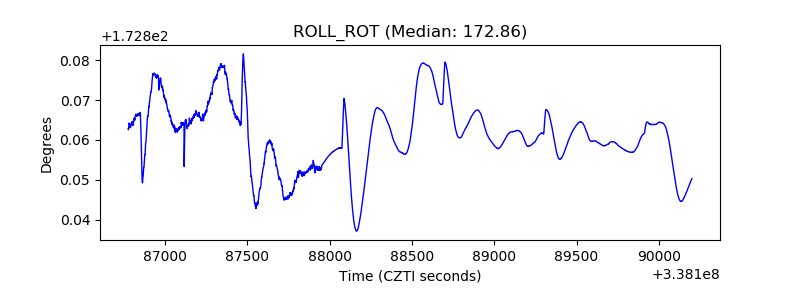 |
| _Roll_DEC |  |
| _Roll_RA | 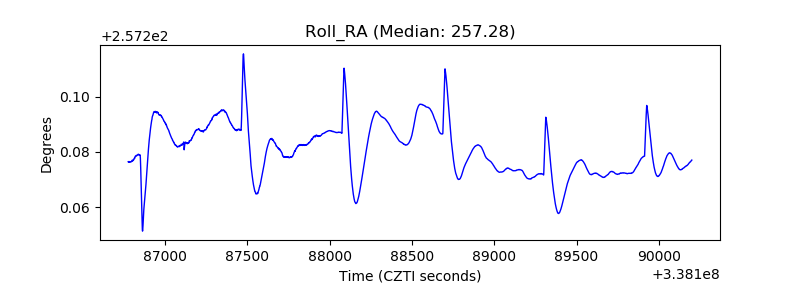 |
| Veto Counter | 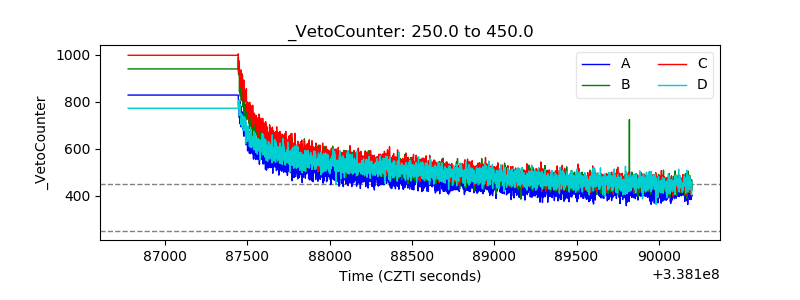 |