| Param | Original file | Final file |
|---|---|---|
| Filename | modeM0/AS1T03_232T01_9000003886cztM0_level2.fits | modeM0/AS1T03_232T01_9000003886cztM0_level2_quad_clean.evt |
| Size (bytes) | 91,569,600 | 109,926,720 |
| Size | 87.3 MB | 104.8 MB |
| Events in quadrant A | 546,736 | 681,222 |
| Events in quadrant B | 534,130 | 699,571 |
| Events in quadrant C | 547,314 | 670,670 |
| Events in quadrant D | 462,200 | 594,762 |
| Mode SS | |||
|---|---|---|---|
| Quadrant | BADHDUFLAG | Total packets | Discarded packets |
| A | 0 | 200 | 0 |
| B | 0 | 200 | 0 |
| C | 0 | 200 | 0 |
| D | 0 | 200 | 0 |
| Mode M9 | |||
|---|---|---|---|
| Quadrant | BADHDUFLAG | Total packets | Discarded packets |
| A | 0 | 3 | 0 |
| B | 0 | 3 | 0 |
| C | 0 | 3 | 0 |
| D | 0 | 3 | 0 |
| Mode M0 | |||
|---|---|---|---|
| Quadrant | BADHDUFLAG | Total packets | Discarded packets |
| A | 0 | 26339 | 0 |
| B | 0 | 22039 | 0 |
| C | 0 | 20271 | 0 |
| D | 0 | 31257 | 0 |
| Quadrant | Total seconds | Saturated seconds | Saturation percentage |
|---|---|---|---|
| A | 9842 | 338 | 3.434261% |
| B | 9842 | 221 | 2.245479% |
| C | 9842 | 174 | 1.767933% |
| D | 9842 | 746 | 7.579760% |
Noise dominated data is calculated using 1-second bins in cleaned event files. If a bin has >2000 counts, and if more than 50% of those come from <1% of pixels, then it is considered to be noise-dominated and hence unusable.
| Quadrant | # 1 sec bins | Bins with >0 counts | Bins with >2000 counts | High rate bins dominated by noise | Noise dominated (total time) | Noise dominated (detector-on time) | Marked lightcurve |
|---|---|---|---|---|---|---|---|
| A | 10152 | 9841 | 0 | 0 | 0.00% | 0.00% |  |
| B | 10152 | 9836 | 0 | 0 | 0.00% | 0.00% |  |
| C | 10152 | 9841 | 0 | 0 | 0.00% | 0.00% |  |
| D | 10152 | 9837 | 0 | 0 | 0.00% | 0.00% |  |
Top three noisy pixels from each quadrant. If the there are fewer than three noisy pixels in the level2.evt file, extra rows are filled as -1
| Pixel properties | Quadrant properties | ||||||
|---|---|---|---|---|---|---|---|
| Quadrant | DetID | PixID | Counts | Sigma | Mean | Median | Sigma |
| A | 0 | 29 | 470 | 8.73 | 142 | 134 | 38.5 |
| A | 14 | 79 | 426 | 7.58 | 142 | 134 | 38.5 |
| A | 7 | 110 | 413 | 7.25 | 142 | 134 | 38.5 |
| B | 2 | 9 | 445 | 10.42 | 141 | 135 | 29.8 |
| B | 3 | 17 | 363 | 7.66 | 141 | 135 | 29.8 |
| B | 2 | 8 | 355 | 7.39 | 141 | 135 | 29.8 |
| C | 12 | 241 | 408 | 7.08 | 144 | 135 | 38.6 |
| C | 2 | 191 | 393 | 6.69 | 144 | 135 | 38.6 |
| C | 3 | 126 | 386 | 6.51 | 144 | 135 | 38.6 |
| D | 7 | 3 | 336 | 5.84 | 132 | 120 | 37.0 |
| D | 1 | 31 | 335 | 5.81 | 132 | 120 | 37.0 |
| D | 6 | 231 | 334 | 5.78 | 132 | 120 | 37.0 |
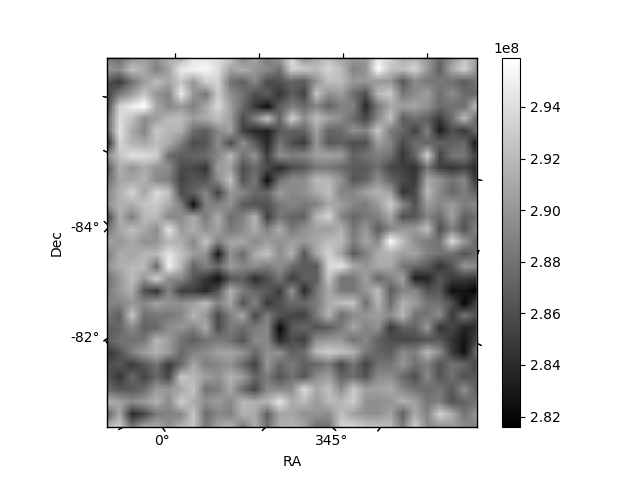
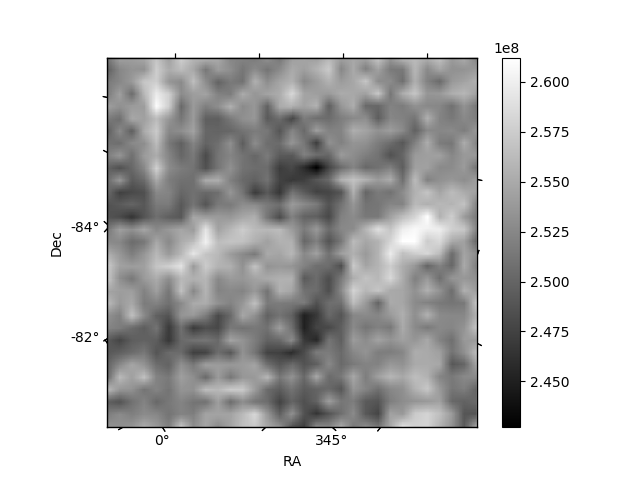
Histogram calculated using DETX and DETY for each event in the final _common_clean file
| Quadrant A |  |
 |
Quadrant B |
|---|---|---|---|
| Quadrant D |  |
 |
Quadrant C |
| Plot type | Count rate plots | Images |
|---|---|---|
| Comparison with Poisson distribution Blue bars denote a histogram of data divided into 1 sec bins. Red curve is a Poisson curve with rate = median count rate of data. |
 |
 |
| Quadrant-wise count rates Data is divided into 100 sec bins |
 |
|
| Module-wise count rates for Quadrant A Data is divided into 100 sec bins |
 |
 |
| Module-wise count rates for Quadrant B Data is divided into 100 sec bins |
 |
 |
| Module-wise count rates for Quadrant C Data is divided into 100 sec bins |
 |
 |
| Module-wise count rates for Quadrant D Data is divided into 100 sec bins |
 |
 |
| Parameter | Plot |
|---|---|
| CZT HV Monitor |  |
| D_VDD |  |
| Temperature 1 |  |
| Veto HV Monitor |  |
| Veto LLD |  |
| Alpha Counter |  |
| _CPM_Rate |  |
| CZT Counter |  |
| +2.5 Volts monitor |  |
| +5 Volts monitor |  |
| _ROLL_ROT |  |
| _Roll_DEC |  |
| _Roll_RA |  |
| Veto Counter |  |