| Param | Original file | Final file |
|---|---|---|
| Filename | modeM0/AS1T03_232T01_9000003886_26902cztM0_level2.evt | modeM0/AS1T03_232T01_9000003886_26902cztM0_level2_quad_clean.evt |
| Size (bytes) | 730,751,040 | 155,972,160 |
| Size | 696.9 MB | 148.7 MB |
| Events in quadrant A | 5,930,259 | 1,036,028 |
| Events in quadrant B | 4,554,315 | 1,068,646 |
| Events in quadrant C | 3,882,045 | 1,046,073 |
| Events in quadrant D | 7,193,794 | 987,137 |
| Mode M9 | |||
|---|---|---|---|
| Quadrant | BADHDUFLAG | Total packets | Discarded packets |
| A | 0 | 3 | 0 |
| B | 0 | 3 | 0 |
| C | 0 | 3 | 0 |
| D | 0 | 3 | 0 |
| Mode M0 | |||
|---|---|---|---|
| Quadrant | BADHDUFLAG | Total packets | Discarded packets |
| A | 0 | 23474 | 0 |
| B | 0 | 19146 | 0 |
| C | 0 | 17291 | 0 |
| D | 0 | 27160 | 0 |
| Quadrant | Total seconds | Saturated seconds | Saturation percentage |
|---|---|---|---|
| A | 8438 | 333 | 3.946433% |
| B | 8438 | 218 | 2.583551% |
| C | 8438 | 143 | 1.694714% |
| D | 8438 | 707 | 8.378763% |
Noise dominated data is calculated using 1-second bins in cleaned event files. If a bin has >2000 counts, and if more than 50% of those come from <1% of pixels, then it is considered to be noise-dominated and hence unusable.
| Quadrant | # 1 sec bins | Bins with >0 counts | Bins with >2000 counts | High rate bins dominated by noise | Noise dominated (total time) | Noise dominated (detector-on time) | Marked lightcurve |
|---|---|---|---|---|---|---|---|
| A | 8748 | 8439 | 152 | 152 | 1.74% | 1.80% | 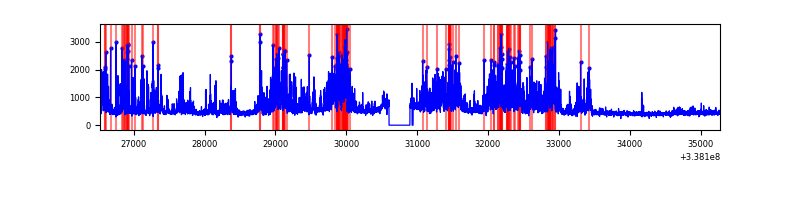 |
| B | 8748 | 8438 | 64 | 64 | 0.73% | 0.76% | 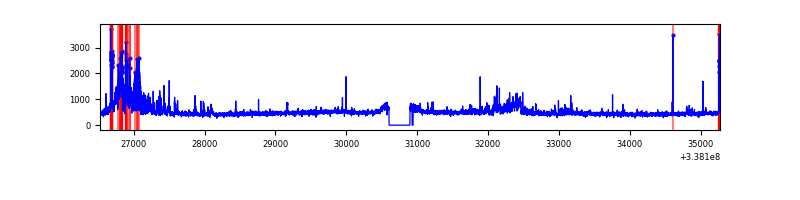 |
| C | 8748 | 8440 | 1 | 1 | 0.01% | 0.01% | 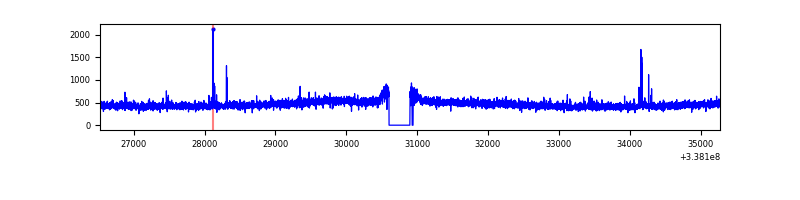 |
| D | 8748 | 8438 | 569 | 569 | 6.50% | 6.74% | 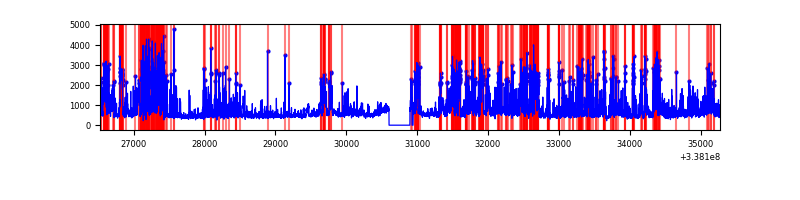 |
Top three noisy pixels from each quadrant. If the there are fewer than three noisy pixels in the level2.evt file, extra rows are filled as -1
| Pixel properties | Quadrant properties | ||||||
|---|---|---|---|---|---|---|---|
| Quadrant | DetID | PixID | Counts | Sigma | Mean | Median | Sigma |
| A | 0 | 13 | 1967233 | 10102.12 | 967 | 945 | 194.6 |
| A | 6 | 16 | 139586 | 712.29 | 967 | 945 | 194.6 |
| A | 5 | 168 | 88914 | 451.95 | 967 | 945 | 194.6 |
| B | 0 | 190 | 276723 | 1505.96 | 971 | 945 | 183.1 |
| B | 3 | 64 | 231492 | 1258.96 | 971 | 945 | 183.1 |
| B | 15 | 33 | 154521 | 838.64 | 971 | 945 | 183.1 |
| C | 14 | 238 | 152597 | 691.89 | 940 | 946 | 219.2 |
| C | 15 | 208 | 37716 | 167.76 | 940 | 946 | 219.2 |
| C | 8 | 128 | 13526 | 57.39 | 940 | 946 | 219.2 |
| D | 1 | 52 | 2555683 | 10930.6 | 913 | 889 | 233.7 |
| D | 11 | 176 | 524936 | 2242.12 | 913 | 889 | 233.7 |
| D | 7 | 80 | 276899 | 1180.9 | 913 | 889 | 233.7 |
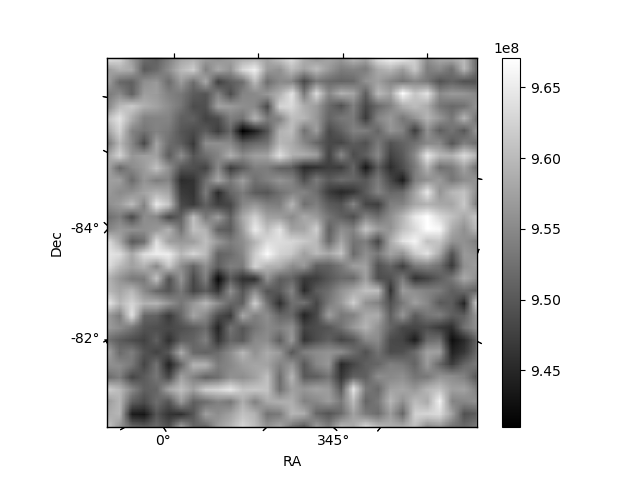
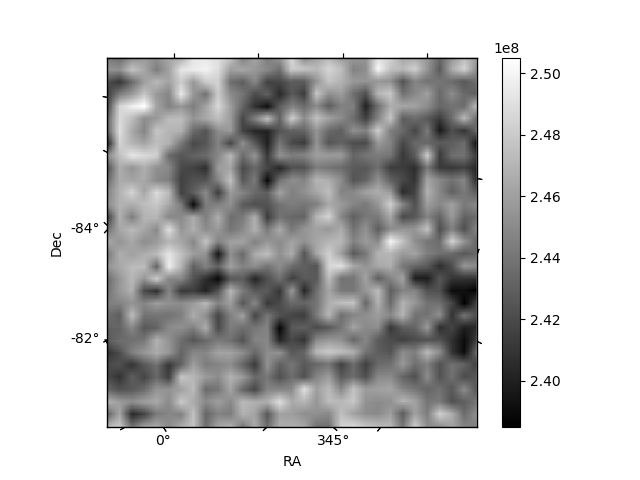
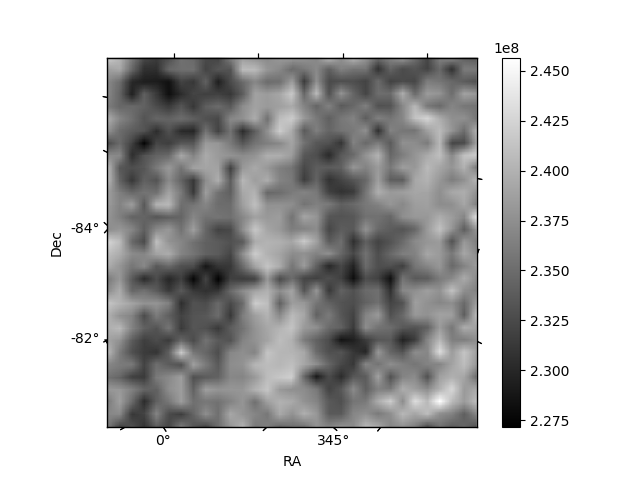
Histogram calculated using DETX and DETY for each event in the final _common_clean file
| Quadrant A | 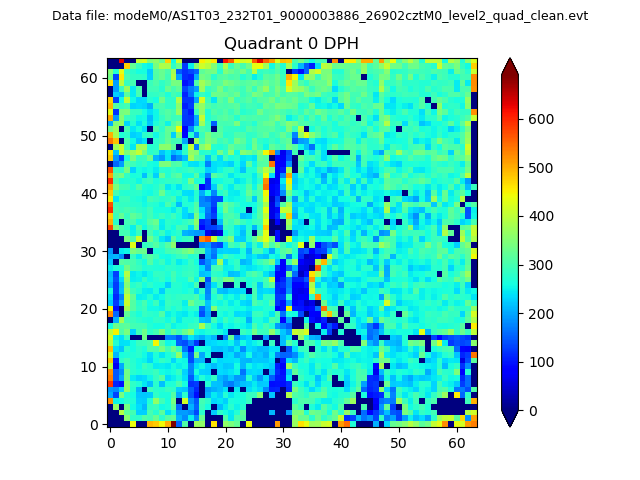 |
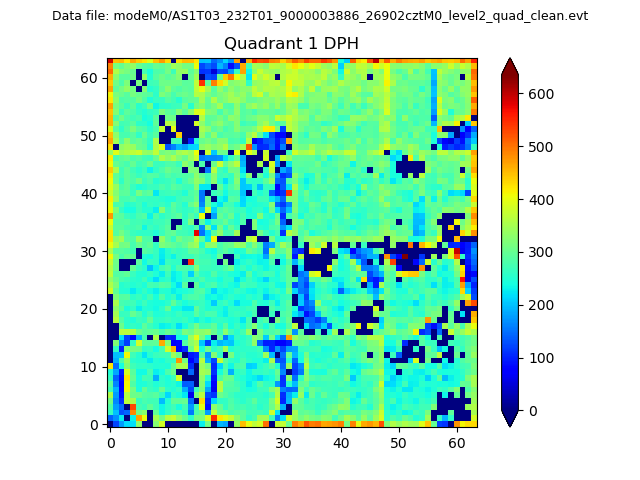 |
Quadrant B |
|---|---|---|---|
| Quadrant D |  |
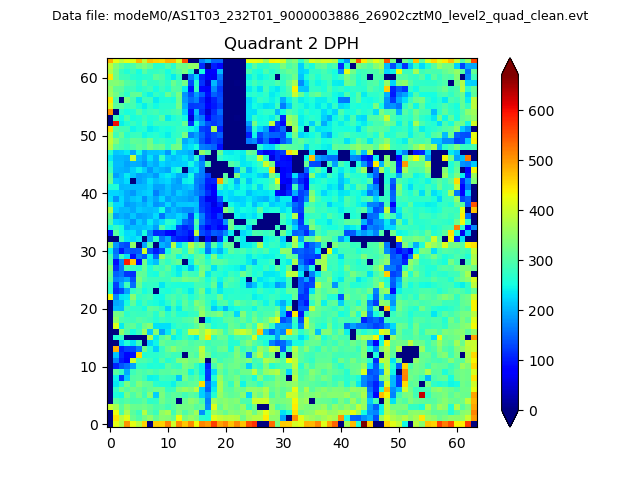 |
Quadrant C |
| Plot type | Count rate plots | Images |
|---|---|---|
| Comparison with Poisson distribution Blue bars denote a histogram of data divided into 1 sec bins. Red curve is a Poisson curve with rate = median count rate of data. |
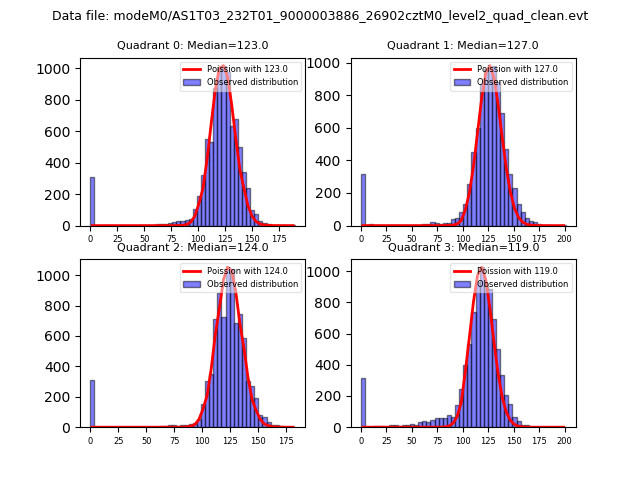 |
 |
| Quadrant-wise count rates Data is divided into 100 sec bins |
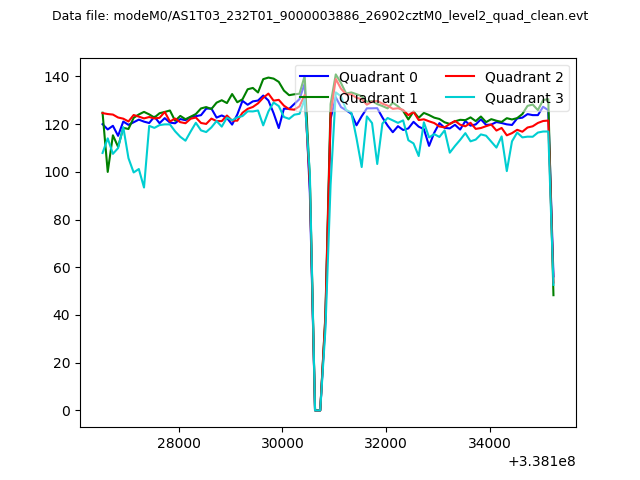 |
|
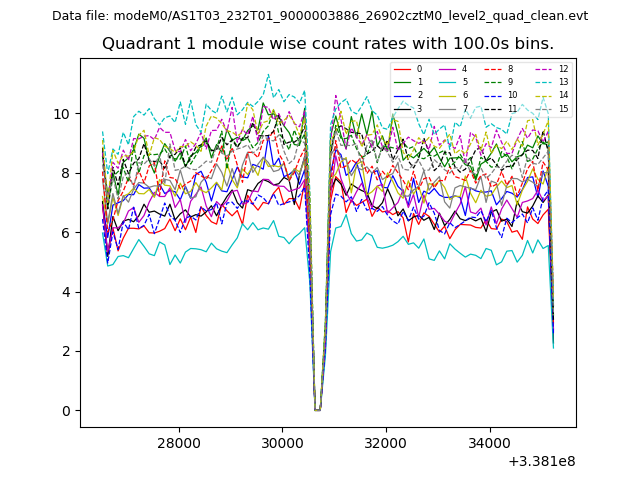
| Module-wise count rates for Quadrant A Data is divided into 100 sec bins |
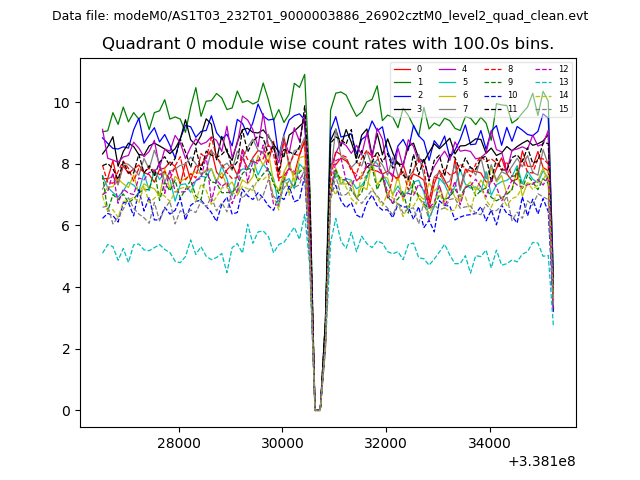 |
 |
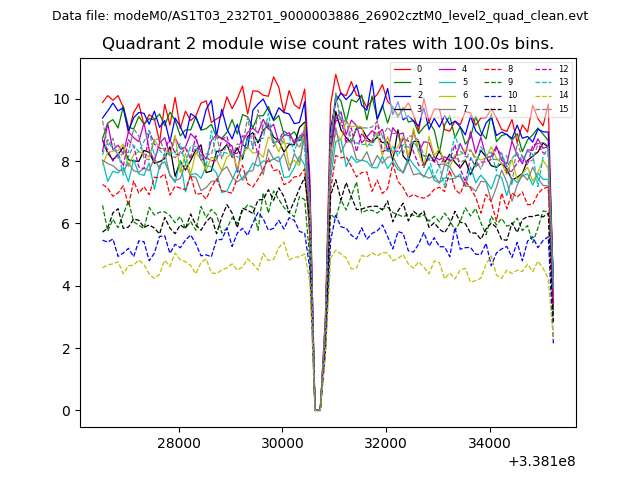
| Module-wise count rates for Quadrant B Data is divided into 100 sec bins |
 |
 |
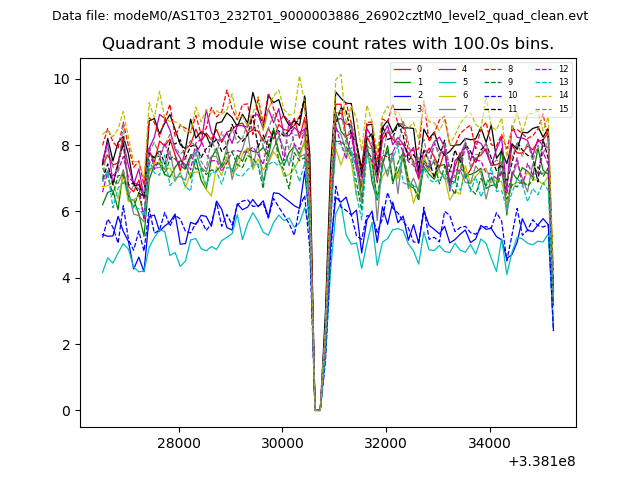
| Module-wise count rates for Quadrant C Data is divided into 100 sec bins |
 |
 |
| Module-wise count rates for Quadrant D Data is divided into 100 sec bins |
 |
 |
| Parameter | Plot |
|---|---|
| CZT HV Monitor | 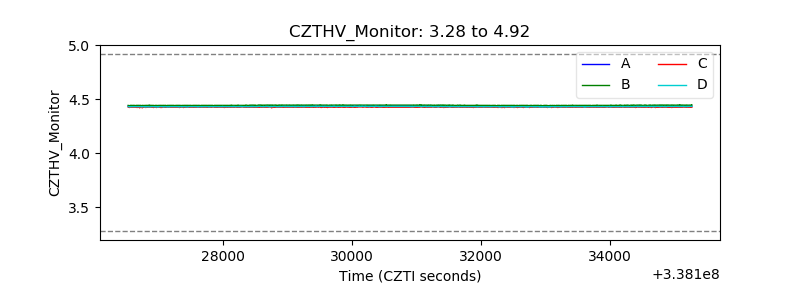 |
| D_VDD | 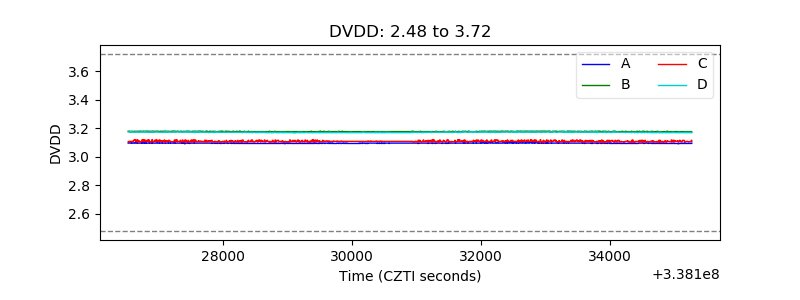 |
| Temperature 1 | 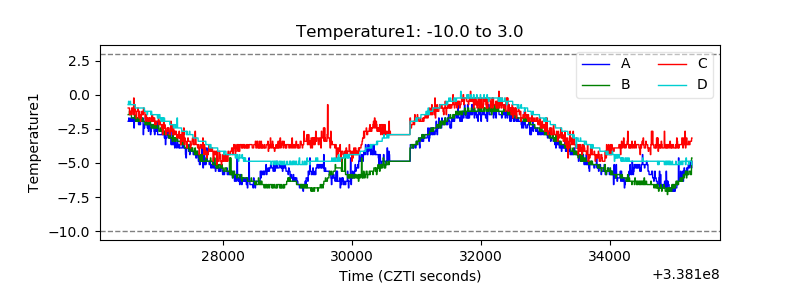 |
| Veto HV Monitor | 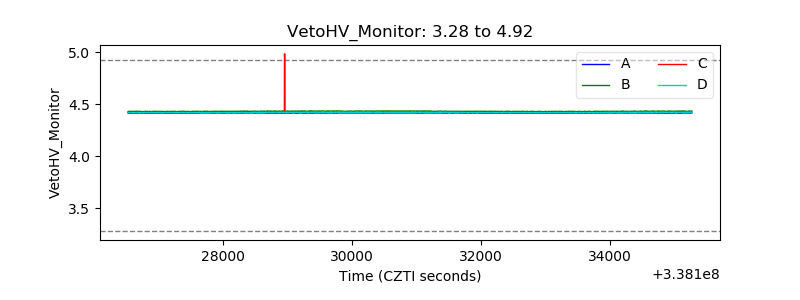 |
| Veto LLD | 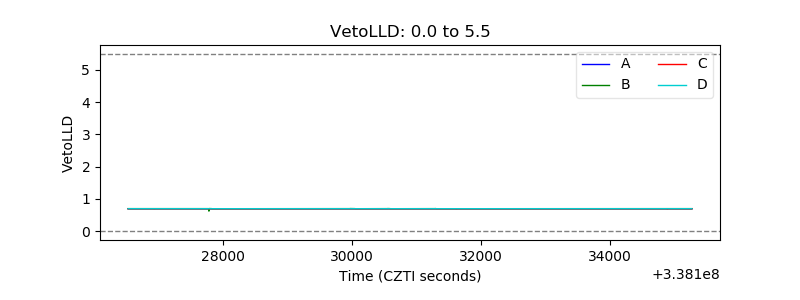 |
| Alpha Counter | 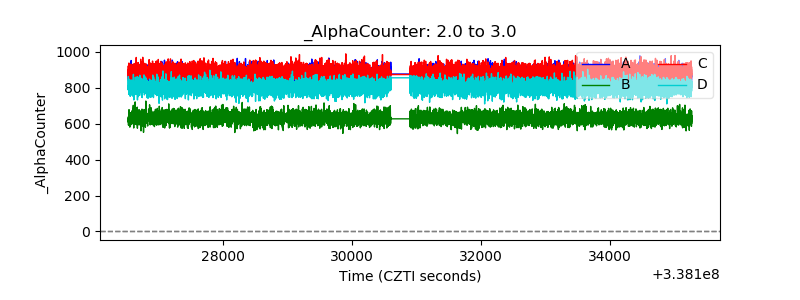 |
| _CPM_Rate | 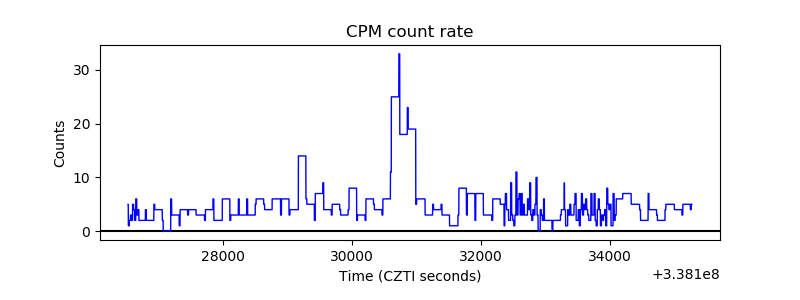 |
| CZT Counter |  |
| +2.5 Volts monitor |  |
| +5 Volts monitor |  |
| _ROLL_ROT | 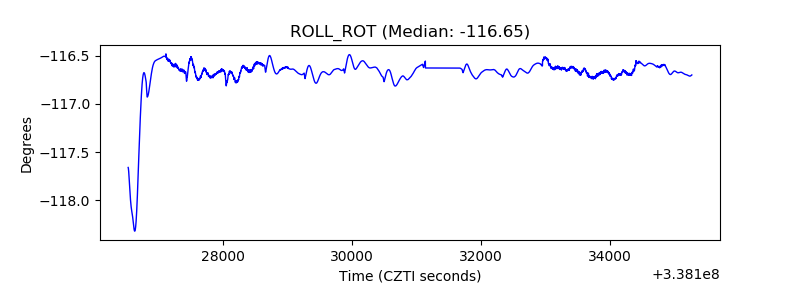 |
| _Roll_DEC | 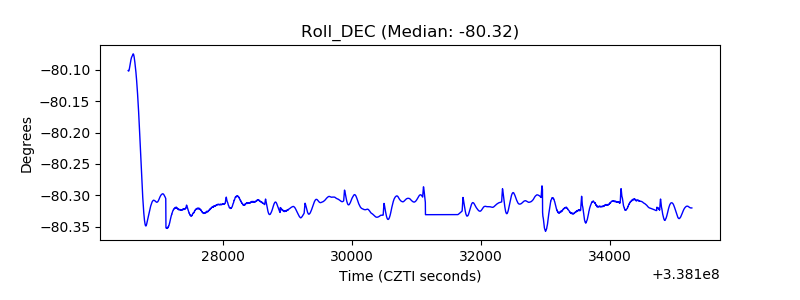 |
| _Roll_RA | 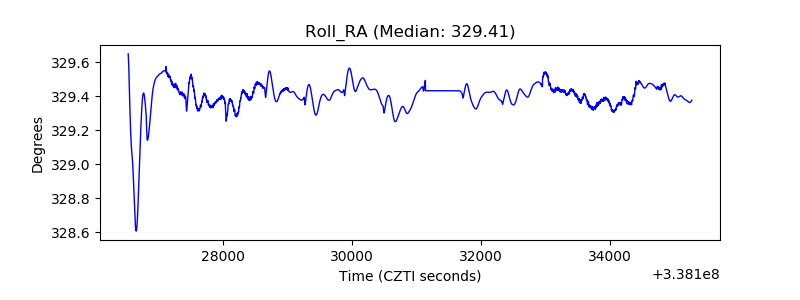 |
| Veto Counter | 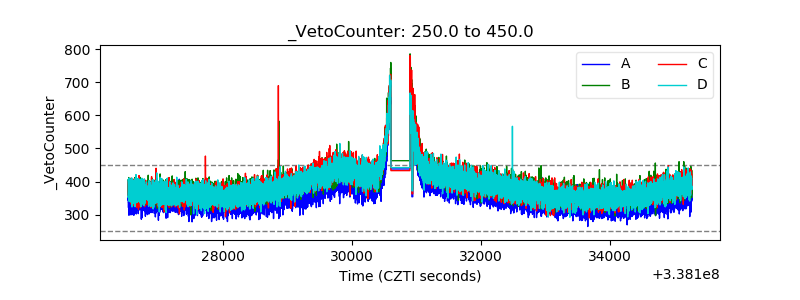 |