| Param | Original file | Final file |
|---|---|---|
| Filename | modeM0/AS1T03_232T01_9000003886_26903cztM0_level2.evt | modeM0/AS1T03_232T01_9000003886_26903cztM0_level2_quad_clean.evt |
| Size (bytes) | 201,628,800 | 50,437,440 |
| Size | 192.3 MB | 48.1 MB |
| Events in quadrant A | 1,238,416 | 339,414 |
| Events in quadrant B | 1,294,284 | 347,038 |
| Events in quadrant C | 1,305,244 | 330,977 |
| Events in quadrant D | 2,085,422 | 318,966 |
| Mode M0 | |||
|---|---|---|---|
| Quadrant | BADHDUFLAG | Total packets | Discarded packets |
| A | 0 | 5400 | 0 |
| B | 0 | 5516 | 0 |
| C | 0 | 5545 | 0 |
| D | 0 | 8035 | 0 |
| Quadrant | Total seconds | Saturated seconds | Saturation percentage |
|---|---|---|---|
| A | 2660 | 5 | 0.187970% |
| B | 2660 | 17 | 0.639098% |
| C | 2661 | 34 | 1.277715% |
| D | 2661 | 95 | 3.570086% |
Noise dominated data is calculated using 1-second bins in cleaned event files. If a bin has >2000 counts, and if more than 50% of those come from <1% of pixels, then it is considered to be noise-dominated and hence unusable.
| Quadrant | # 1 sec bins | Bins with >0 counts | Bins with >2000 counts | High rate bins dominated by noise | Noise dominated (total time) | Noise dominated (detector-on time) | Marked lightcurve |
|---|---|---|---|---|---|---|---|
| A | 2660 | 2660 | 0 | 0 | 0.00% | 0.00% | 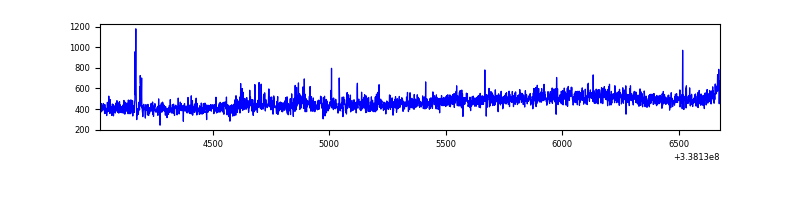 |
| B | 2660 | 2660 | 11 | 11 | 0.41% | 0.41% | 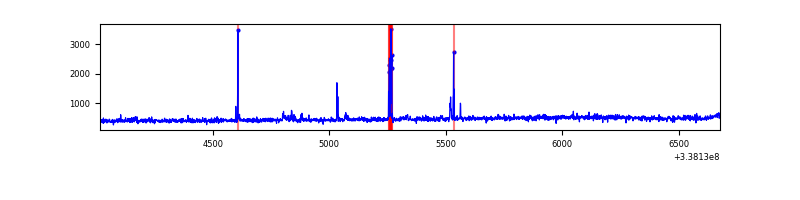 |
| C | 2661 | 2661 | 1 | 1 | 0.04% | 0.04% | 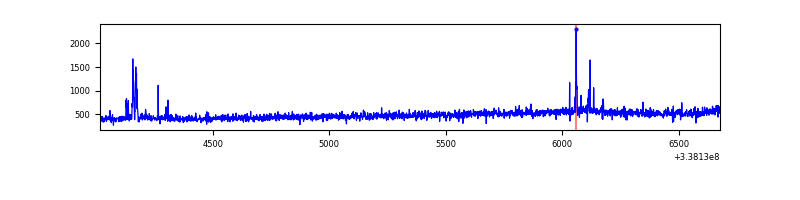 |
| D | 2661 | 2661 | 73 | 73 | 2.74% | 2.74% | 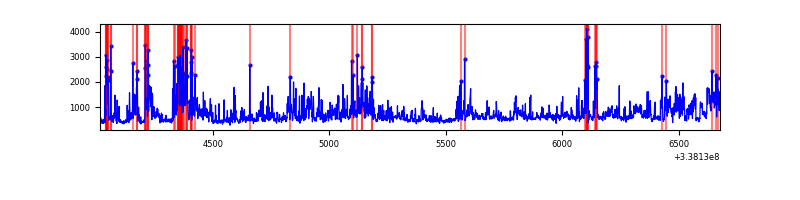 |
Top three noisy pixels from each quadrant. If the there are fewer than three noisy pixels in the level2.evt file, extra rows are filled as -1
| Pixel properties | Quadrant properties | ||||||
|---|---|---|---|---|---|---|---|
| Quadrant | DetID | PixID | Counts | Sigma | Mean | Median | Sigma |
| A | 0 | 13 | 18266 | 279.47 | 312 | 305 | 64.3 |
| A | 5 | 168 | 11361 | 172.03 | 312 | 305 | 64.3 |
| A | 13 | 254 | 3700 | 52.83 | 312 | 305 | 64.3 |
| B | 3 | 64 | 51442 | 826.84 | 315 | 306 | 61.8 |
| B | 12 | 111 | 7388 | 114.51 | 315 | 306 | 61.8 |
| B | 11 | 111 | 6596 | 101.71 | 315 | 306 | 61.8 |
| C | 14 | 238 | 50219 | 666.95 | 311 | 312 | 74.8 |
| C | 15 | 208 | 34359 | 455.0 | 311 | 312 | 74.8 |
| C | 8 | 128 | 5485 | 69.13 | 311 | 312 | 74.8 |
| D | 1 | 52 | 495011 | 6120.56 | 303 | 296 | 80.8 |
| D | 7 | 80 | 250189 | 3091.65 | 303 | 296 | 80.8 |
| D | 11 | 176 | 121727 | 1502.33 | 303 | 296 | 80.8 |
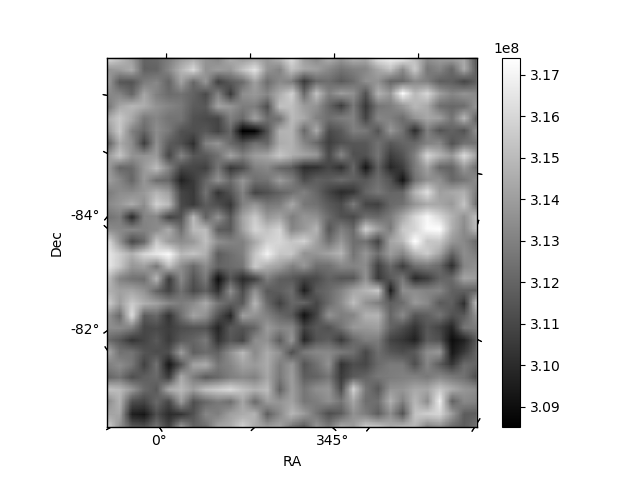
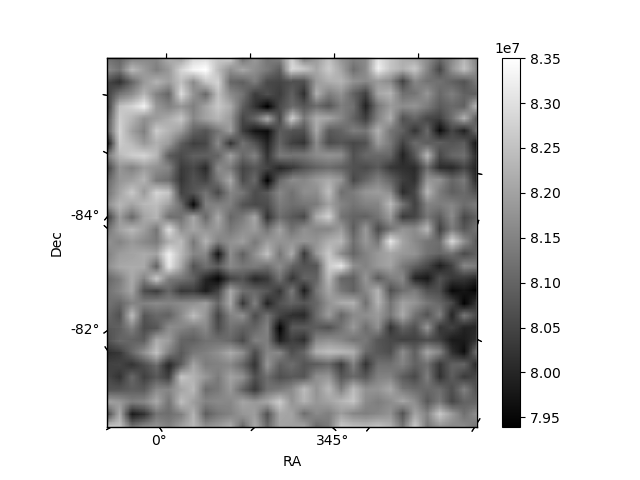
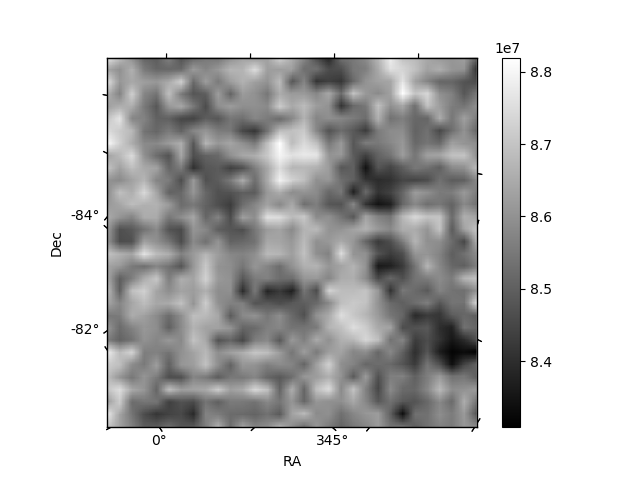
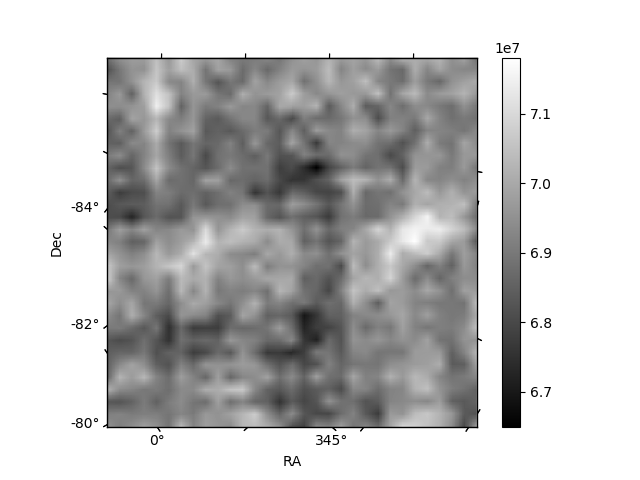
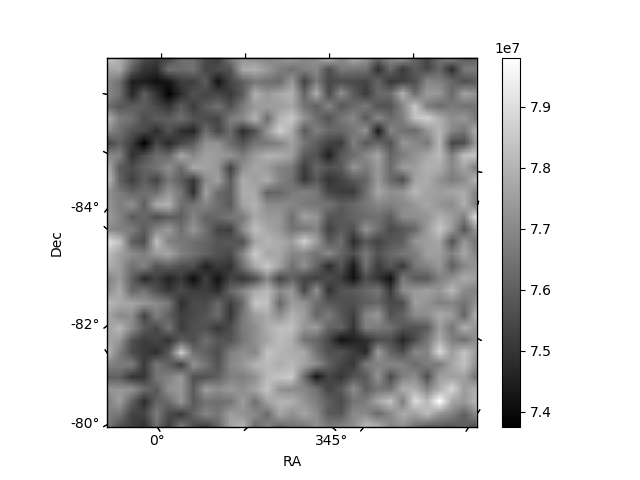
Histogram calculated using DETX and DETY for each event in the final _common_clean file
| Quadrant A | 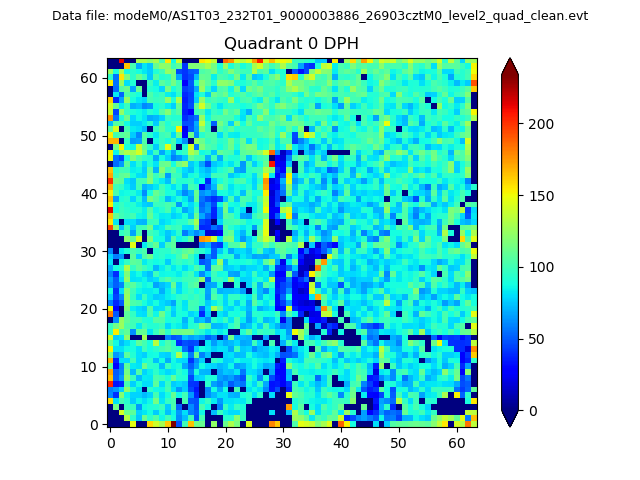 |
 |
Quadrant B |
|---|---|---|---|
| Quadrant D | 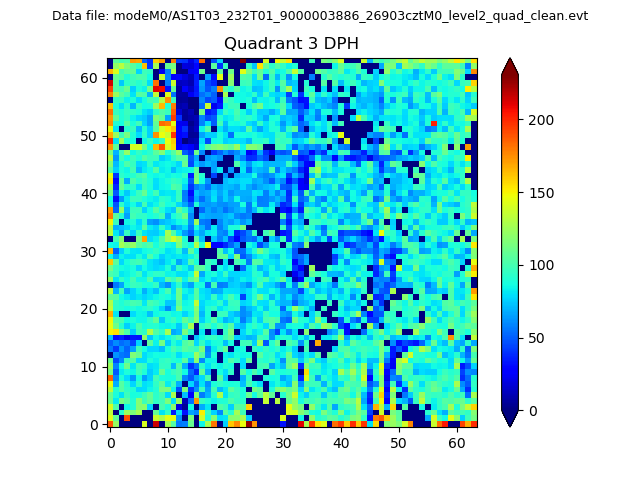 |
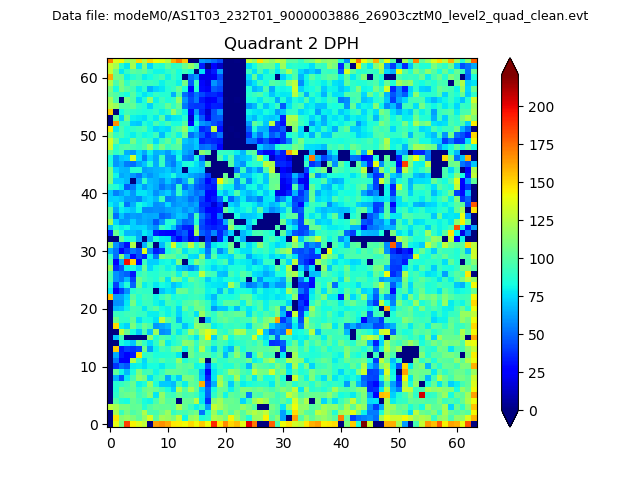 |
Quadrant C |
| Plot type | Count rate plots | Images |
|---|---|---|
| Comparison with Poisson distribution Blue bars denote a histogram of data divided into 1 sec bins. Red curve is a Poisson curve with rate = median count rate of data. |
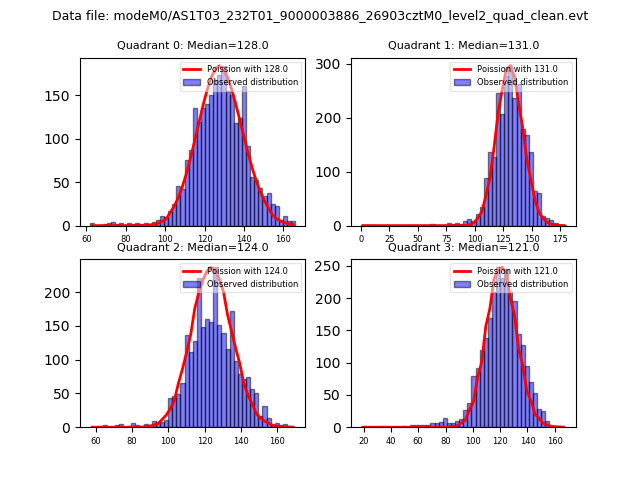 |
 |
| Quadrant-wise count rates Data is divided into 100 sec bins |
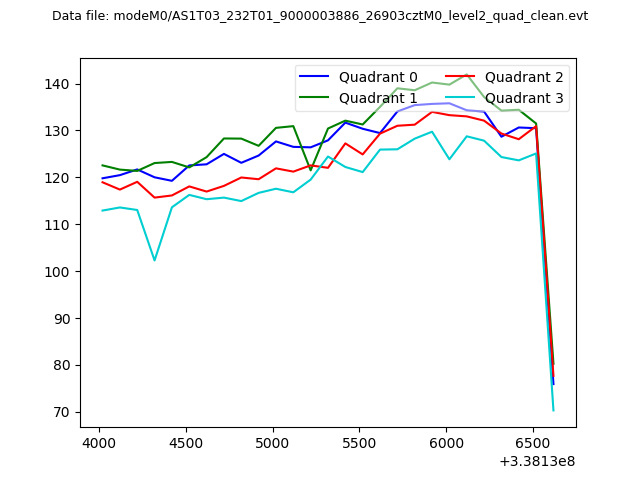 |
|
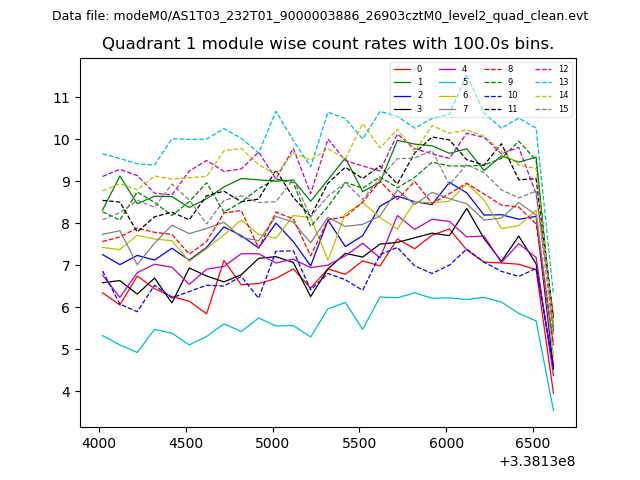
| Module-wise count rates for Quadrant A Data is divided into 100 sec bins |
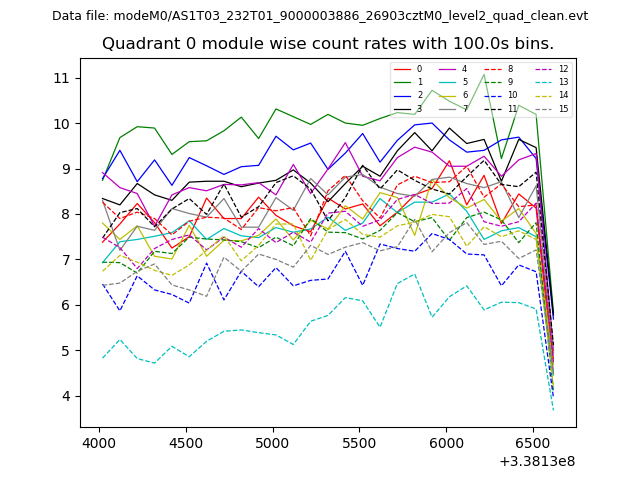 |
 |
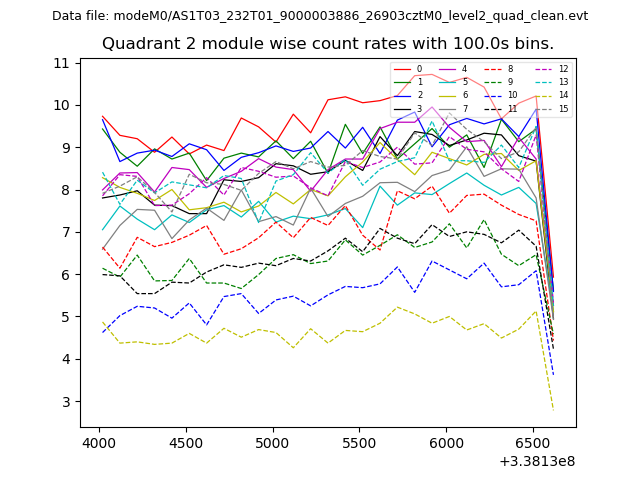
| Module-wise count rates for Quadrant B Data is divided into 100 sec bins |
 |
 |
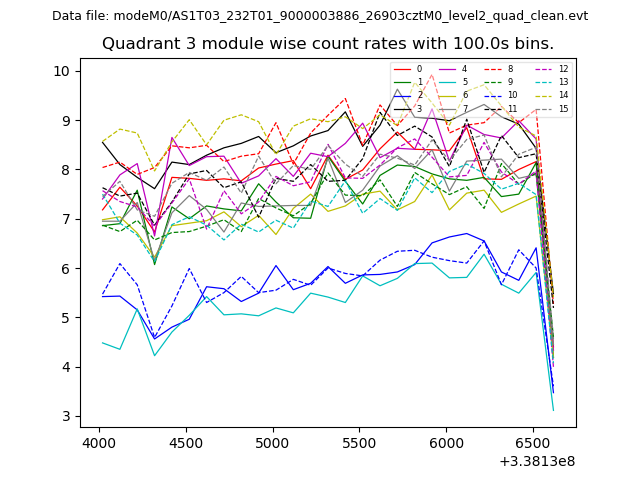
| Module-wise count rates for Quadrant C Data is divided into 100 sec bins |
 |
 |
| Module-wise count rates for Quadrant D Data is divided into 100 sec bins |
 |
 |
| Parameter | Plot |
|---|---|
| CZT HV Monitor | 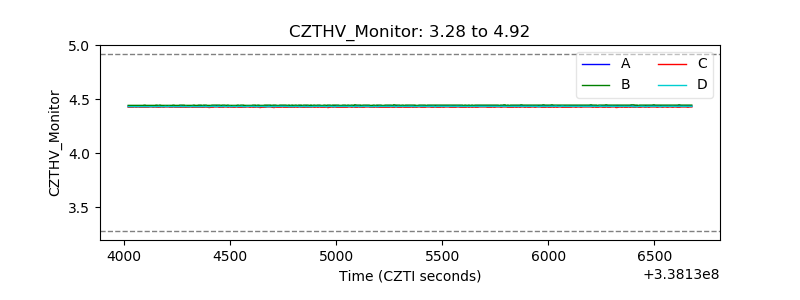 |
| D_VDD | 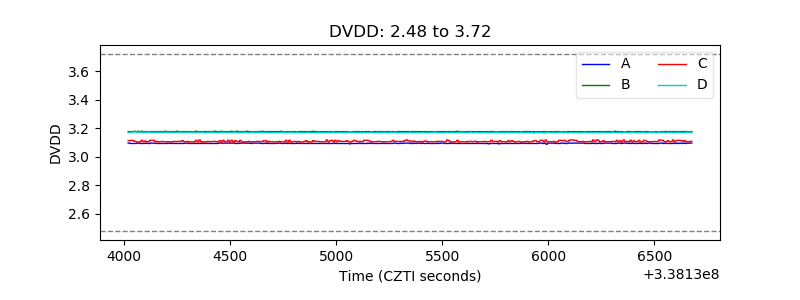 |
| Temperature 1 | 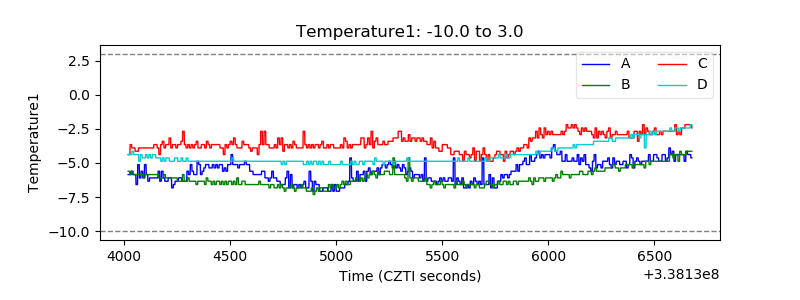 |
| Veto HV Monitor | 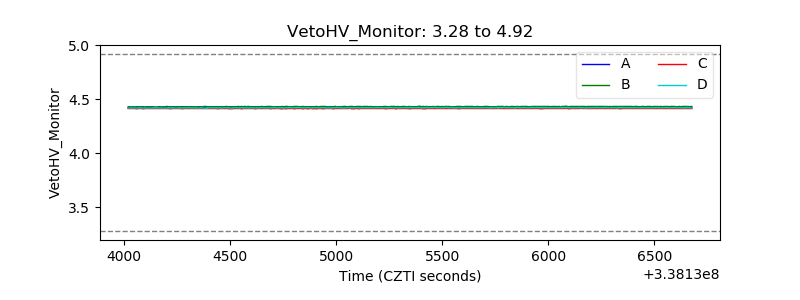 |
| Veto LLD | 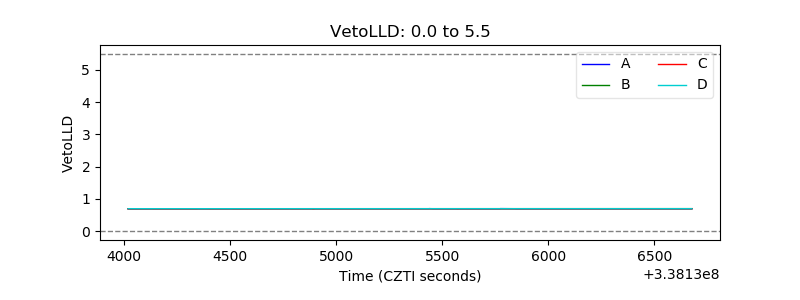 |
| Alpha Counter |  |
| _CPM_Rate | 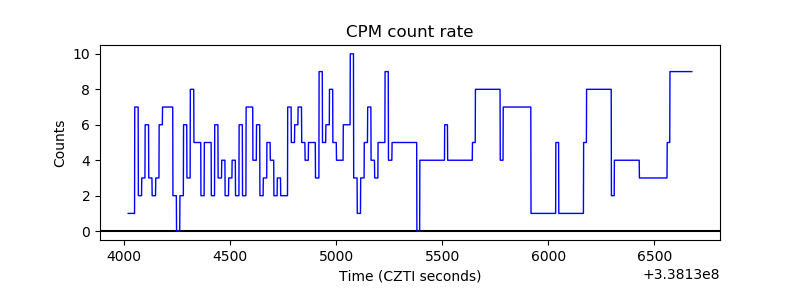 |
| CZT Counter | 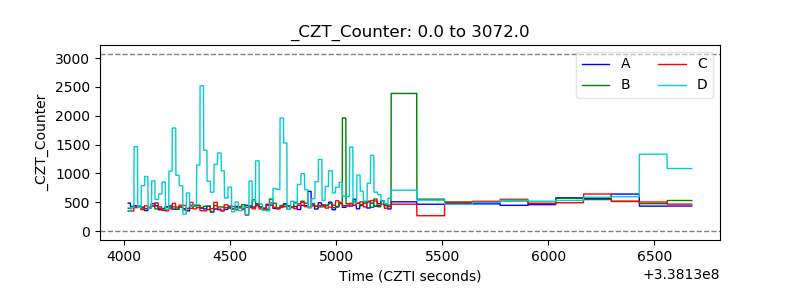 |
| +2.5 Volts monitor |  |
| +5 Volts monitor |  |
| _ROLL_ROT | 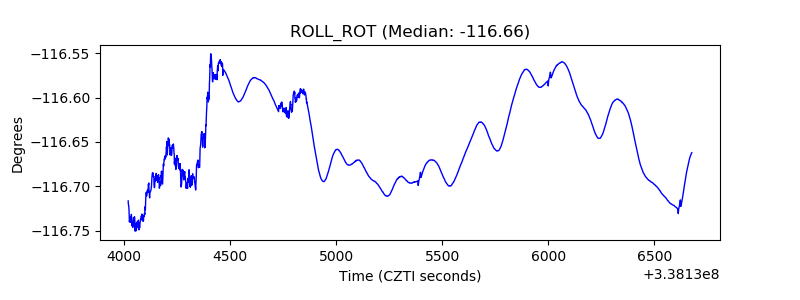 |
| _Roll_DEC | 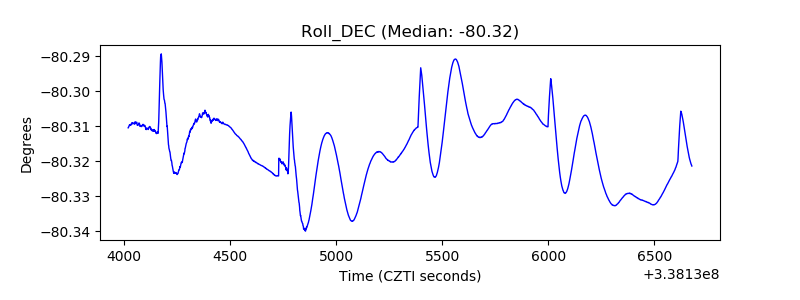 |
| _Roll_RA | 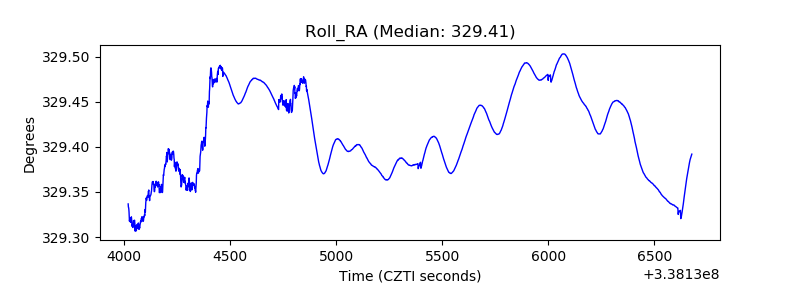 |
| Veto Counter | 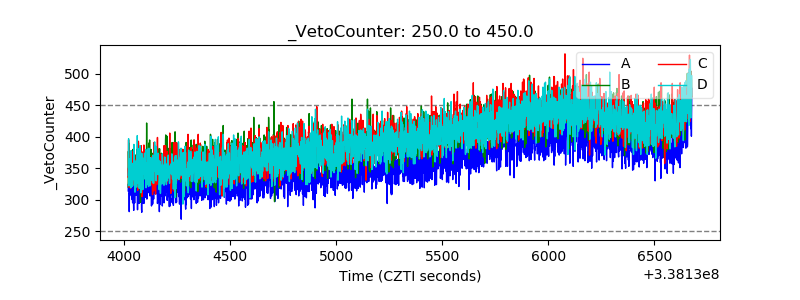 |