| Param | Original file | Final file |
|---|---|---|
| Filename | modeM0/AS1A09_038T18_9000003890cztM0_level2.fits | modeM0/AS1A09_038T18_9000003890cztM0_level2_quad_clean.evt |
| Size (bytes) | 58,792,320 | 49,487,040 |
| Size | 56.1 MB | 47.2 MB |
| Events in quadrant A | 371,946 | 323,966 |
| Events in quadrant B | 283,782 | 119,247 |
| Events in quadrant C | 374,142 | 332,469 |
| Events in quadrant D | 319,342 | 292,009 |
| Mode SS | |||
|---|---|---|---|
| Quadrant | BADHDUFLAG | Total packets | Discarded packets |
| A | 0 | 124 | 0 |
| B | 0 | 124 | 0 |
| C | 0 | 124 | 0 |
| D | 0 | 124 | 0 |
| Mode M0 | |||
|---|---|---|---|
| Quadrant | BADHDUFLAG | Total packets | Discarded packets |
| A | 0 | 14942 | 0 |
| B | 0 | 29357 | 0 |
| C | 0 | 12576 | 0 |
| D | 0 | 18164 | 0 |
| Mode M9 | |||
|---|---|---|---|
| Quadrant | BADHDUFLAG | Total packets | Discarded packets |
| A | 0 | 11 | 0 |
| B | 0 | 11 | 0 |
| C | 0 | 11 | 0 |
| D | 0 | 11 | 0 |
| Quadrant | Total seconds | Saturated seconds | Saturation percentage |
|---|---|---|---|
| A | 6163 | 232 | 3.764400% |
| B | 6163 | 2702 | 43.842285% |
| C | 6163 | 53 | 0.859971% |
| D | 6163 | 312 | 5.062470% |
Noise dominated data is calculated using 1-second bins in cleaned event files. If a bin has >2000 counts, and if more than 50% of those come from <1% of pixels, then it is considered to be noise-dominated and hence unusable.
| Quadrant | # 1 sec bins | Bins with >0 counts | Bins with >2000 counts | High rate bins dominated by noise | Noise dominated (total time) | Noise dominated (detector-on time) | Marked lightcurve |
|---|---|---|---|---|---|---|---|
| A | 7203 | 6160 | 0 | 0 | 0.00% | 0.00% | 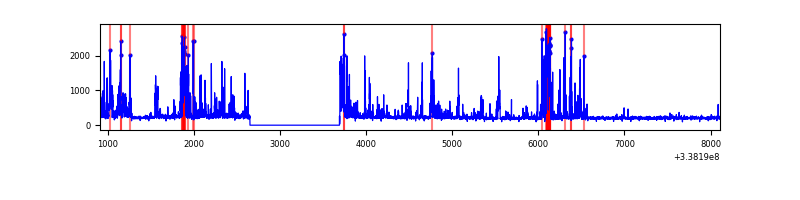 |
| B | 7203 | 6161 | 0 | 0 | 0.00% | 0.00% | 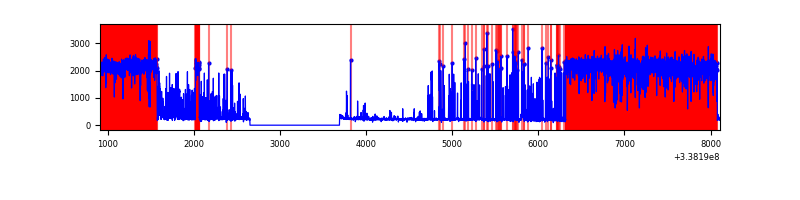 |
| C | 7203 | 6163 | 0 | 0 | 0.00% | 0.00% | 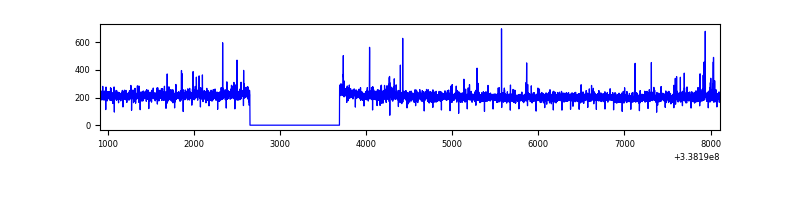 |
| D | 7203 | 6159 | 0 | 0 | 0.00% | 0.00% |  |
Top three noisy pixels from each quadrant. If the there are fewer than three noisy pixels in the level2.evt file, extra rows are filled as -1
| Pixel properties | Quadrant properties | ||||||
|---|---|---|---|---|---|---|---|
| Quadrant | DetID | PixID | Counts | Sigma | Mean | Median | Sigma |
| A | 0 | 29 | 330 | 9.29 | 97 | 92 | 25.6 |
| A | 0 | 30 | 310 | 8.51 | 97 | 92 | 25.6 |
| A | 7 | 110 | 286 | 7.58 | 97 | 92 | 25.6 |
| B | 2 | 9 | 216 | 8.64 | 75 | 72 | 16.7 |
| B | 5 | 232 | 207 | 8.1 | 75 | 72 | 16.7 |
| B | 5 | 128 | 198 | 7.56 | 75 | 72 | 16.7 |
| C | 1 | 81 | 287 | 7.31 | 99 | 93 | 26.5 |
| C | 1 | 80 | 266 | 6.52 | 99 | 93 | 26.5 |
| C | 12 | 241 | 260 | 6.3 | 99 | 93 | 26.5 |
| D | 7 | 3 | 244 | 6.25 | 91 | 84 | 25.6 |
| D | 6 | 62 | 239 | 6.06 | 91 | 84 | 25.6 |
| D | 6 | 38 | 231 | 5.75 | 91 | 84 | 25.6 |
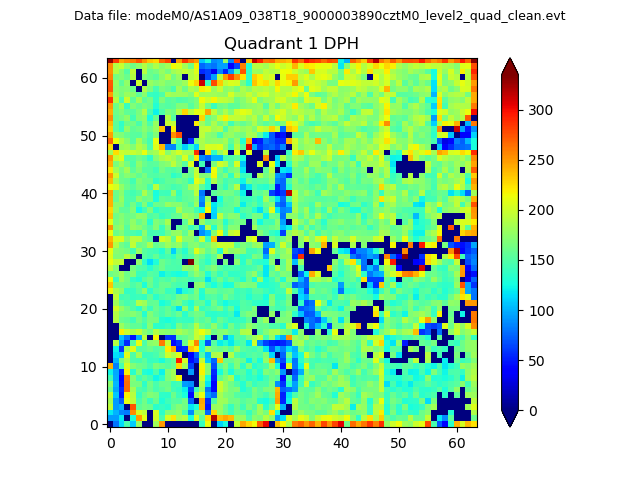
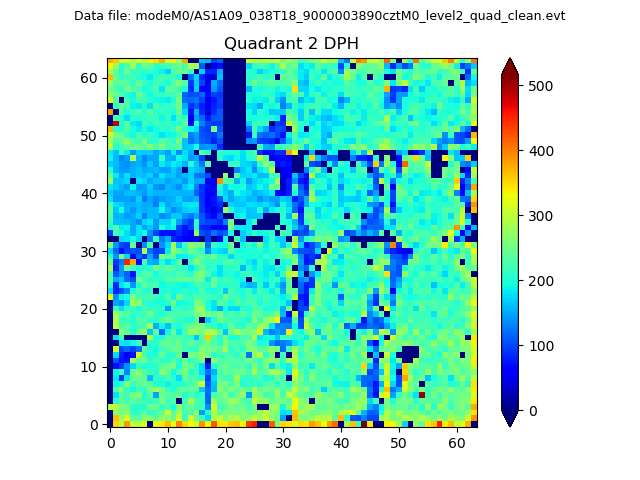
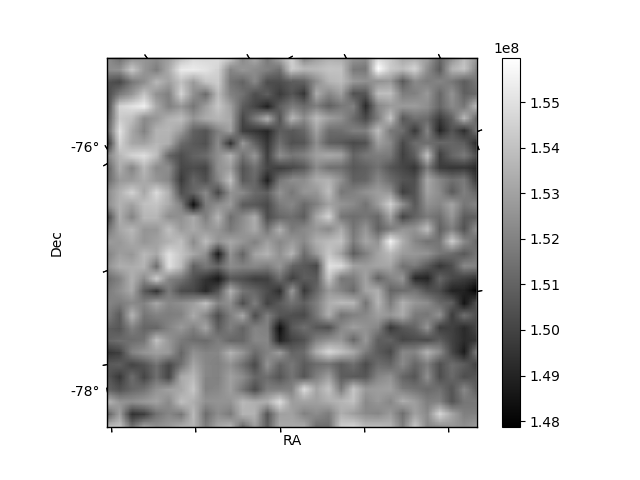
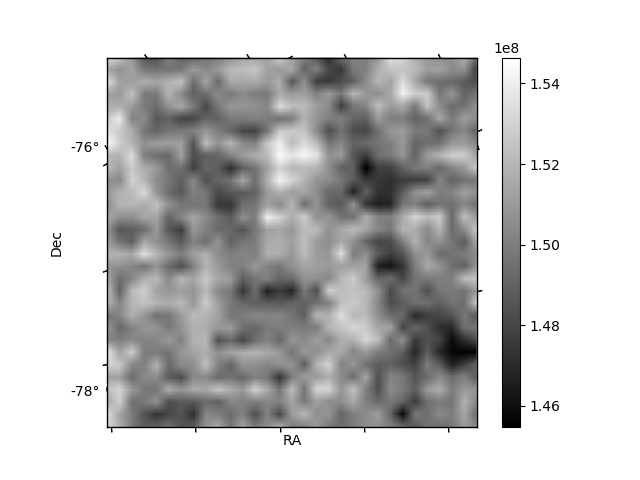
Histogram calculated using DETX and DETY for each event in the final _common_clean file
| Quadrant A | 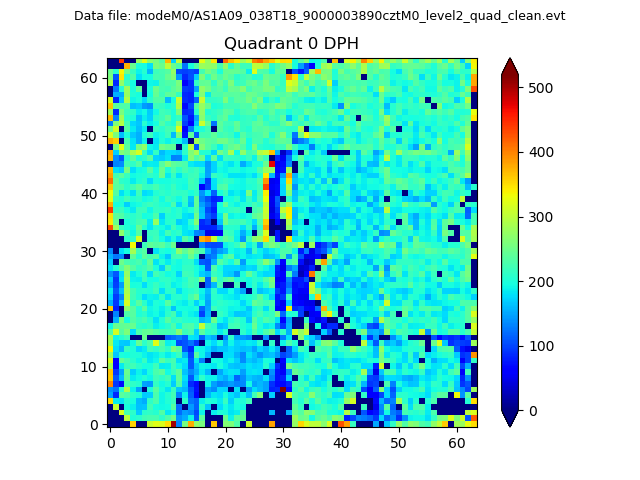 |
 |
Quadrant B |
|---|---|---|---|
| Quadrant D | 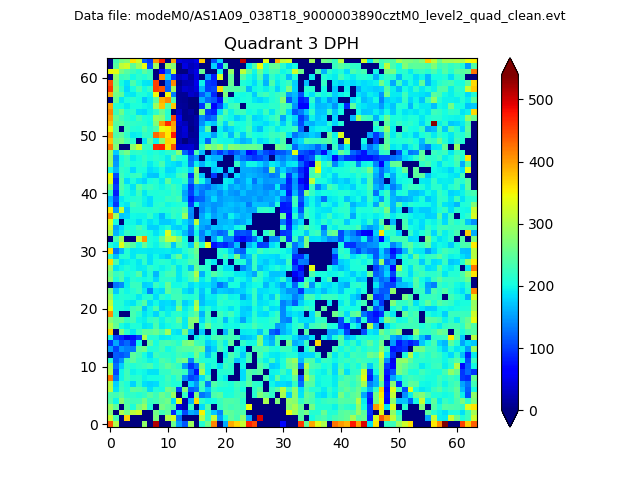 |
 |
Quadrant C |
| Plot type | Count rate plots | Images |
|---|---|---|
| Comparison with Poisson distribution Blue bars denote a histogram of data divided into 1 sec bins. Red curve is a Poisson curve with rate = median count rate of data. |
 |
 |
| Quadrant-wise count rates Data is divided into 100 sec bins |
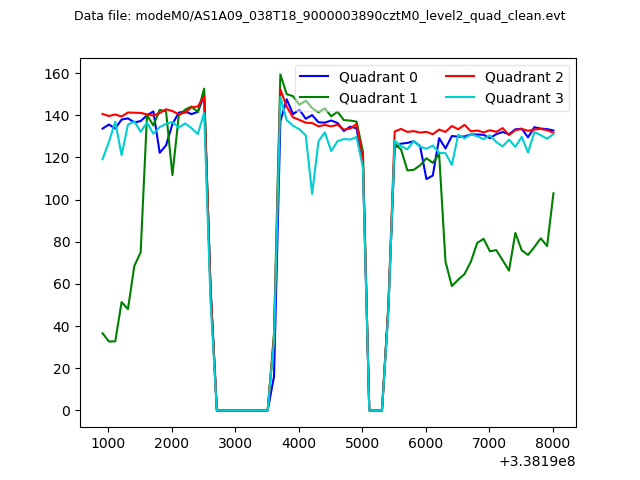 |
|
| Module-wise count rates for Quadrant A Data is divided into 100 sec bins |
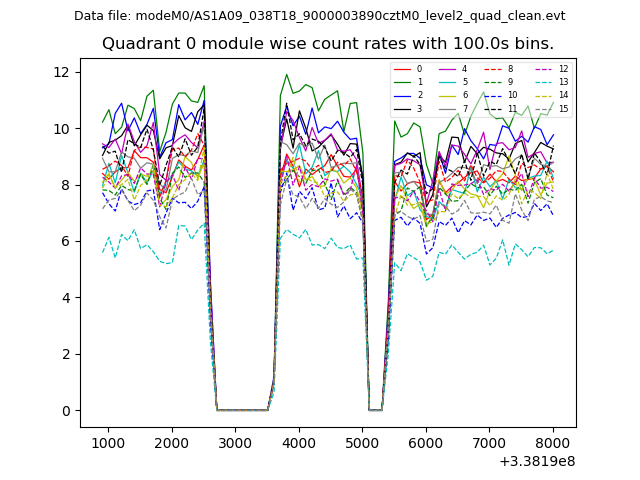 |
 |
| Module-wise count rates for Quadrant B Data is divided into 100 sec bins |
 |
 |
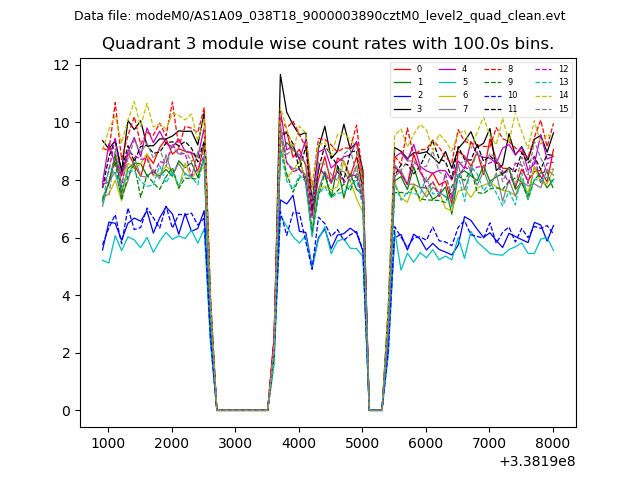
| Module-wise count rates for Quadrant C Data is divided into 100 sec bins |
 |
 |
| Module-wise count rates for Quadrant D Data is divided into 100 sec bins |
 |
 |
| Parameter | Plot |
|---|---|
| CZT HV Monitor | 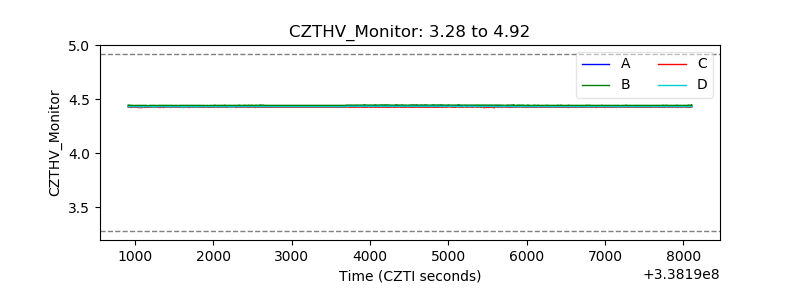 |
| D_VDD | 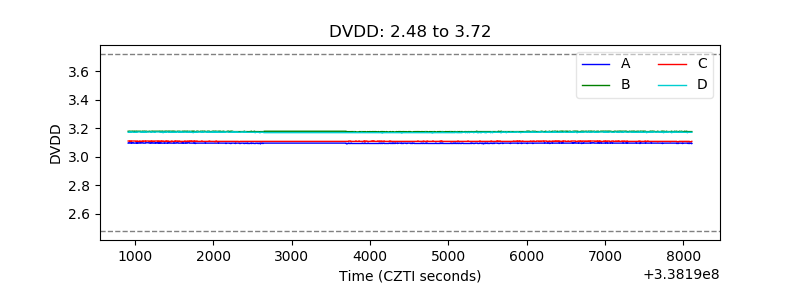 |
| Temperature 1 | 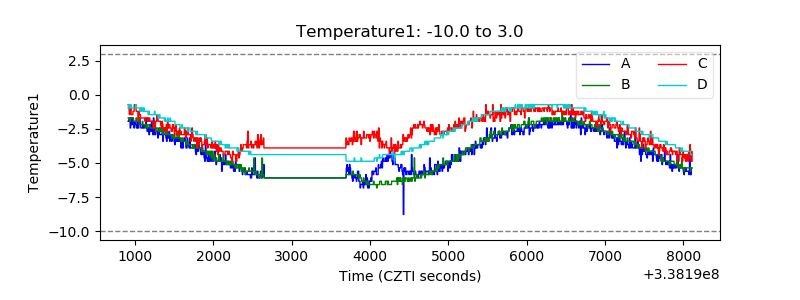 |
| Veto HV Monitor |  |
| Veto LLD |  |
| Alpha Counter | 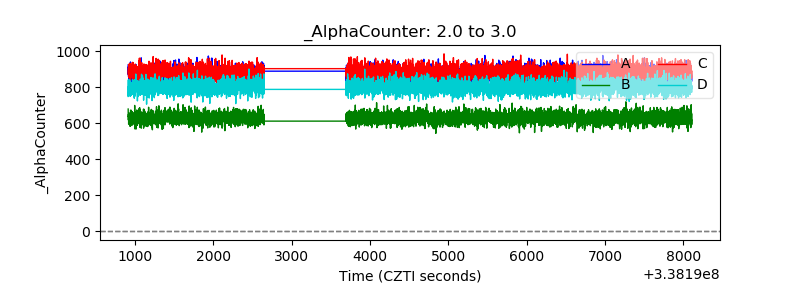 |
| _CPM_Rate | 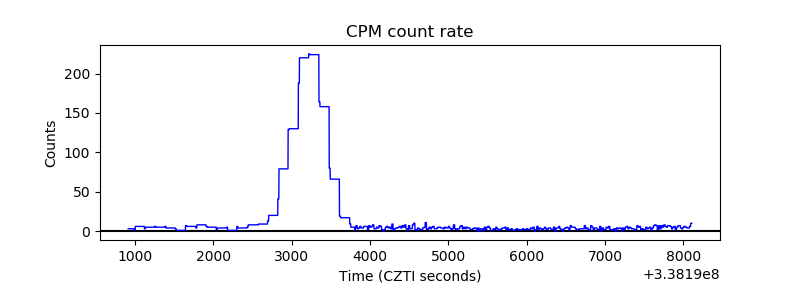 |
| CZT Counter | 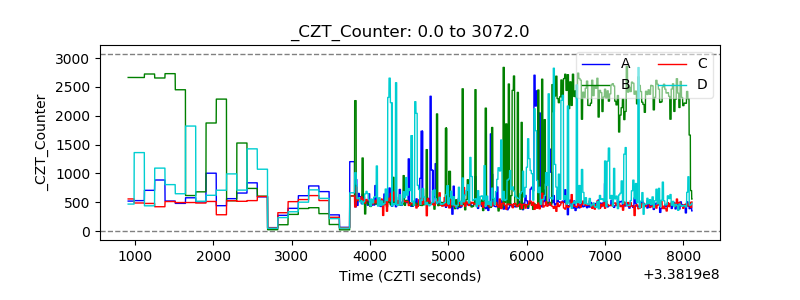 |
| +2.5 Volts monitor |  |
| +5 Volts monitor |  |
| _ROLL_ROT | 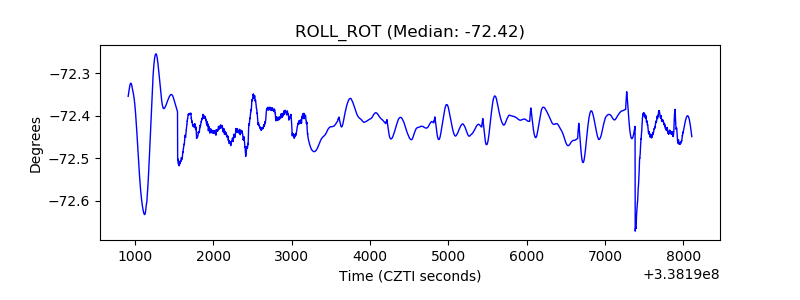 |
| _Roll_DEC |  |
| _Roll_RA | 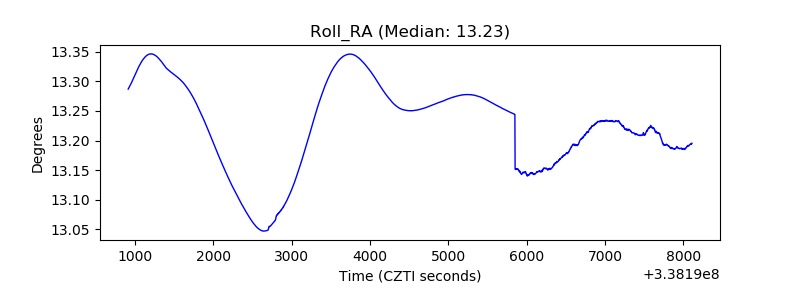 |
| Veto Counter |  |