| Param | Original file | Final file |
|---|---|---|
| Filename | modeM0/AS1A09_038T18_9000003890_26911cztM0_level2.evt | modeM0/AS1A09_038T18_9000003890_26911cztM0_level2_quad_clean.evt |
| Size (bytes) | 326,427,840 | 62,568,000 |
| Size | 311.3 MB | 59.7 MB |
| Events in quadrant A | 2,106,461 | 431,357 |
| Events in quadrant B | 3,394,902 | 382,357 |
| Events in quadrant C | 1,597,224 | 440,801 |
| Events in quadrant D | 2,571,242 | 414,711 |
| Mode M0 | |||
|---|---|---|---|
| Quadrant | BADHDUFLAG | Total packets | Discarded packets |
| A | 0 | 8236 | 0 |
| B | 0 | 12090 | 0 |
| C | 0 | 6556 | 0 |
| D | 0 | 9761 | 0 |
| Mode M9 | |||
|---|---|---|---|
| Quadrant | BADHDUFLAG | Total packets | Discarded packets |
| A | 0 | 11 | 0 |
| B | 0 | 11 | 0 |
| C | 0 | 11 | 0 |
| D | 0 | 11 | 0 |
| Quadrant | Total seconds | Saturated seconds | Saturation percentage |
|---|---|---|---|
| A | 3168 | 162 | 5.113636% |
| B | 3168 | 815 | 25.726010% |
| C | 3168 | 44 | 1.388889% |
| D | 3168 | 209 | 6.597222% |
Noise dominated data is calculated using 1-second bins in cleaned event files. If a bin has >2000 counts, and if more than 50% of those come from <1% of pixels, then it is considered to be noise-dominated and hence unusable.
| Quadrant | # 1 sec bins | Bins with >0 counts | Bins with >2000 counts | High rate bins dominated by noise | Noise dominated (total time) | Noise dominated (detector-on time) | Marked lightcurve |
|---|---|---|---|---|---|---|---|
| A | 4208 | 3169 | 97 | 97 | 2.31% | 3.06% | 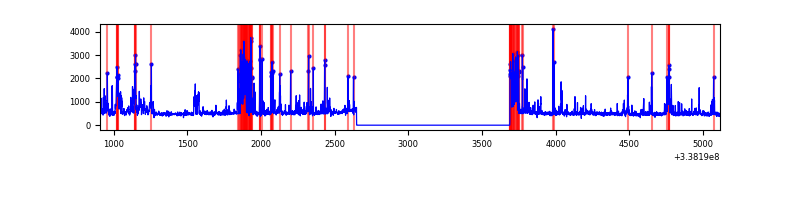 |
| B | 4208 | 3169 | 741 | 741 | 17.61% | 23.38% | 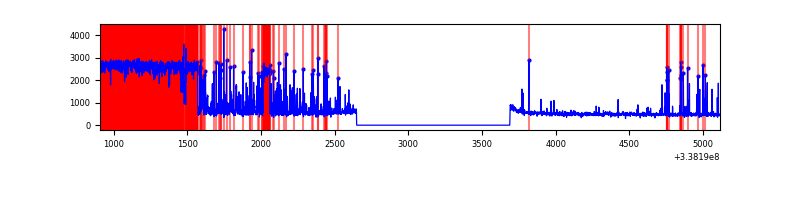 |
| C | 4208 | 3169 | 0 | 0 | 0.00% | 0.00% | 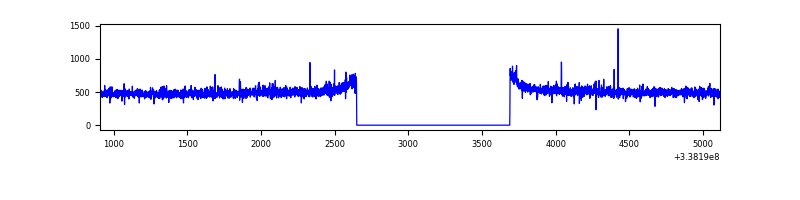 |
| D | 4208 | 3169 | 147 | 147 | 3.49% | 4.64% | 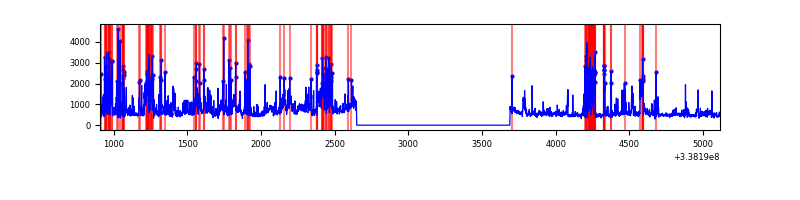 |
Top three noisy pixels from each quadrant. If the there are fewer than three noisy pixels in the level2.evt file, extra rows are filled as -1
| Pixel properties | Quadrant properties | ||||||
|---|---|---|---|---|---|---|---|
| Quadrant | DetID | PixID | Counts | Sigma | Mean | Median | Sigma |
| A | 0 | 13 | 565058 | 7002.63 | 394 | 387 | 80.6 |
| A | 8 | 192 | 21770 | 265.18 | 394 | 387 | 80.6 |
| A | 13 | 254 | 4856 | 55.42 | 394 | 387 | 80.6 |
| B | 0 | 189 | 1915339 | 28851.83 | 348 | 339 | 66.4 |
| B | 10 | 245 | 95153 | 1428.49 | 348 | 339 | 66.4 |
| B | 10 | 246 | 8135 | 117.46 | 348 | 339 | 66.4 |
| C | 14 | 238 | 62458 | 669.84 | 392 | 393 | 92.7 |
| C | 15 | 208 | 5946 | 59.93 | 392 | 393 | 92.7 |
| C | 2 | 16 | 3260 | 30.94 | 392 | 393 | 92.7 |
| D | 1 | 52 | 733564 | 7354.49 | 378 | 371 | 99.7 |
| D | 7 | 80 | 226341 | 2266.65 | 378 | 371 | 99.7 |
| D | 2 | 250 | 99202 | 991.35 | 378 | 371 | 99.7 |
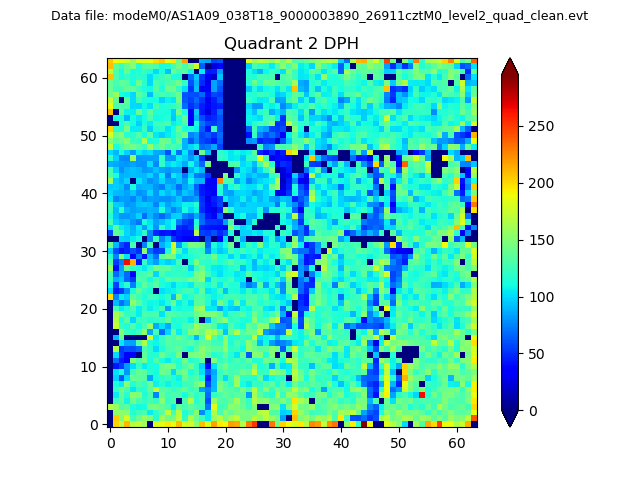
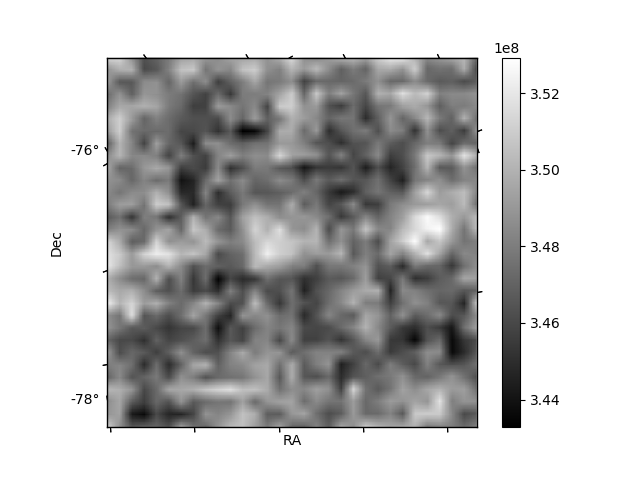
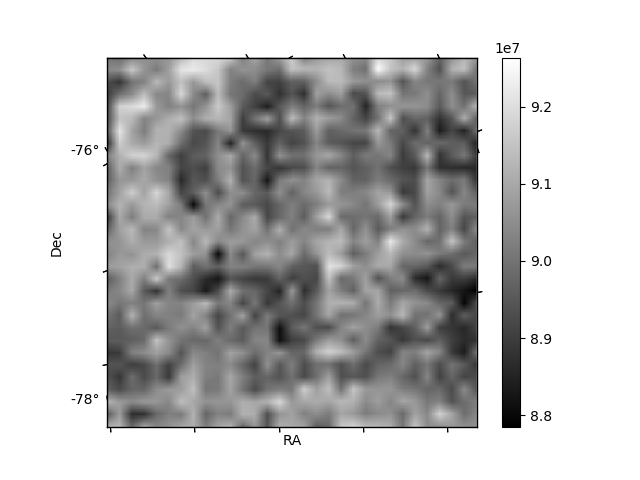
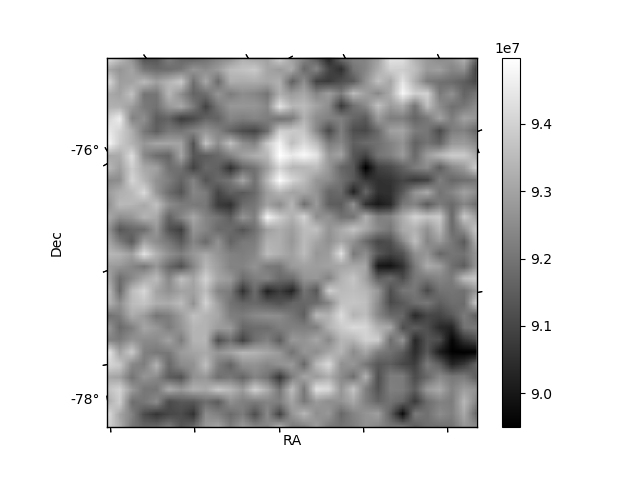
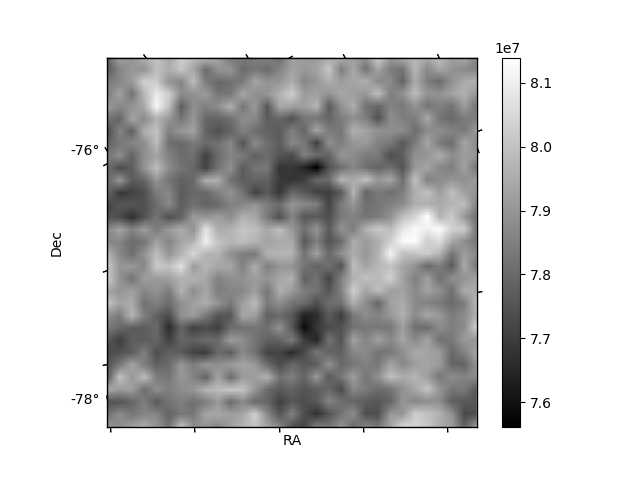
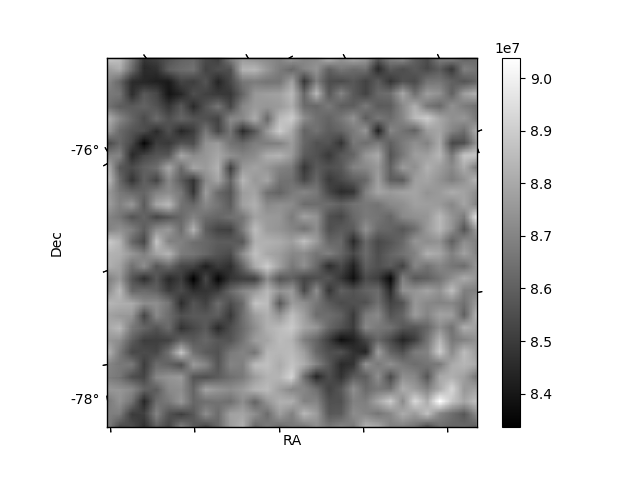
Histogram calculated using DETX and DETY for each event in the final _common_clean file
| Quadrant A | 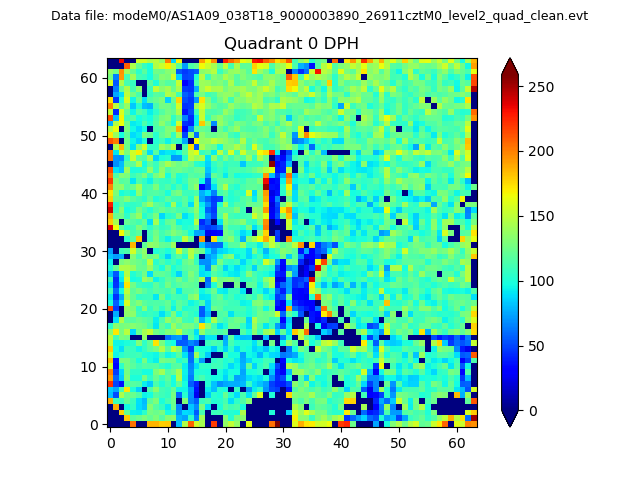 |
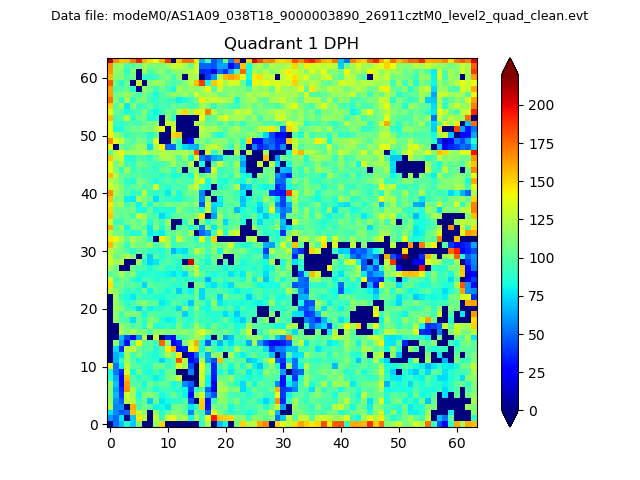 |
Quadrant B |
|---|---|---|---|
| Quadrant D | 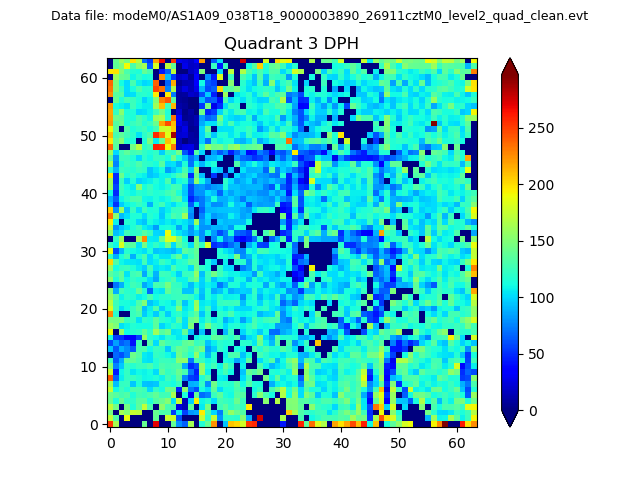 |
 |
Quadrant C |
| Plot type | Count rate plots | Images |
|---|---|---|
| Comparison with Poisson distribution Blue bars denote a histogram of data divided into 1 sec bins. Red curve is a Poisson curve with rate = median count rate of data. |
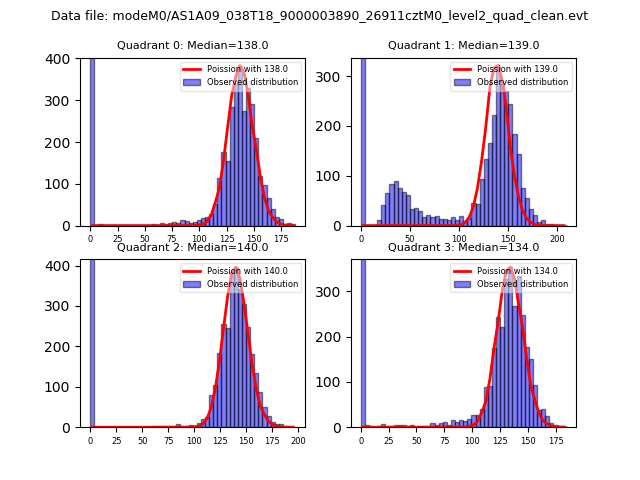 |
 |
| Quadrant-wise count rates Data is divided into 100 sec bins |
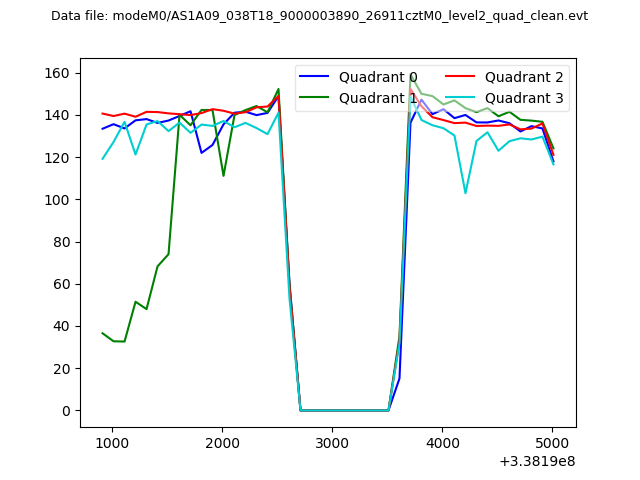 |
|
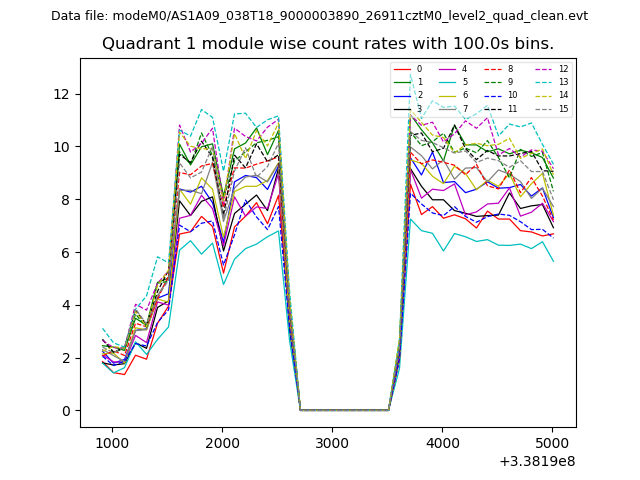
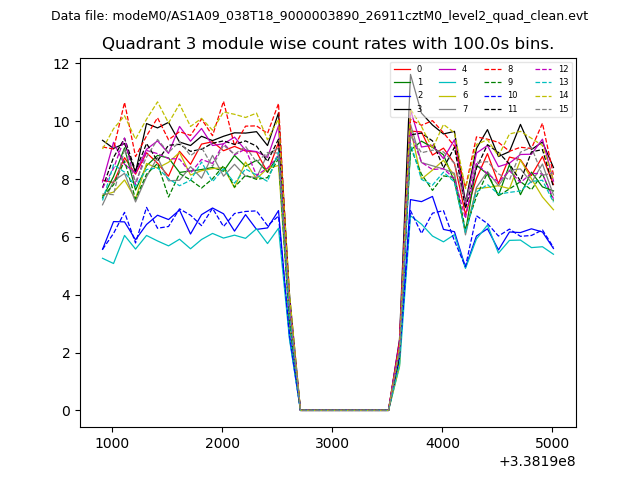
| Module-wise count rates for Quadrant A Data is divided into 100 sec bins |
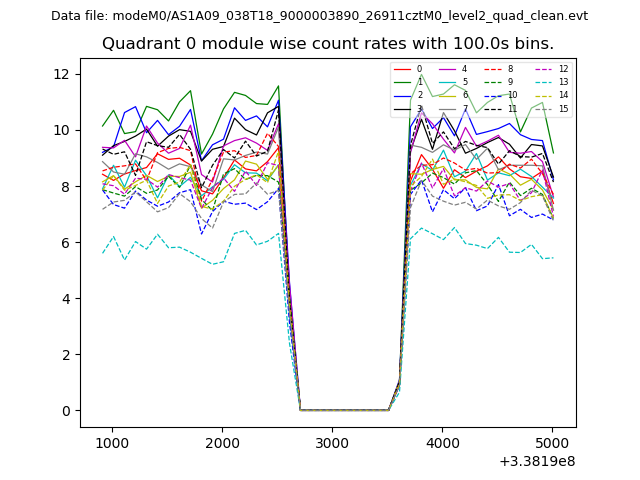 |
 |
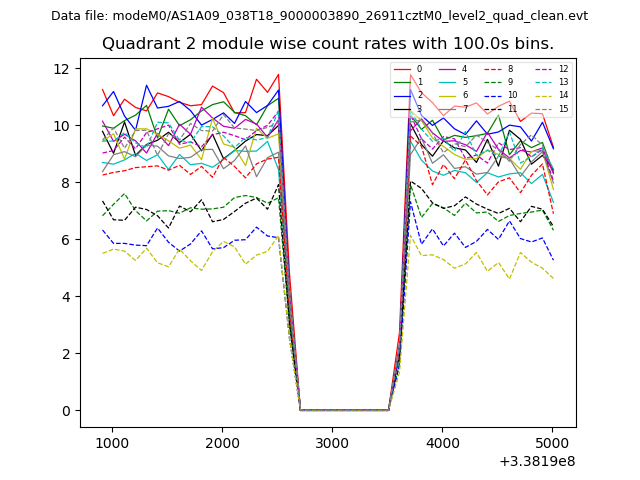
| Module-wise count rates for Quadrant B Data is divided into 100 sec bins |
 |
 |
| Module-wise count rates for Quadrant C Data is divided into 100 sec bins |
 |
 |
| Module-wise count rates for Quadrant D Data is divided into 100 sec bins |
 |
 |
| Parameter | Plot |
|---|---|
| CZT HV Monitor | 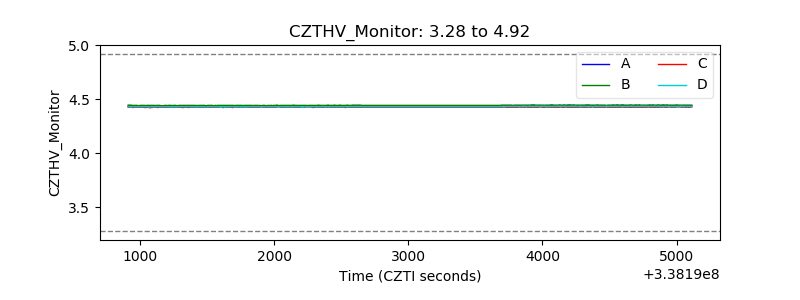 |
| D_VDD | 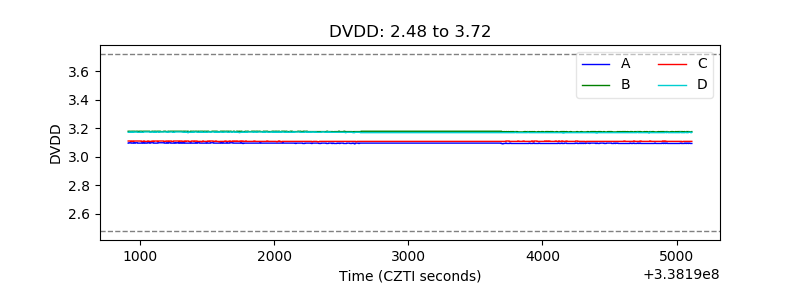 |
| Temperature 1 | 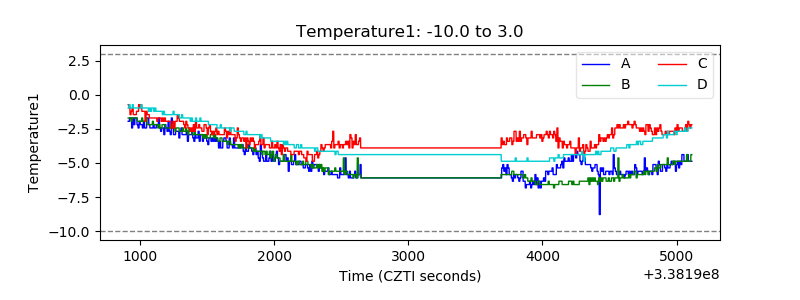 |
| Veto HV Monitor | 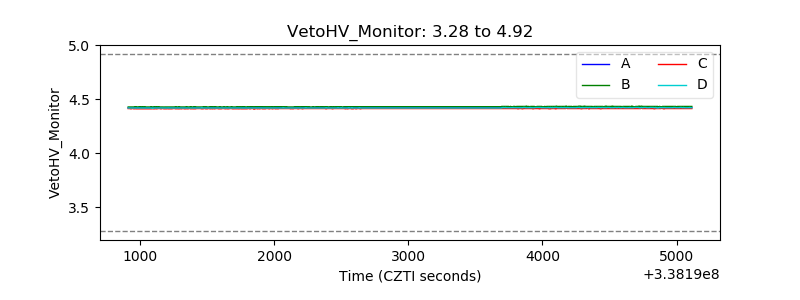 |
| Veto LLD | 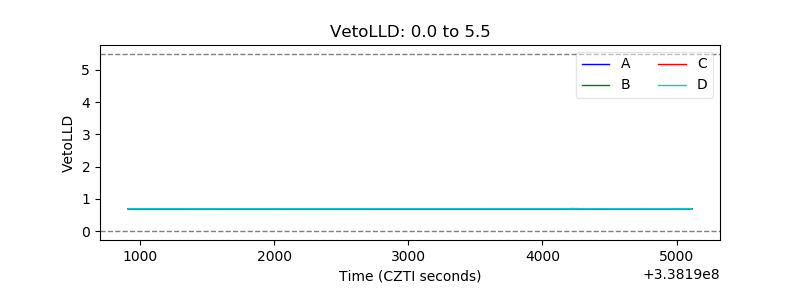 |
| Alpha Counter | 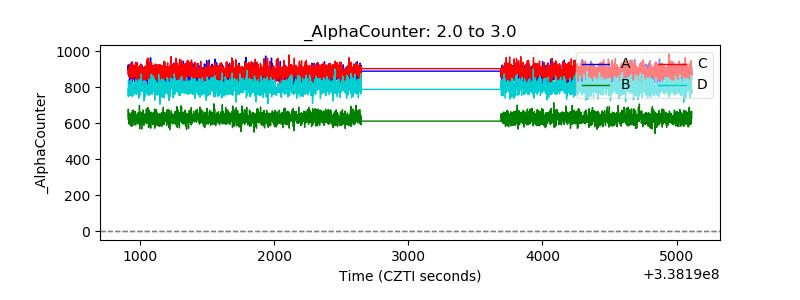 |
| _CPM_Rate | 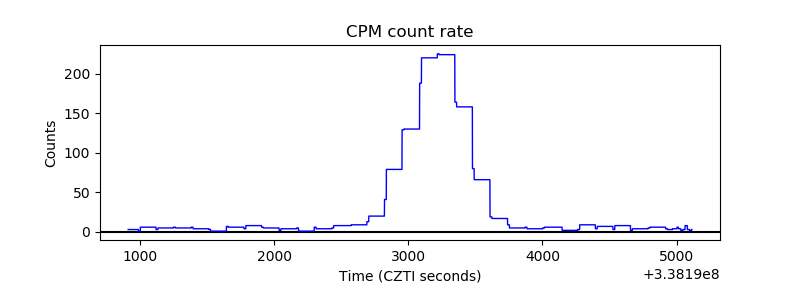 |
| CZT Counter | 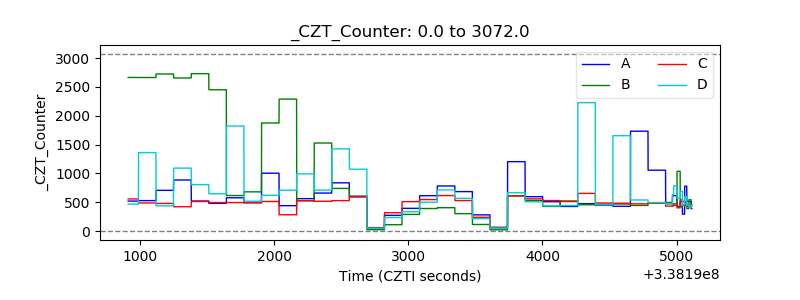 |
| +2.5 Volts monitor |  |
| +5 Volts monitor | 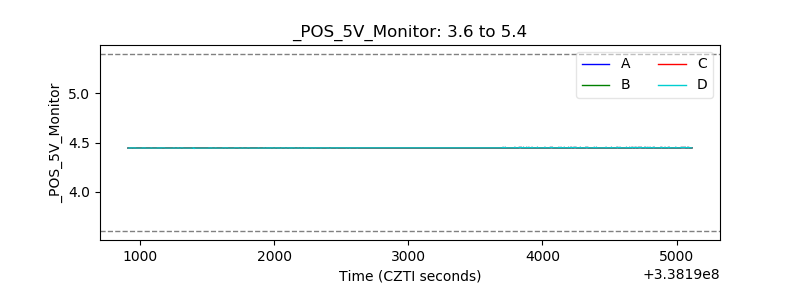 |
| _ROLL_ROT | 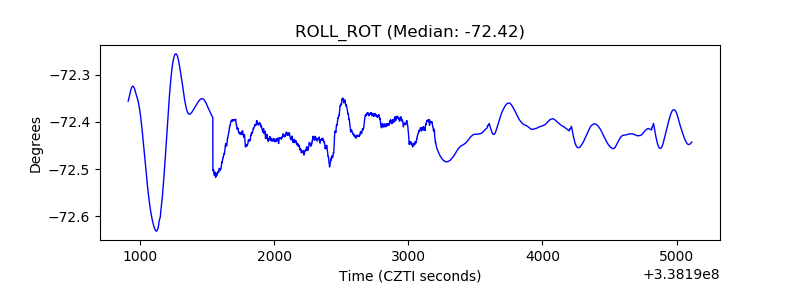 |
| _Roll_DEC | 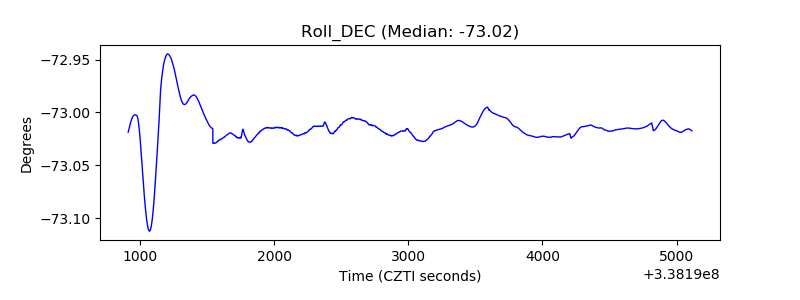 |
| _Roll_RA | 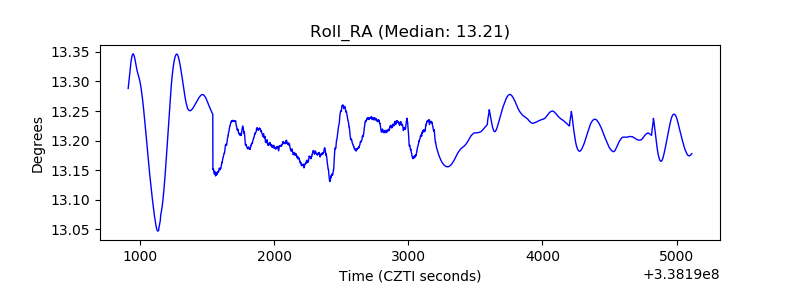 |
| Veto Counter | 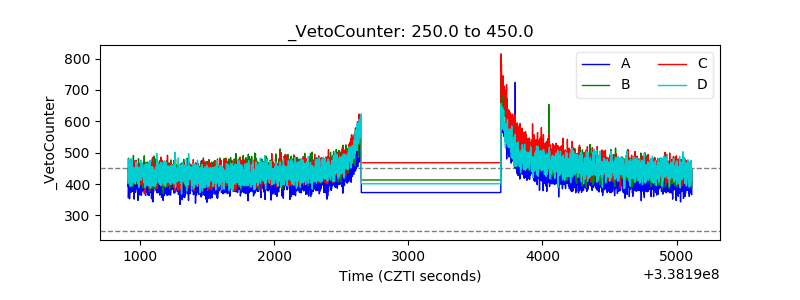 |