| Param | Original file | Final file |
|---|---|---|
| Filename | modeM0/AS1A09_038T18_9000003890_26912cztM0_level2.evt | modeM0/AS1A09_038T18_9000003890_26912cztM0_level2_quad_clean.evt |
| Size (bytes) | 400,334,400 | 62,616,960 |
| Size | 381.8 MB | 59.7 MB |
| Events in quadrant A | 1,994,940 | 432,618 |
| Events in quadrant B | 5,538,397 | 331,924 |
| Events in quadrant C | 1,725,987 | 443,405 |
| Events in quadrant D | 2,611,859 | 424,775 |
| Mode M0 | |||
|---|---|---|---|
| Quadrant | BADHDUFLAG | Total packets | Discarded packets |
| A | 0 | 8346 | 0 |
| B | 0 | 18918 | 0 |
| C | 0 | 7457 | 0 |
| D | 0 | 10222 | 0 |
| Quadrant | Total seconds | Saturated seconds | Saturation percentage |
|---|---|---|---|
| A | 3710 | 75 | 2.021563% |
| B | 3711 | 1905 | 51.333872% |
| C | 3711 | 11 | 0.296416% |
| D | 3711 | 116 | 3.125842% |
Noise dominated data is calculated using 1-second bins in cleaned event files. If a bin has >2000 counts, and if more than 50% of those come from <1% of pixels, then it is considered to be noise-dominated and hence unusable.
| Quadrant | # 1 sec bins | Bins with >0 counts | Bins with >2000 counts | High rate bins dominated by noise | Noise dominated (total time) | Noise dominated (detector-on time) | Marked lightcurve |
|---|---|---|---|---|---|---|---|
| A | 3710 | 3710 | 66 | 66 | 1.78% | 1.78% | 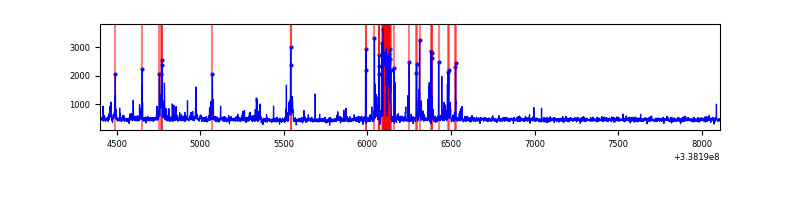 |
| B | 3711 | 3711 | 1755 | 1755 | 47.29% | 47.29% | 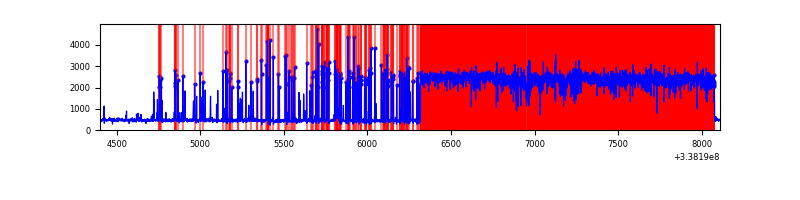 |
| C | 3711 | 3711 | 0 | 0 | 0.00% | 0.00% | 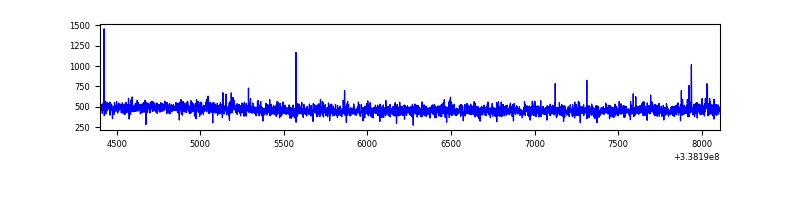 |
| D | 3711 | 3711 | 108 | 108 | 2.91% | 2.91% | 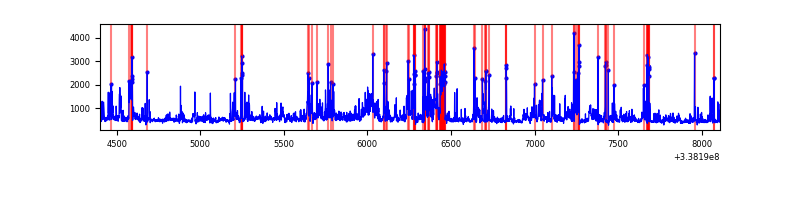 |
Top three noisy pixels from each quadrant. If the there are fewer than three noisy pixels in the level2.evt file, extra rows are filled as -1
| Pixel properties | Quadrant properties | ||||||
|---|---|---|---|---|---|---|---|
| Quadrant | DetID | PixID | Counts | Sigma | Mean | Median | Sigma |
| A | 0 | 13 | 322620 | 3682.01 | 433 | 425 | 87.5 |
| A | 13 | 254 | 5776 | 61.15 | 433 | 425 | 87.5 |
| A | 3 | 137 | 3946 | 40.24 | 433 | 425 | 87.5 |
| B | 0 | 189 | 4114293 | 61076.73 | 349 | 340 | 67.4 |
| B | 10 | 245 | 33929 | 498.67 | 349 | 340 | 67.4 |
| B | 3 | 64 | 11422 | 164.53 | 349 | 340 | 67.4 |
| C | 14 | 238 | 68542 | 690.91 | 423 | 426 | 98.6 |
| C | 15 | 208 | 7545 | 72.21 | 423 | 426 | 98.6 |
| C | 13 | 61 | 2965 | 25.75 | 423 | 426 | 98.6 |
| D | 1 | 52 | 805248 | 7220.92 | 419 | 410 | 111.5 |
| D | 7 | 80 | 142365 | 1273.61 | 419 | 410 | 111.5 |
| D | 2 | 250 | 40986 | 364.04 | 419 | 410 | 111.5 |
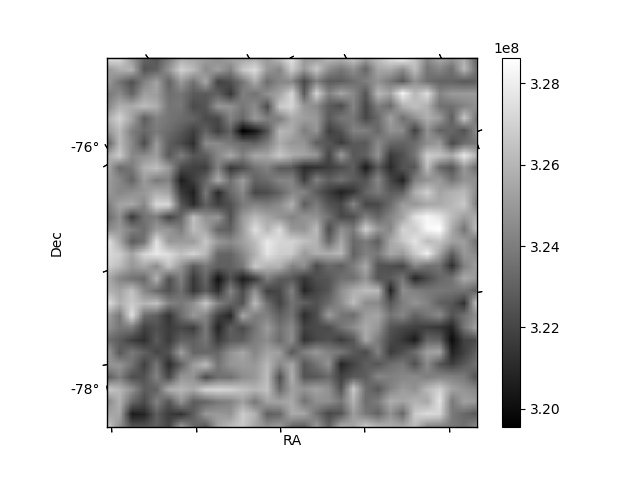
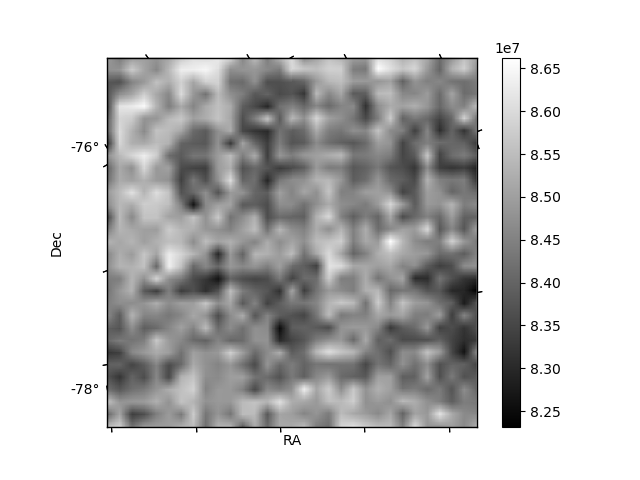
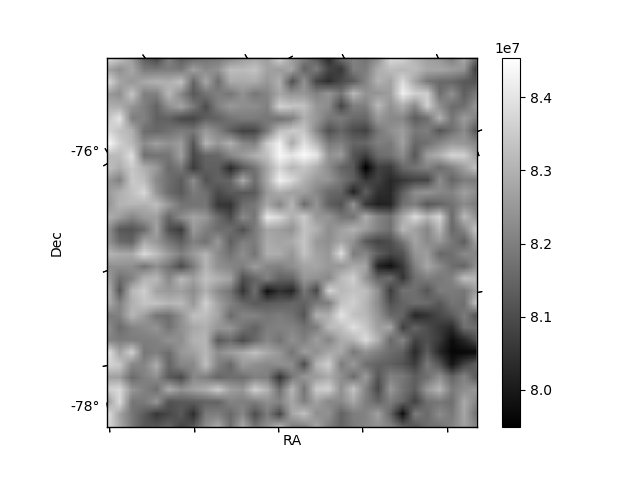
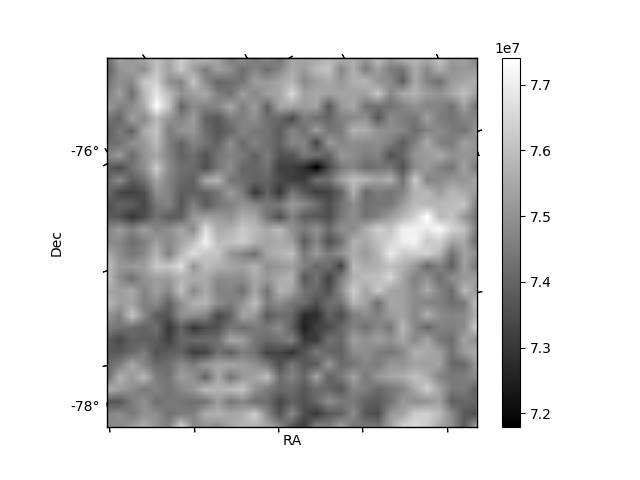
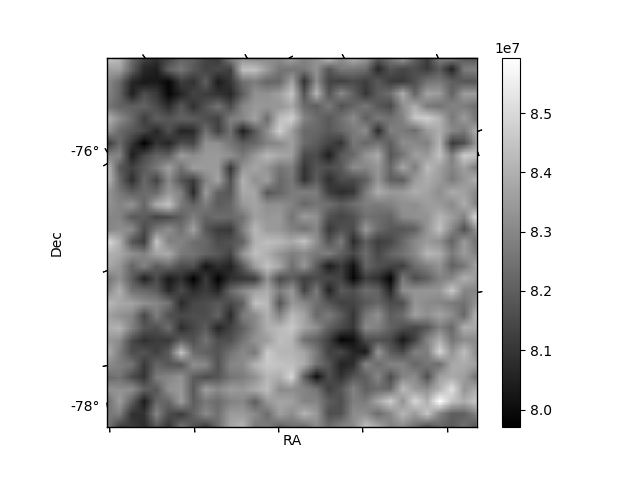
Histogram calculated using DETX and DETY for each event in the final _common_clean file
| Quadrant A | 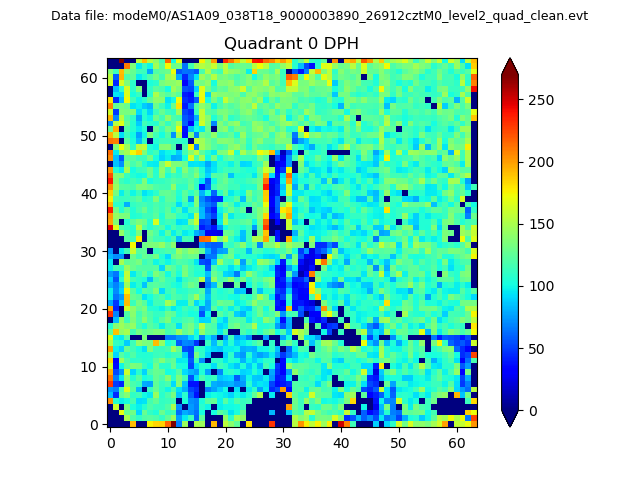 |
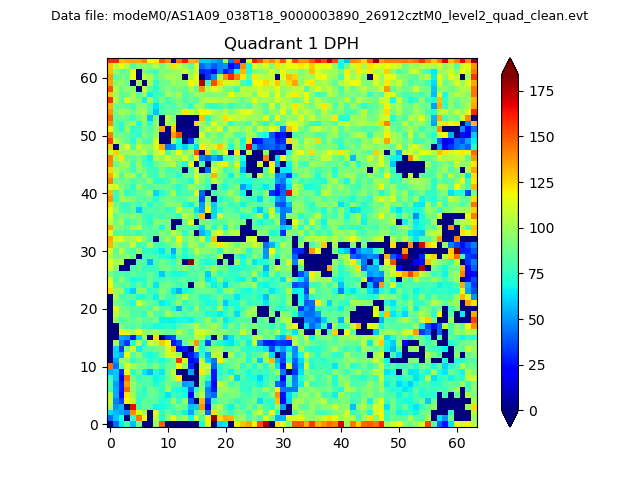 |
Quadrant B |
|---|---|---|---|
| Quadrant D | 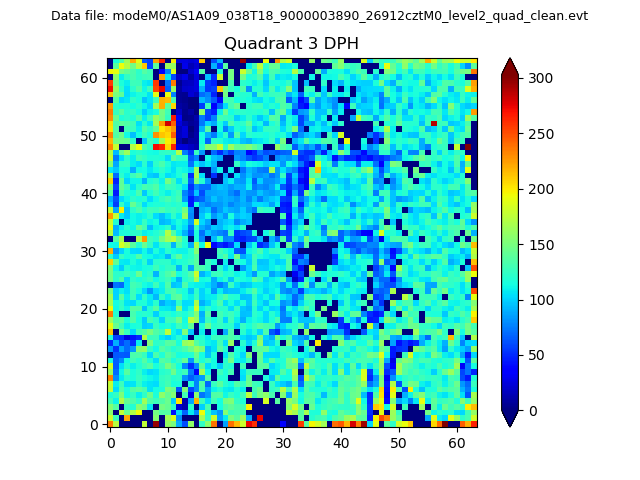 |
 |
Quadrant C |
| Plot type | Count rate plots | Images |
|---|---|---|
| Comparison with Poisson distribution Blue bars denote a histogram of data divided into 1 sec bins. Red curve is a Poisson curve with rate = median count rate of data. |
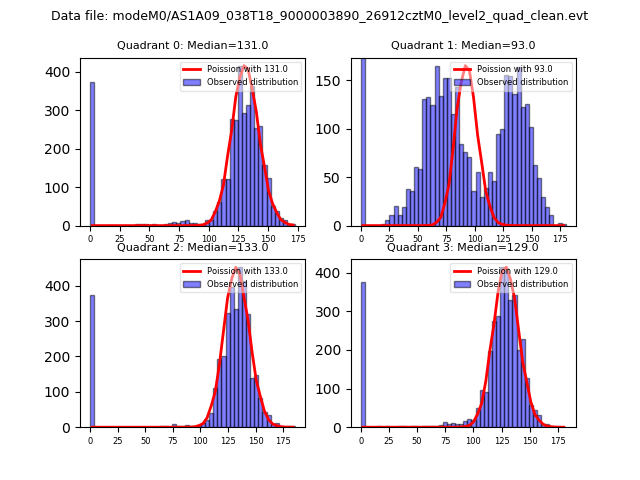 |
 |
| Quadrant-wise count rates Data is divided into 100 sec bins |
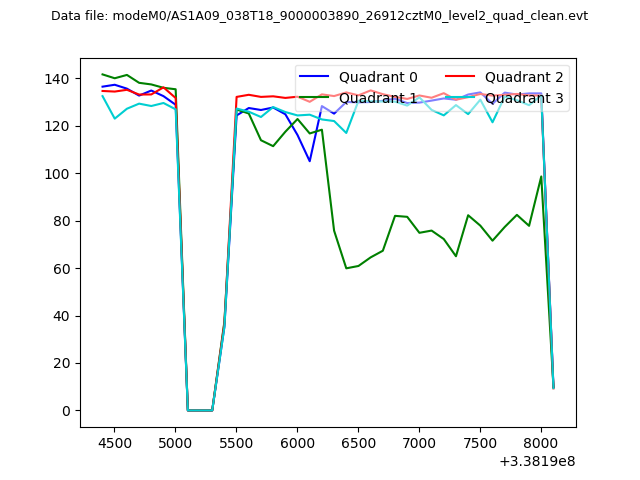 |
|
| Module-wise count rates for Quadrant A Data is divided into 100 sec bins |
 |
 |
| Module-wise count rates for Quadrant B Data is divided into 100 sec bins |
 |
 |
| Module-wise count rates for Quadrant C Data is divided into 100 sec bins |
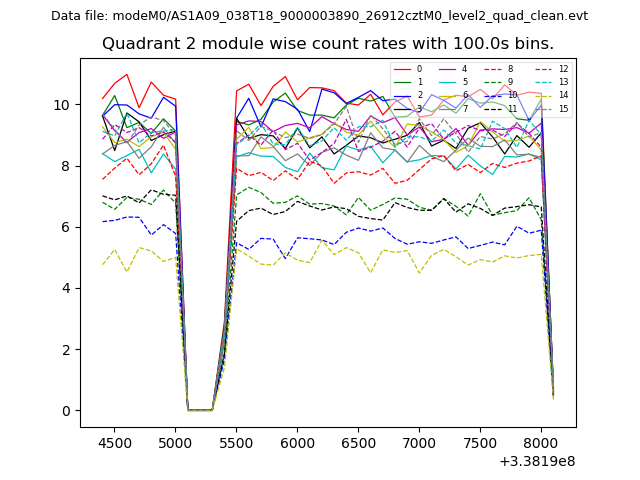 |
 |
| Module-wise count rates for Quadrant D Data is divided into 100 sec bins |
 |
 |
| Parameter | Plot |
|---|---|
| CZT HV Monitor | 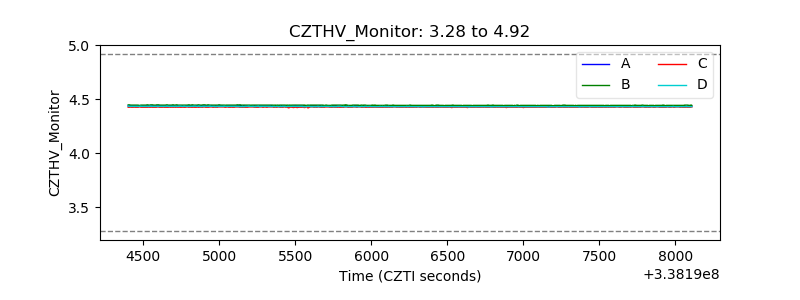 |
| D_VDD | 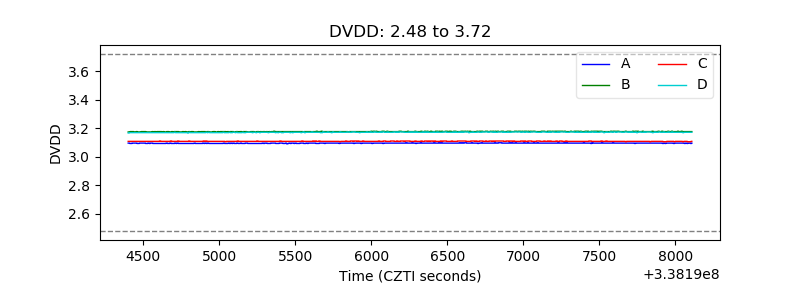 |
| Temperature 1 | 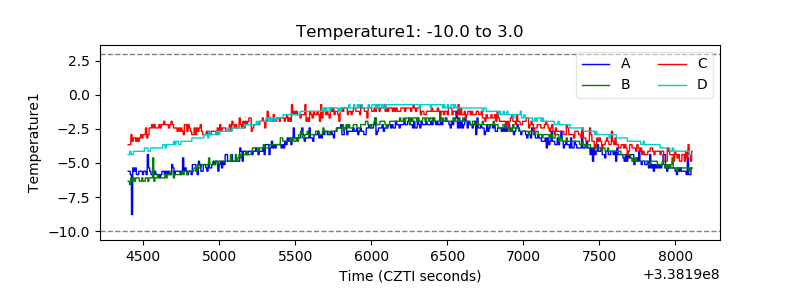 |
| Veto HV Monitor | 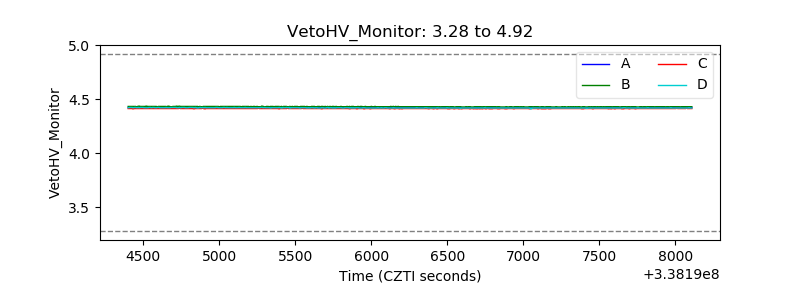 |
| Veto LLD | 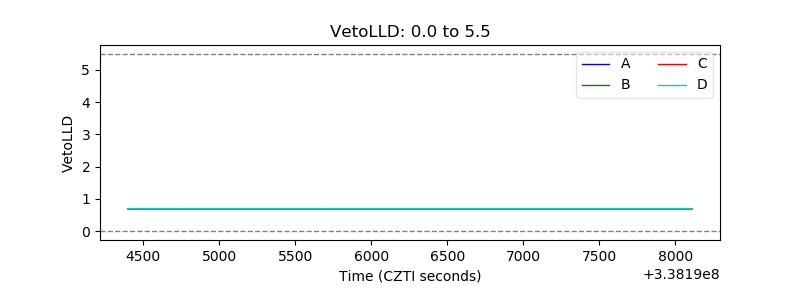 |
| Alpha Counter | 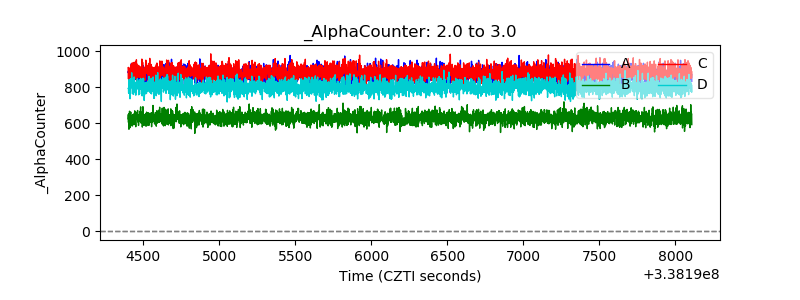 |
| _CPM_Rate | 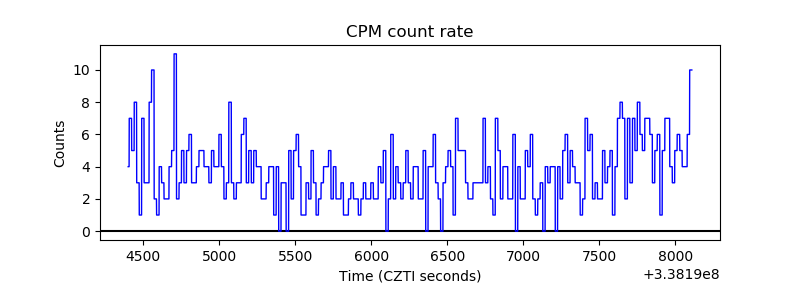 |
| CZT Counter | 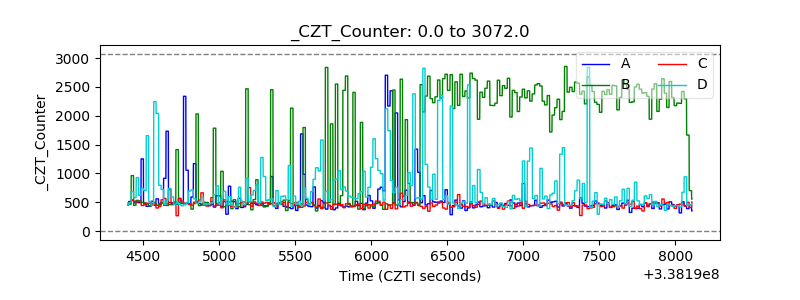 |
| +2.5 Volts monitor |  |
| +5 Volts monitor |  |
| _ROLL_ROT |  |
| _Roll_DEC |  |
| _Roll_RA | 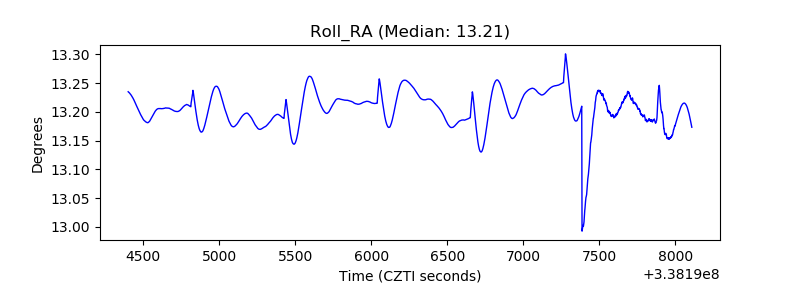 |
| Veto Counter |  |