| Param | Original file | Final file |
|---|---|---|
| Filename | modeM0/AS1A09_038T19_9000003892cztM0_level2.fits | modeM0/AS1A09_038T19_9000003892cztM0_level2_quad_clean.evt |
| Size (bytes) | 120,507,840 | 145,477,440 |
| Size | 114.9 MB | 138.7 MB |
| Events in quadrant A | 766,620 | 1,028,295 |
| Events in quadrant B | 610,704 | 720,831 |
| Events in quadrant C | 764,626 | 1,009,047 |
| Events in quadrant D | 594,544 | 737,869 |
| Mode SS | |||
|---|---|---|---|
| Quadrant | BADHDUFLAG | Total packets | Discarded packets |
| A | 0 | 270 | 0 |
| B | 0 | 270 | 0 |
| C | 0 | 270 | 0 |
| D | 0 | 270 | 0 |
| Mode M9 | |||
|---|---|---|---|
| Quadrant | BADHDUFLAG | Total packets | Discarded packets |
| A | 0 | 8 | 0 |
| B | 0 | 8 | 0 |
| C | 0 | 8 | 0 |
| D | 0 | 8 | 0 |
| Mode M0 | |||
|---|---|---|---|
| Quadrant | BADHDUFLAG | Total packets | Discarded packets |
| A | 0 | 27425 | 0 |
| B | 0 | 60357 | 0 |
| C | 0 | 27449 | 0 |
| D | 0 | 48101 | 0 |
| Quadrant | Total seconds | Saturated seconds | Saturation percentage |
|---|---|---|---|
| A | 13148 | 492 | 3.742014% |
| B | 13148 | 5500 | 41.831457% |
| C | 13148 | 567 | 4.312443% |
| D | 13148 | 2759 | 20.984180% |
Noise dominated data is calculated using 1-second bins in cleaned event files. If a bin has >2000 counts, and if more than 50% of those come from <1% of pixels, then it is considered to be noise-dominated and hence unusable.
| Quadrant | # 1 sec bins | Bins with >0 counts | Bins with >2000 counts | High rate bins dominated by noise | Noise dominated (total time) | Noise dominated (detector-on time) | Marked lightcurve |
|---|---|---|---|---|---|---|---|
| A | 14068 | 13143 | 0 | 0 | 0.00% | 0.00% |  |
| B | 14068 | 13093 | 0 | 0 | 0.00% | 0.00% |  |
| C | 14068 | 13145 | 0 | 0 | 0.00% | 0.00% |  |
| D | 14068 | 13082 | 0 | 0 | 0.00% | 0.00% | 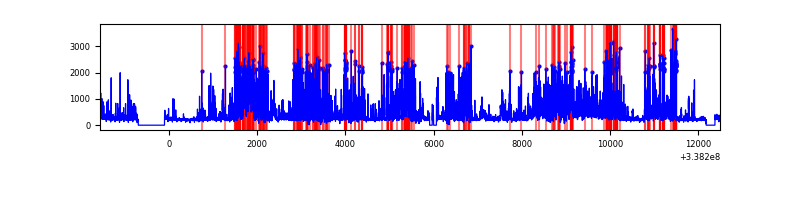 |
Top three noisy pixels from each quadrant. If the there are fewer than three noisy pixels in the level2.evt file, extra rows are filled as -1
| Pixel properties | Quadrant properties | ||||||
|---|---|---|---|---|---|---|---|
| Quadrant | DetID | PixID | Counts | Sigma | Mean | Median | Sigma |
| A | 0 | 29 | 637 | 8.76 | 199 | 187 | 51.4 |
| A | 9 | 19 | 592 | 7.88 | 199 | 187 | 51.4 |
| A | 7 | 110 | 584 | 7.72 | 199 | 187 | 51.4 |
| B | 2 | 9 | 485 | 9.84 | 161 | 154 | 33.7 |
| B | 5 | 225 | 412 | 7.67 | 161 | 154 | 33.7 |
| B | 3 | 17 | 399 | 7.28 | 161 | 154 | 33.7 |
| C | 2 | 191 | 541 | 6.79 | 201 | 189 | 51.9 |
| C | 12 | 241 | 537 | 6.71 | 201 | 189 | 51.9 |
| C | 3 | 187 | 526 | 6.5 | 201 | 189 | 51.9 |
| D | 7 | 3 | 454 | 6.54 | 169 | 154 | 45.9 |
| D | 6 | 67 | 424 | 5.89 | 169 | 154 | 45.9 |
| D | 10 | 189 | 418 | 5.76 | 169 | 154 | 45.9 |
Histogram calculated using DETX and DETY for each event in the final _common_clean file
| Quadrant A |  |
 |
Quadrant B |
|---|---|---|---|
| Quadrant D |  |
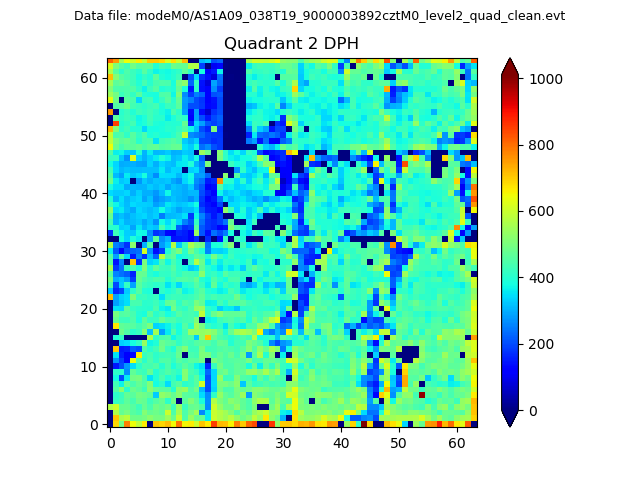 |
Quadrant C |
| Plot type | Count rate plots | Images |
|---|---|---|
| Comparison with Poisson distribution Blue bars denote a histogram of data divided into 1 sec bins. Red curve is a Poisson curve with rate = median count rate of data. |
 |
 |
| Quadrant-wise count rates Data is divided into 100 sec bins |
 |
|
| Module-wise count rates for Quadrant A Data is divided into 100 sec bins |
 |
 |
| Module-wise count rates for Quadrant B Data is divided into 100 sec bins |
 |
 |
| Module-wise count rates for Quadrant C Data is divided into 100 sec bins |
 |
 |
| Module-wise count rates for Quadrant D Data is divided into 100 sec bins |
 |
 |
| Parameter | Plot |
|---|---|
| CZT HV Monitor |  |
| D_VDD | 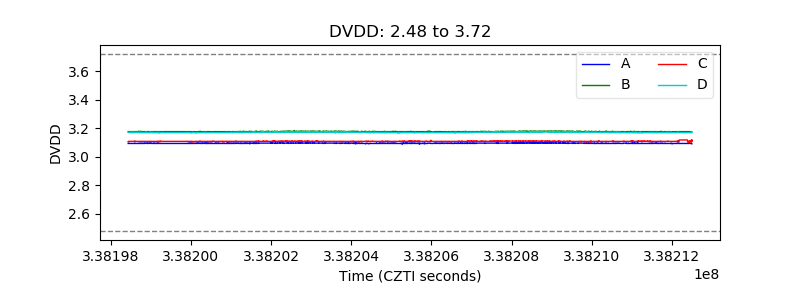 |
| Temperature 1 |  |
| Veto HV Monitor |  |
| Veto LLD |  |
| Alpha Counter |  |
| _CPM_Rate |  |
| CZT Counter |  |
| +2.5 Volts monitor |  |
| +5 Volts monitor |  |
| _ROLL_ROT |  |
| _Roll_DEC |  |
| _Roll_RA |  |
| Veto Counter |  |