| Param | Original file | Final file |
|---|---|---|
| Filename | modeM0/AS1A09_038T19_9000003892_26912cztM0_level2.evt | modeM0/AS1A09_038T19_9000003892_26912cztM0_level2_quad_clean.evt |
| Size (bytes) | 281,721,600 | 36,803,520 |
| Size | 268.7 MB | 35.1 MB |
| Events in quadrant A | 1,171,012 | 252,900 |
| Events in quadrant B | 4,613,988 | 200,768 |
| Events in quadrant C | 1,211,093 | 248,804 |
| Events in quadrant D | 1,375,649 | 243,270 |
| Mode M9 | |||
|---|---|---|---|
| Quadrant | BADHDUFLAG | Total packets | Discarded packets |
| A | 0 | 6 | 0 |
| B | 0 | 6 | 0 |
| C | 0 | 6 | 0 |
| D | 0 | 6 | 0 |
| Mode M0 | |||
|---|---|---|---|
| Quadrant | BADHDUFLAG | Total packets | Discarded packets |
| A | 0 | 4942 | 0 |
| B | 0 | 15311 | 0 |
| C | 0 | 4968 | 0 |
| D | 0 | 5586 | 0 |
| Quadrant | Total seconds | Saturated seconds | Saturation percentage |
|---|---|---|---|
| A | 2329 | 86 | 3.692572% |
| B | 2329 | 1822 | 78.231000% |
| C | 2329 | 116 | 4.980678% |
| D | 2329 | 87 | 3.735509% |
Noise dominated data is calculated using 1-second bins in cleaned event files. If a bin has >2000 counts, and if more than 50% of those come from <1% of pixels, then it is considered to be noise-dominated and hence unusable.
| Quadrant | # 1 sec bins | Bins with >0 counts | Bins with >2000 counts | High rate bins dominated by noise | Noise dominated (total time) | Noise dominated (detector-on time) | Marked lightcurve |
|---|---|---|---|---|---|---|---|
| A | 2924 | 2329 | 8 | 8 | 0.27% | 0.34% | 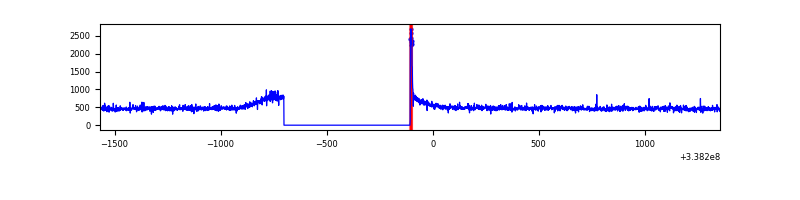 |
| B | 2923 | 2328 | 1246 | 1246 | 42.63% | 53.52% | 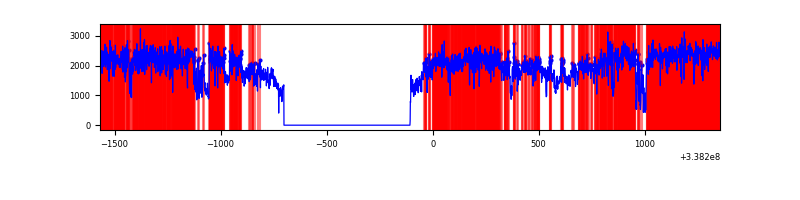 |
| C | 2924 | 2329 | 1 | 1 | 0.03% | 0.04% | 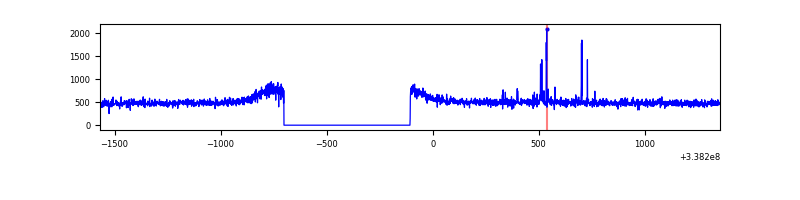 |
| D | 2924 | 2329 | 7 | 7 | 0.24% | 0.30% | 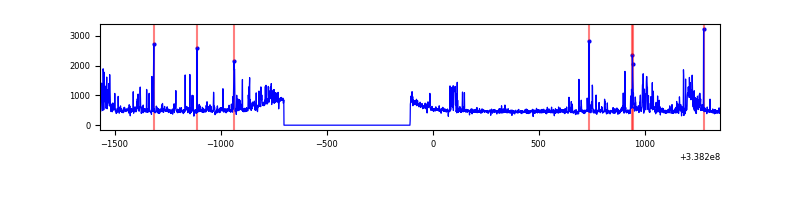 |
Top three noisy pixels from each quadrant. If the there are fewer than three noisy pixels in the level2.evt file, extra rows are filled as -1
| Pixel properties | Quadrant properties | ||||||
|---|---|---|---|---|---|---|---|
| Quadrant | DetID | PixID | Counts | Sigma | Mean | Median | Sigma |
| A | 8 | 192 | 22768 | 364.19 | 297 | 289 | 61.7 |
| A | 13 | 254 | 3117 | 45.82 | 297 | 289 | 61.7 |
| A | 3 | 137 | 2929 | 42.77 | 297 | 289 | 61.7 |
| B | 0 | 189 | 3636127 | 76902.38 | 241 | 234 | 47.3 |
| B | 10 | 245 | 17118 | 357.11 | 241 | 234 | 47.3 |
| B | 3 | 64 | 6626 | 135.2 | 241 | 234 | 47.3 |
| C | 14 | 238 | 47059 | 668.39 | 294 | 294 | 70.0 |
| C | 15 | 208 | 18662 | 262.52 | 294 | 294 | 70.0 |
| C | 13 | 61 | 2003 | 24.43 | 294 | 294 | 70.0 |
| D | 1 | 52 | 214610 | 3068.59 | 294 | 285 | 69.8 |
| D | 11 | 176 | 20290 | 286.42 | 294 | 285 | 69.8 |
| D | 7 | 80 | 13421 | 188.07 | 294 | 285 | 69.8 |
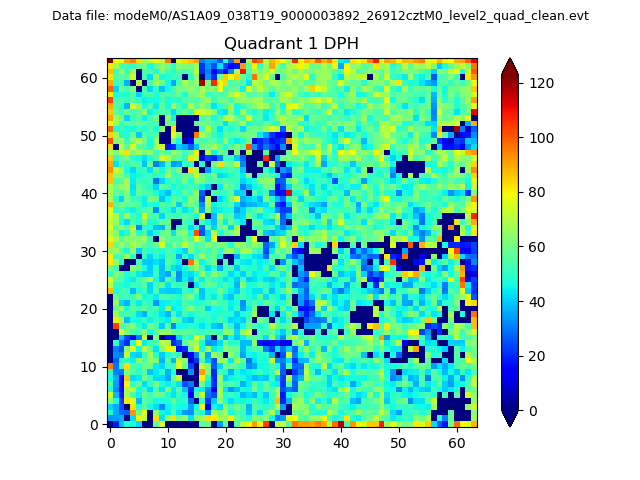
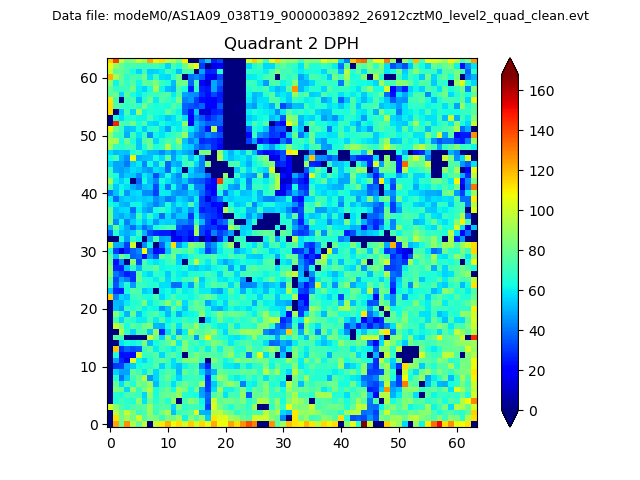
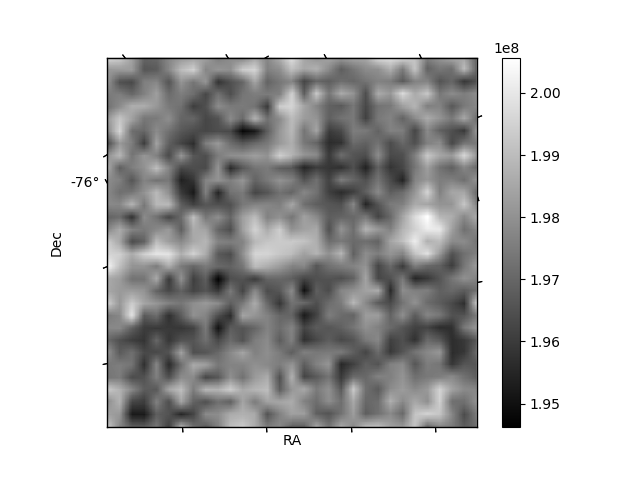
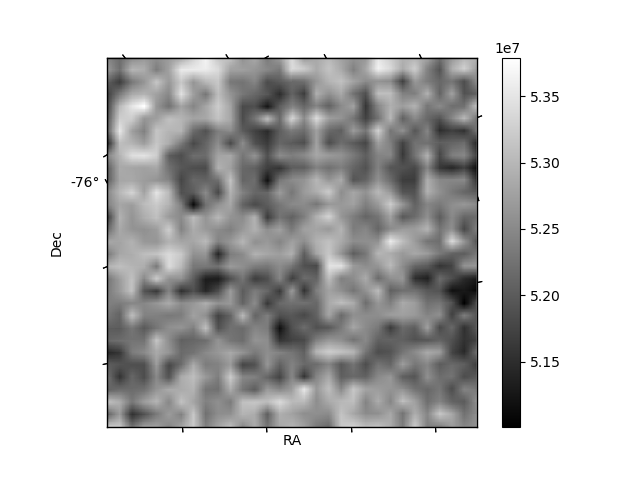
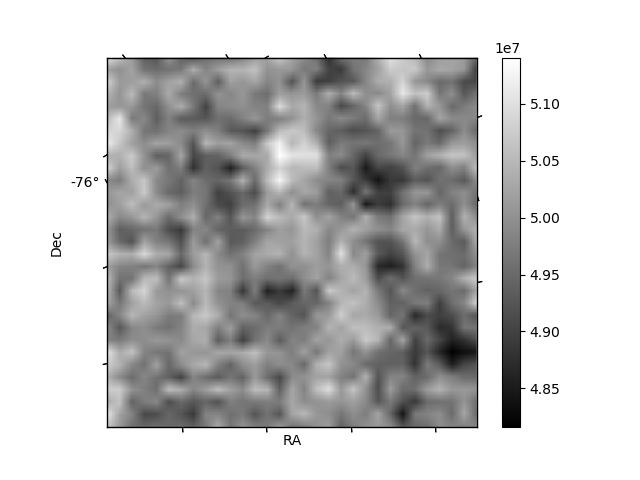
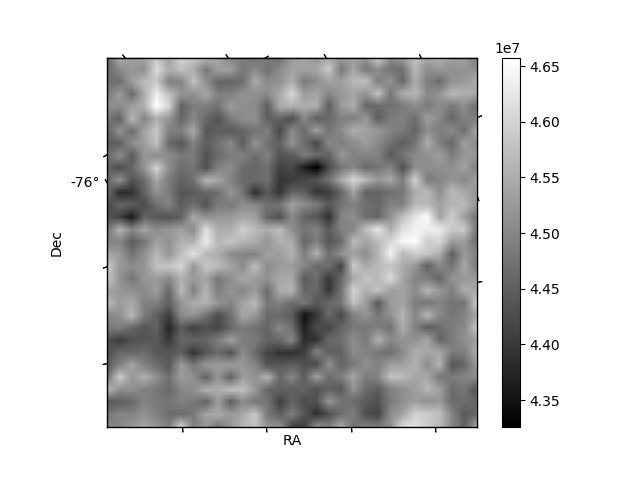
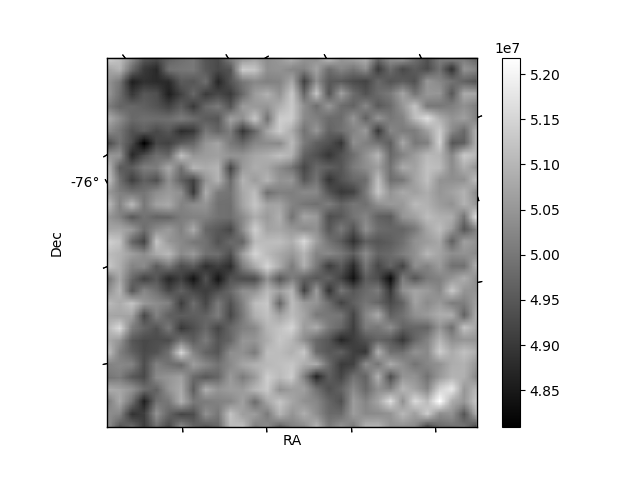
Histogram calculated using DETX and DETY for each event in the final _common_clean file
| Quadrant A |  |
 |
Quadrant B |
|---|---|---|---|
| Quadrant D | 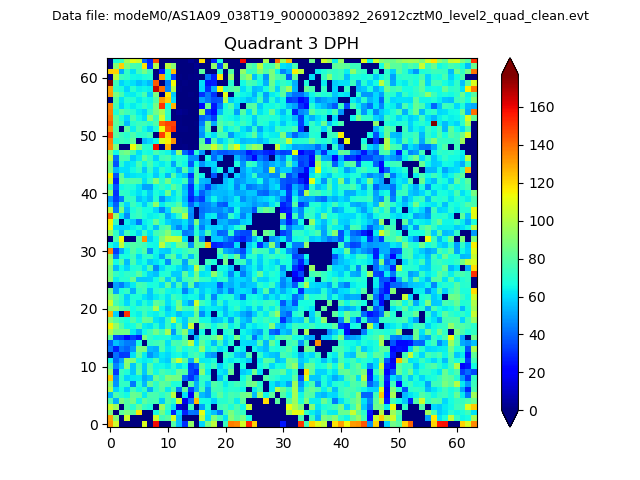 |
 |
Quadrant C |
| Plot type | Count rate plots | Images |
|---|---|---|
| Comparison with Poisson distribution Blue bars denote a histogram of data divided into 1 sec bins. Red curve is a Poisson curve with rate = median count rate of data. |
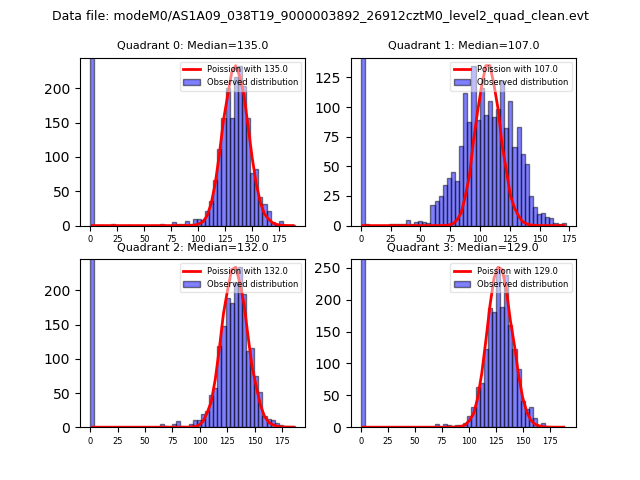 |
 |
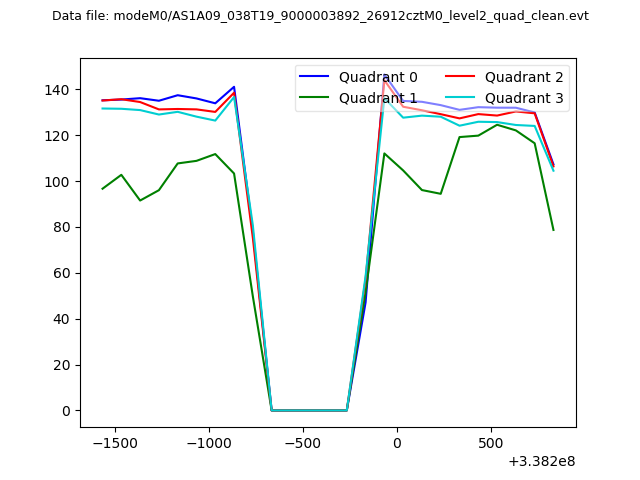
| Quadrant-wise count rates Data is divided into 100 sec bins |
 |
|
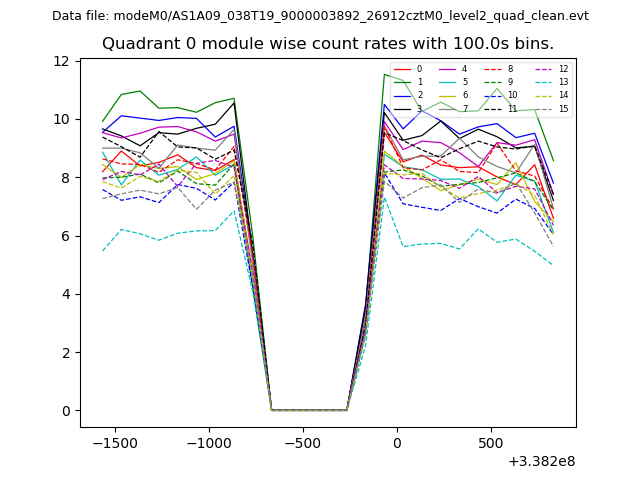
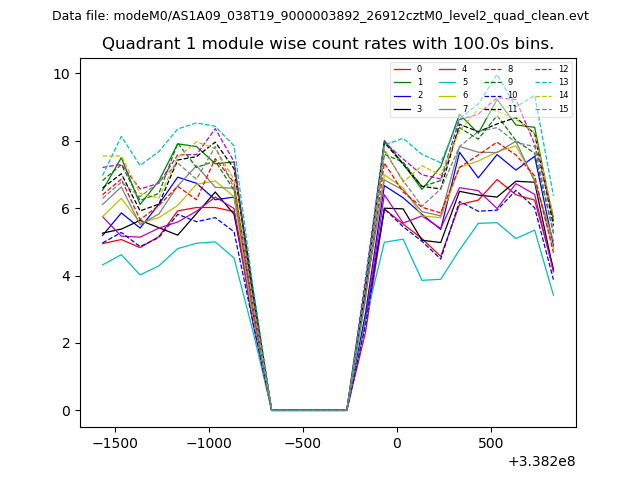
| Module-wise count rates for Quadrant A Data is divided into 100 sec bins |
 |
 |
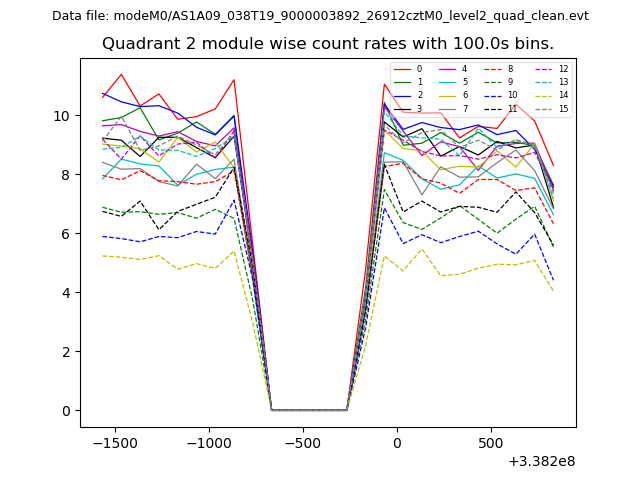
| Module-wise count rates for Quadrant B Data is divided into 100 sec bins |
 |
 |
| Module-wise count rates for Quadrant C Data is divided into 100 sec bins |
 |
 |
| Module-wise count rates for Quadrant D Data is divided into 100 sec bins |
 |
 |
| Parameter | Plot |
|---|---|
| CZT HV Monitor | 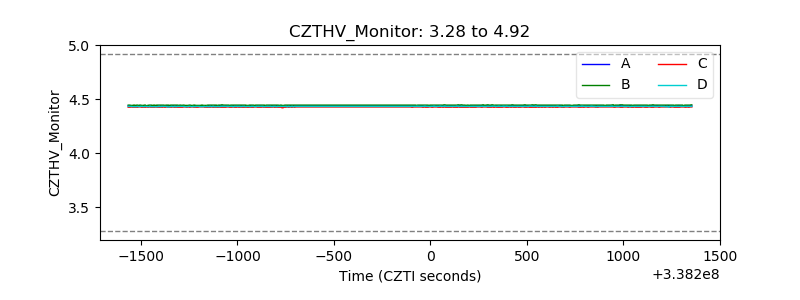 |
| D_VDD | 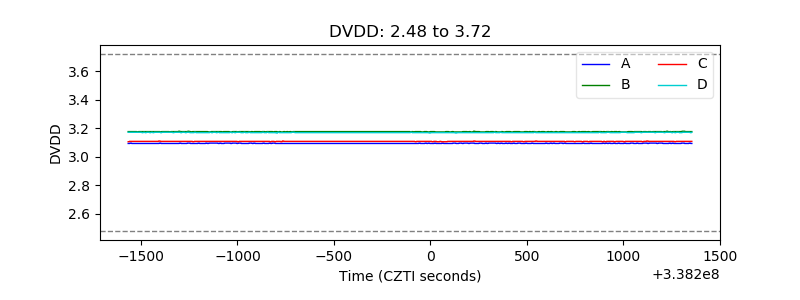 |
| Temperature 1 | 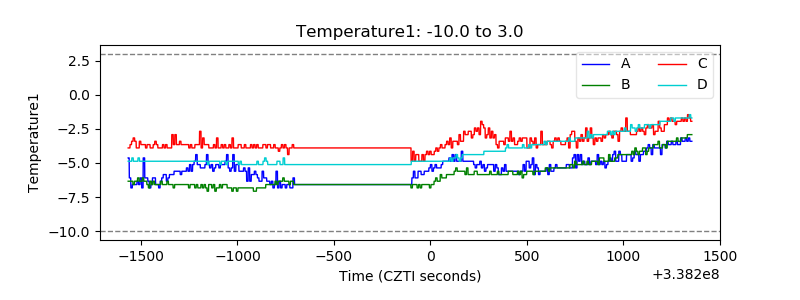 |
| Veto HV Monitor | 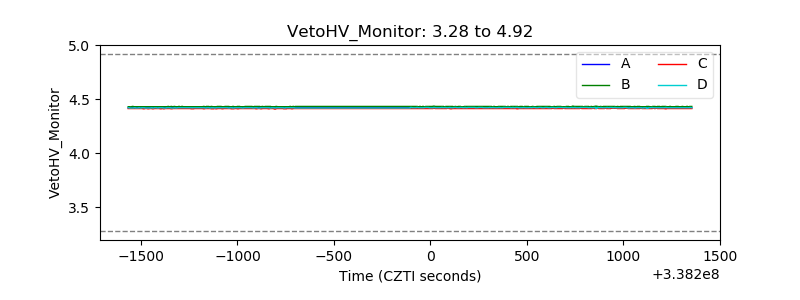 |
| Veto LLD | 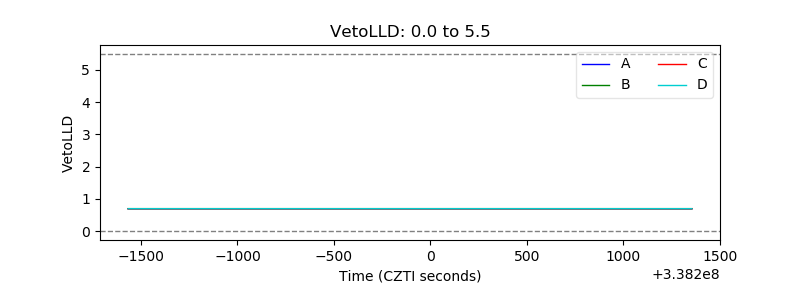 |
| Alpha Counter | 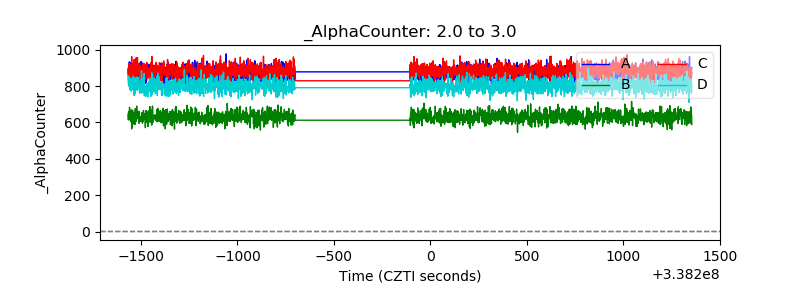 |
| _CPM_Rate | 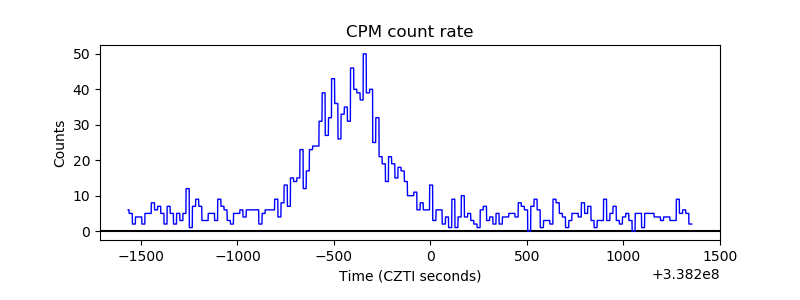 |
| CZT Counter | 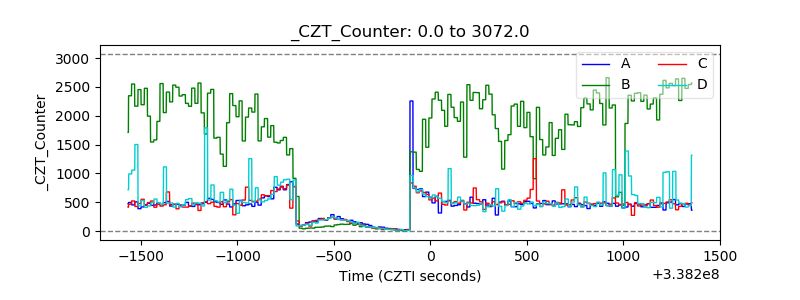 |
| +2.5 Volts monitor |  |
| +5 Volts monitor |  |
| _ROLL_ROT |  |
| _Roll_DEC | 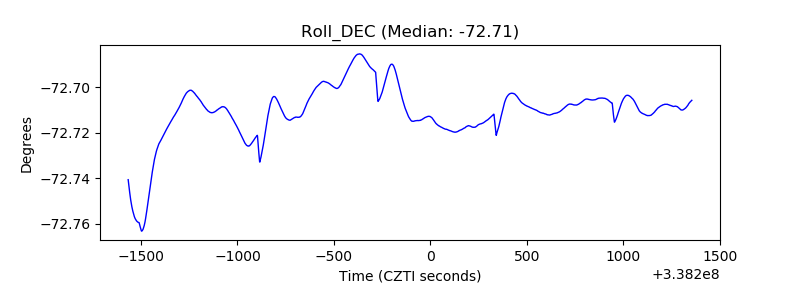 |
| _Roll_RA | 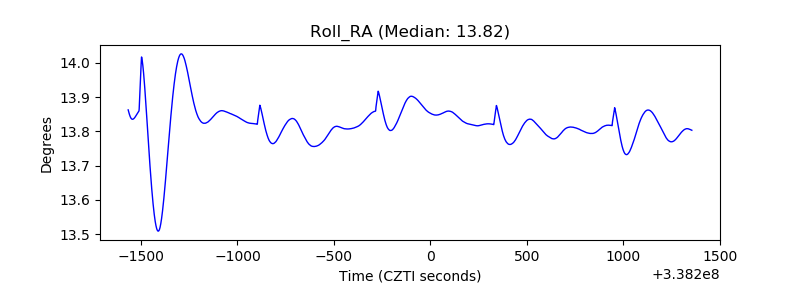 |
| Veto Counter | 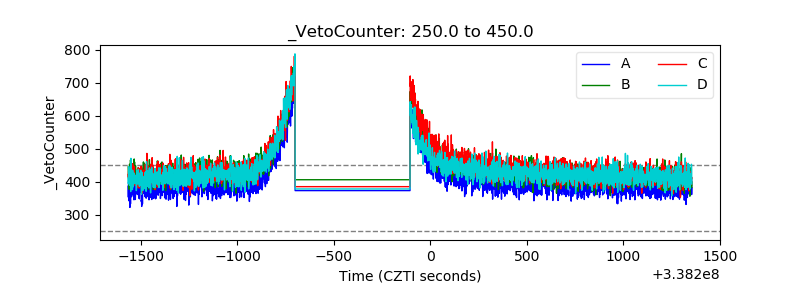 |