| Param | Original file | Final file |
|---|---|---|
| Filename | modeM0/AS1A09_038T19_9000003892_26913cztM0_level2.evt | modeM0/AS1A09_038T19_9000003892_26913cztM0_level2_quad_clean.evt |
| Size (bytes) | 782,858,880 | 115,110,720 |
| Size | 746.6 MB | 109.8 MB |
| Events in quadrant A | 3,431,840 | 808,188 |
| Events in quadrant B | 8,286,129 | 713,604 |
| Events in quadrant C | 3,499,161 | 806,938 |
| Events in quadrant D | 8,005,341 | 655,622 |
| Mode M0 | |||
|---|---|---|---|
| Quadrant | BADHDUFLAG | Total packets | Discarded packets |
| A | 0 | 14842 | 0 |
| B | 0 | 29261 | 0 |
| C | 0 | 14921 | 0 |
| D | 0 | 28552 | 0 |
| Quadrant | Total seconds | Saturated seconds | Saturation percentage |
|---|---|---|---|
| A | 7171 | 239 | 3.332868% |
| B | 7172 | 2362 | 32.933631% |
| C | 7172 | 275 | 3.834356% |
| D | 7172 | 1977 | 27.565533% |
Noise dominated data is calculated using 1-second bins in cleaned event files. If a bin has >2000 counts, and if more than 50% of those come from <1% of pixels, then it is considered to be noise-dominated and hence unusable.
| Quadrant | # 1 sec bins | Bins with >0 counts | Bins with >2000 counts | High rate bins dominated by noise | Noise dominated (total time) | Noise dominated (detector-on time) | Marked lightcurve |
|---|---|---|---|---|---|---|---|
| A | 7296 | 7171 | 0 | 0 | 0.00% | 0.00% | 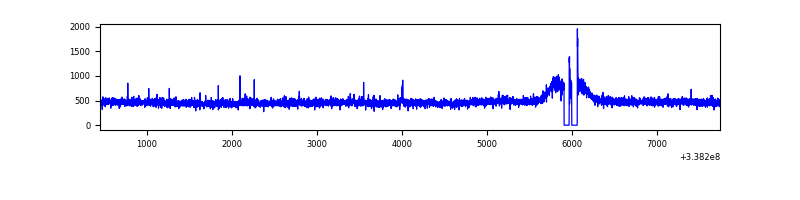 |
| B | 7297 | 7172 | 1903 | 1903 | 26.08% | 26.53% | 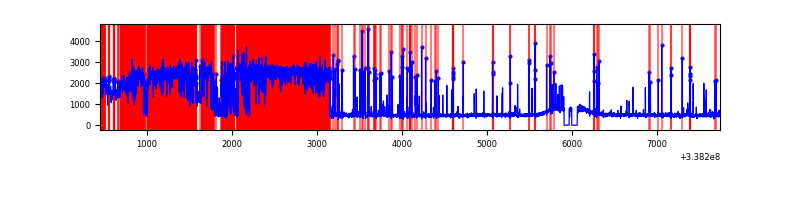 |
| C | 7297 | 7173 | 3 | 3 | 0.04% | 0.04% | 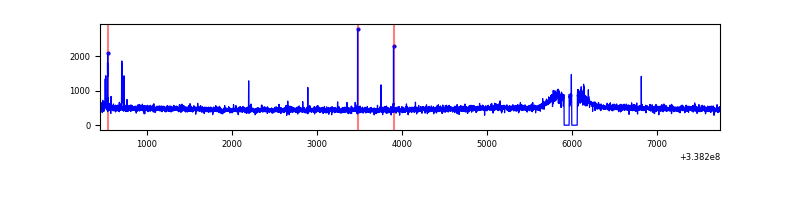 |
| D | 7297 | 7172 | 1494 | 1494 | 20.47% | 20.83% | 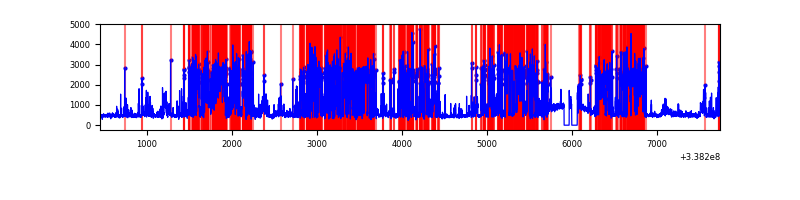 |
Top three noisy pixels from each quadrant. If the there are fewer than three noisy pixels in the level2.evt file, extra rows are filled as -1
| Pixel properties | Quadrant properties | ||||||
|---|---|---|---|---|---|---|---|
| Quadrant | DetID | PixID | Counts | Sigma | Mean | Median | Sigma |
| A | 5 | 168 | 31536 | 174.87 | 874 | 852 | 175.5 |
| A | 0 | 13 | 15695 | 84.59 | 874 | 852 | 175.5 |
| A | 8 | 192 | 15030 | 80.8 | 874 | 852 | 175.5 |
| B | 0 | 189 | 5036582 | 34043.57 | 774 | 752 | 147.9 |
| B | 0 | 190 | 99059 | 664.58 | 774 | 752 | 147.9 |
| B | 10 | 245 | 85435 | 572.48 | 774 | 752 | 147.9 |
| C | 14 | 238 | 135960 | 685.59 | 853 | 858 | 197.1 |
| C | 15 | 208 | 33178 | 164.01 | 853 | 858 | 197.1 |
| C | 13 | 61 | 5840 | 25.28 | 853 | 858 | 197.1 |
| D | 1 | 52 | 4453123 | 25201.62 | 749 | 727 | 176.7 |
| D | 7 | 80 | 493170 | 2787.34 | 749 | 727 | 176.7 |
| D | 2 | 250 | 149755 | 843.53 | 749 | 727 | 176.7 |
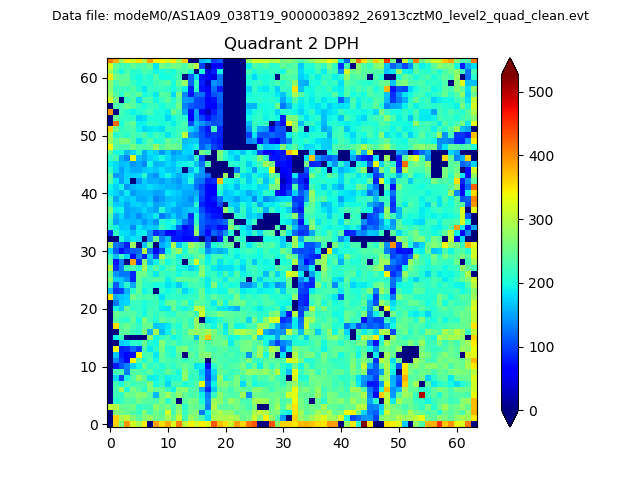
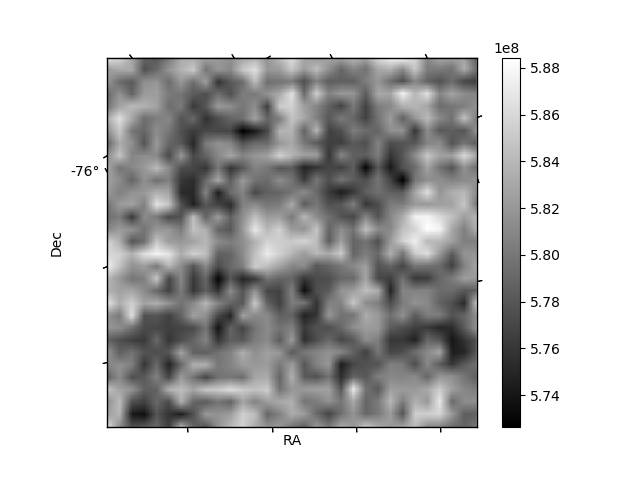
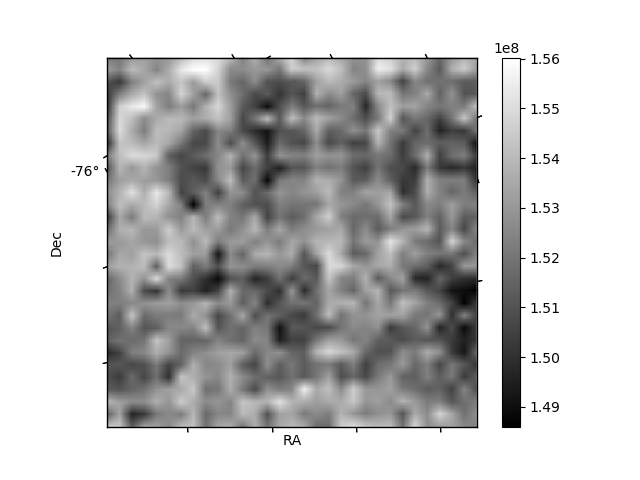
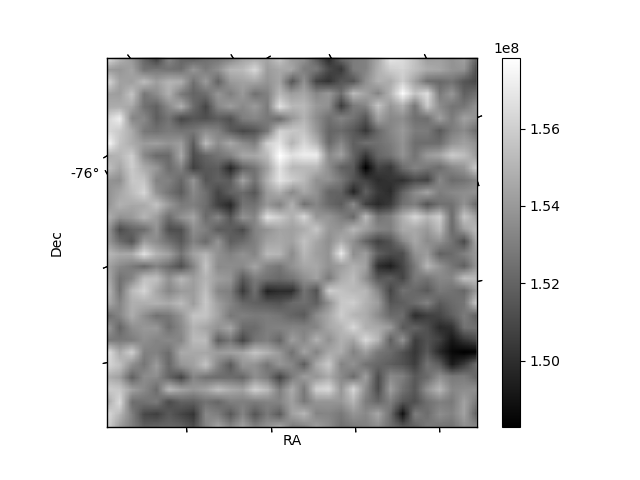
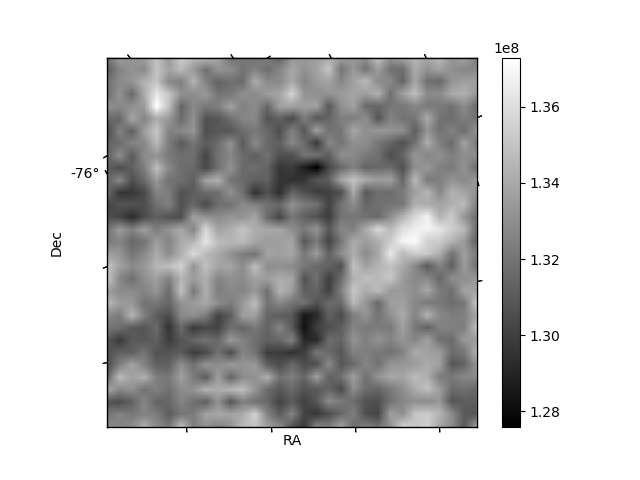
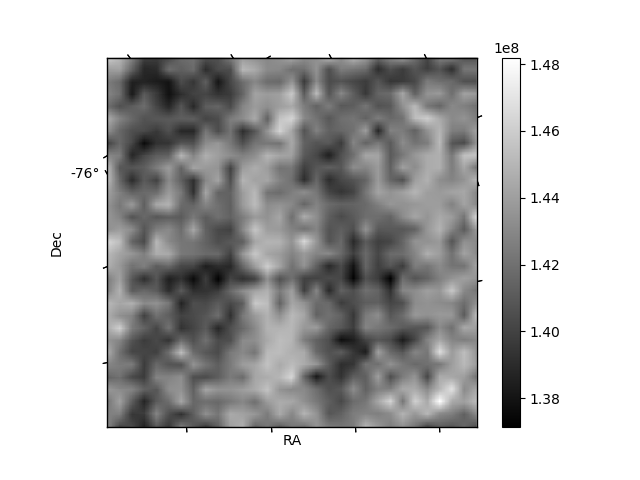
Histogram calculated using DETX and DETY for each event in the final _common_clean file
| Quadrant A | 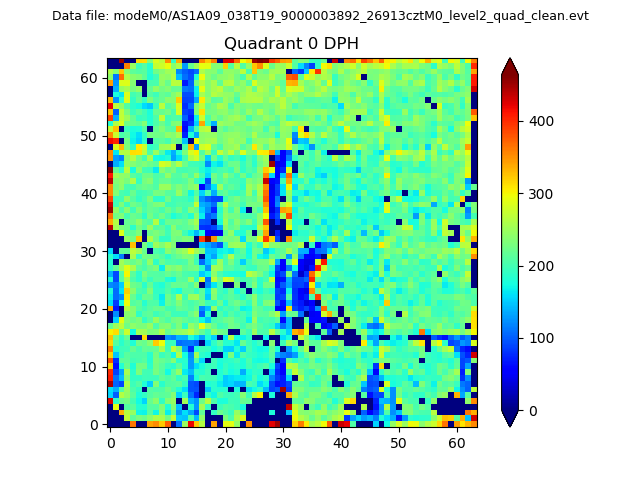 |
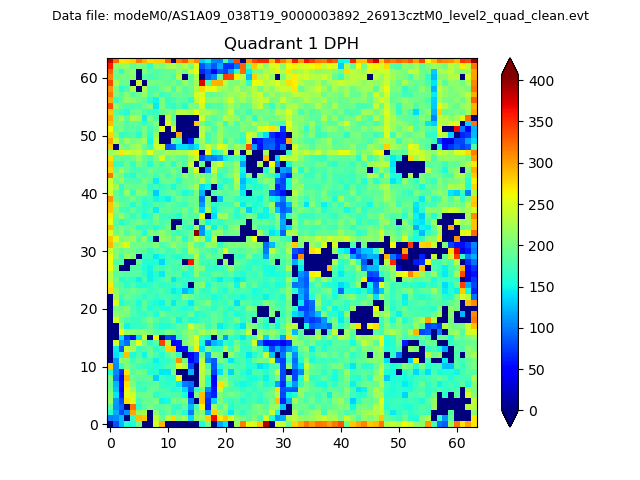 |
Quadrant B |
|---|---|---|---|
| Quadrant D | 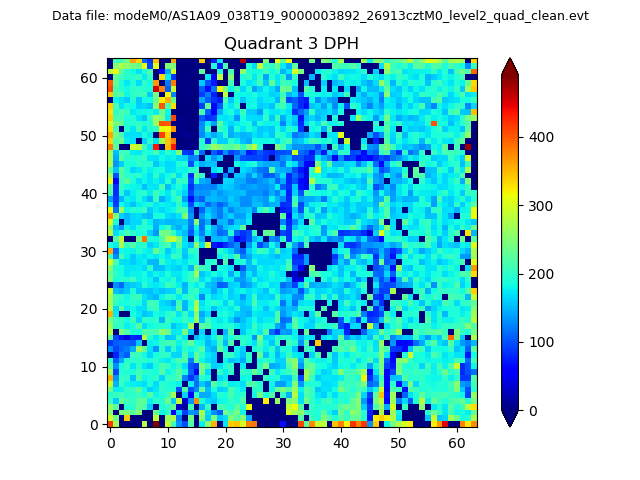 |
 |
Quadrant C |
| Plot type | Count rate plots | Images |
|---|---|---|
| Comparison with Poisson distribution Blue bars denote a histogram of data divided into 1 sec bins. Red curve is a Poisson curve with rate = median count rate of data. |
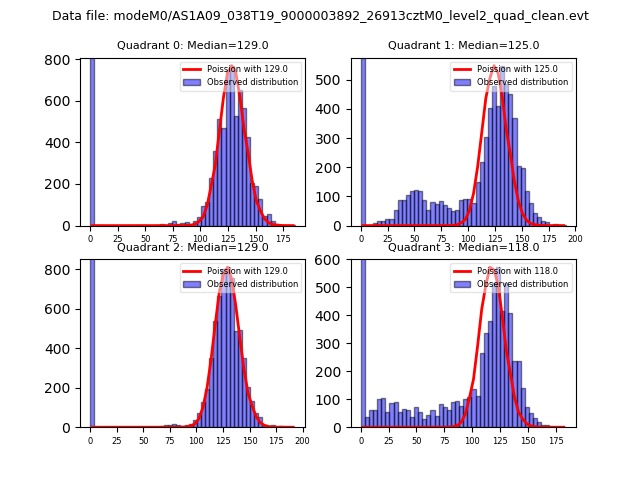 |
 |
| Quadrant-wise count rates Data is divided into 100 sec bins |
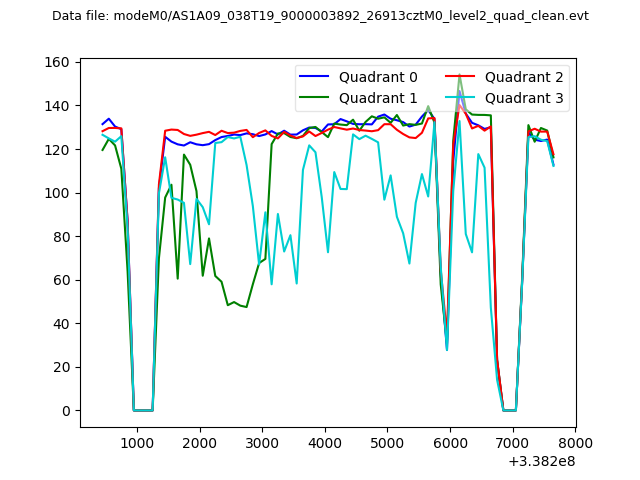 |
|
| Module-wise count rates for Quadrant A Data is divided into 100 sec bins |
 |
 |
| Module-wise count rates for Quadrant B Data is divided into 100 sec bins |
 |
 |
| Module-wise count rates for Quadrant C Data is divided into 100 sec bins |
 |
 |
| Module-wise count rates for Quadrant D Data is divided into 100 sec bins |
 |
 |
| Parameter | Plot |
|---|---|
| CZT HV Monitor |  |
| D_VDD | 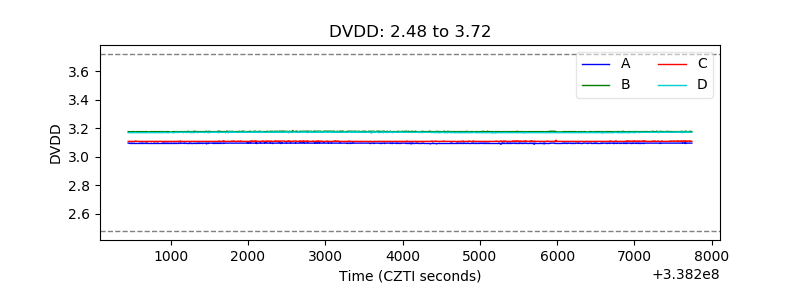 |
| Temperature 1 | 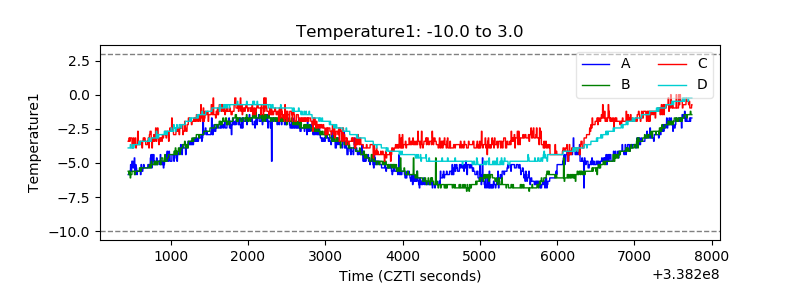 |
| Veto HV Monitor | 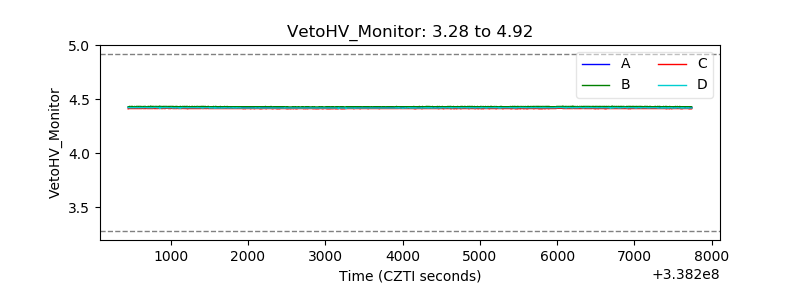 |
| Veto LLD | 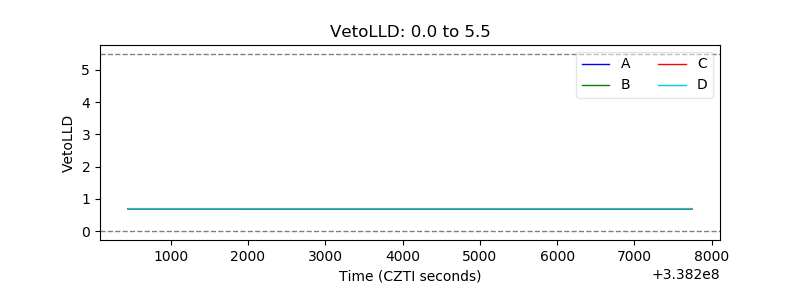 |
| Alpha Counter | 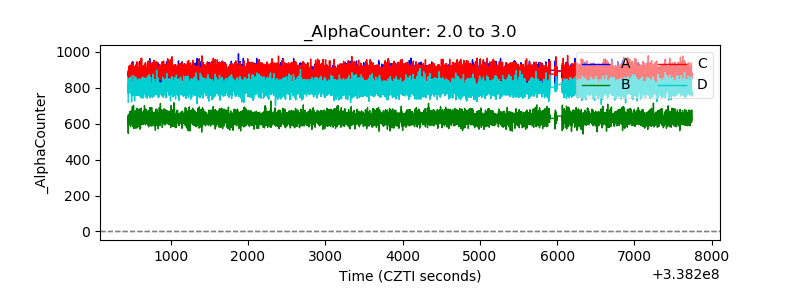 |
| _CPM_Rate | 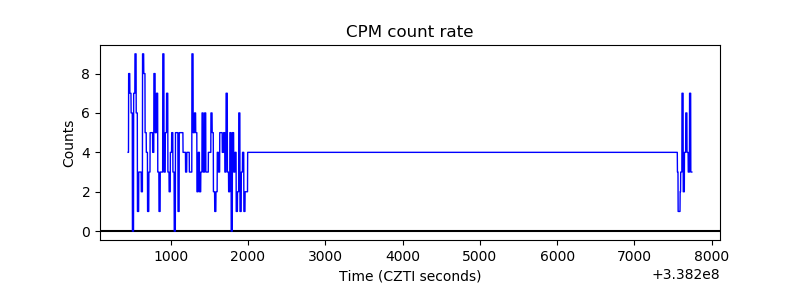 |
| CZT Counter | 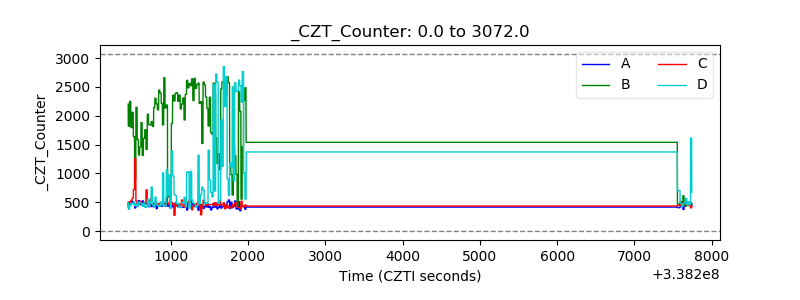 |
| +2.5 Volts monitor |  |
| +5 Volts monitor |  |
| _ROLL_ROT |  |
| _Roll_DEC | 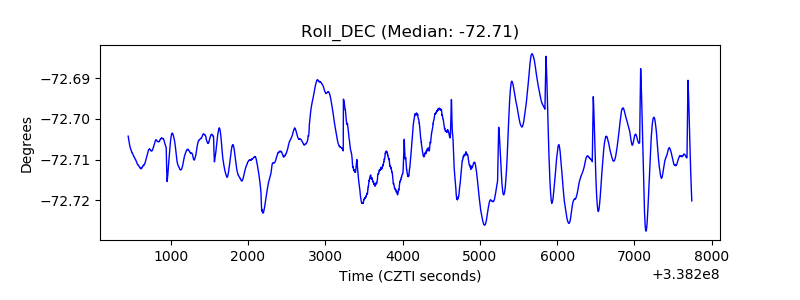 |
| _Roll_RA | 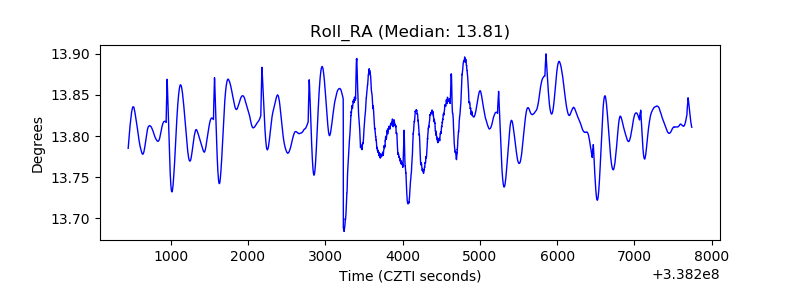 |
| Veto Counter |  |