| Param | Original file | Final file |
|---|---|---|
| Filename | modeM0/AS1A09_038T19_9000003892_26917cztM0_level2.evt | modeM0/AS1A09_038T19_9000003892_26917cztM0_level2_quad_clean.evt |
| Size (bytes) | 560,105,280 | 92,419,200 |
| Size | 534.2 MB | 88.1 MB |
| Events in quadrant A | 2,505,855 | 644,139 |
| Events in quadrant B | 6,743,049 | 552,133 |
| Events in quadrant C | 2,519,144 | 644,612 |
| Events in quadrant D | 4,833,480 | 584,066 |
| Mode M9 | |||
|---|---|---|---|
| Quadrant | BADHDUFLAG | Total packets | Discarded packets |
| A | 0 | 2 | 0 |
| B | 0 | 2 | 0 |
| C | 0 | 2 | 0 |
| D | 0 | 2 | 0 |
| Mode M0 | |||
|---|---|---|---|
| Quadrant | BADHDUFLAG | Total packets | Discarded packets |
| A | 0 | 11001 | 0 |
| B | 0 | 23596 | 0 |
| C | 0 | 10967 | 0 |
| D | 0 | 17973 | 0 |
| Quadrant | Total seconds | Saturated seconds | Saturation percentage |
|---|---|---|---|
| A | 5321 | 168 | 3.157301% |
| B | 5322 | 1949 | 36.621571% |
| C | 5322 | 191 | 3.588876% |
| D | 5322 | 712 | 13.378429% |
Noise dominated data is calculated using 1-second bins in cleaned event files. If a bin has >2000 counts, and if more than 50% of those come from <1% of pixels, then it is considered to be noise-dominated and hence unusable.
| Quadrant | # 1 sec bins | Bins with >0 counts | Bins with >2000 counts | High rate bins dominated by noise | Noise dominated (total time) | Noise dominated (detector-on time) | Marked lightcurve |
|---|---|---|---|---|---|---|---|
| A | 5521 | 5321 | 8 | 8 | 0.14% | 0.15% | 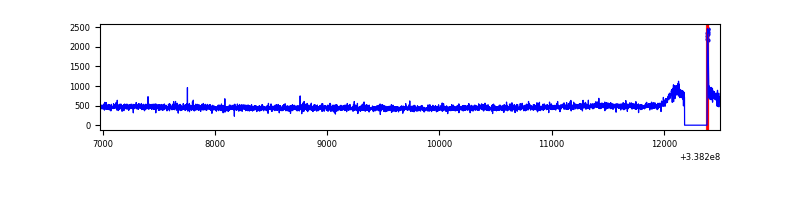 |
| B | 5522 | 5322 | 1245 | 1245 | 22.55% | 23.39% | 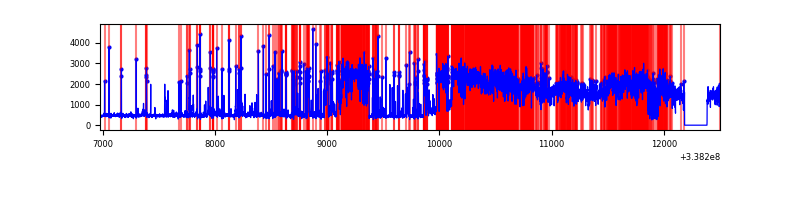 |
| C | 5522 | 5322 | 0 | 0 | 0.00% | 0.00% | 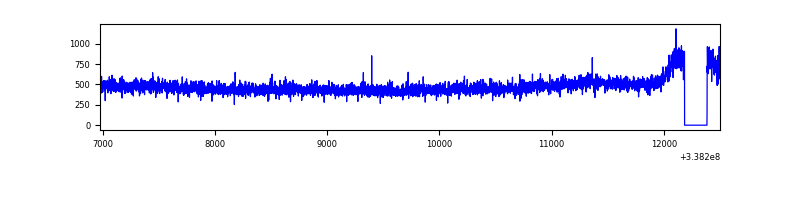 |
| D | 5522 | 5322 | 551 | 551 | 9.98% | 10.35% | 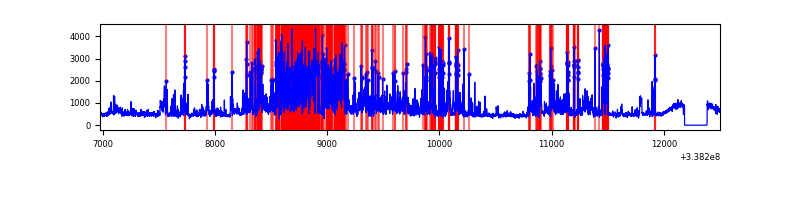 |
Top three noisy pixels from each quadrant. If the there are fewer than three noisy pixels in the level2.evt file, extra rows are filled as -1
| Pixel properties | Quadrant properties | ||||||
|---|---|---|---|---|---|---|---|
| Quadrant | DetID | PixID | Counts | Sigma | Mean | Median | Sigma |
| A | 8 | 192 | 25363 | 191.79 | 634 | 619 | 129.0 |
| A | 5 | 168 | 24533 | 185.36 | 634 | 619 | 129.0 |
| A | 13 | 254 | 8710 | 62.71 | 634 | 619 | 129.0 |
| B | 0 | 189 | 4156569 | 38644.85 | 554 | 539 | 107.5 |
| B | 10 | 246 | 167687 | 1554.23 | 554 | 539 | 107.5 |
| B | 3 | 64 | 151708 | 1405.65 | 554 | 539 | 107.5 |
| C | 14 | 238 | 99218 | 675.73 | 620 | 621 | 145.9 |
| C | 13 | 61 | 4266 | 24.98 | 620 | 621 | 145.9 |
| C | 15 | 208 | 3533 | 19.96 | 620 | 621 | 145.9 |
| D | 1 | 52 | 1376091 | 9778.93 | 592 | 574 | 140.7 |
| D | 7 | 80 | 837808 | 5952.13 | 592 | 574 | 140.7 |
| D | 2 | 250 | 236442 | 1676.85 | 592 | 574 | 140.7 |
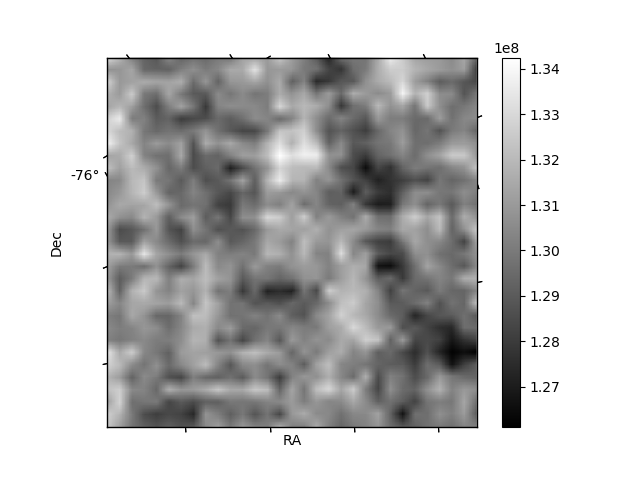
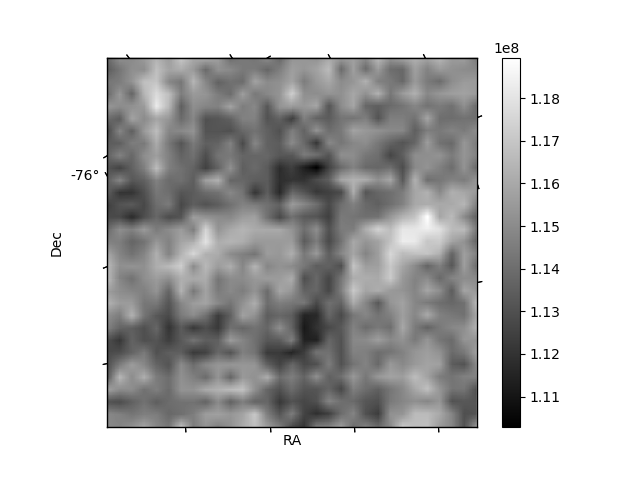
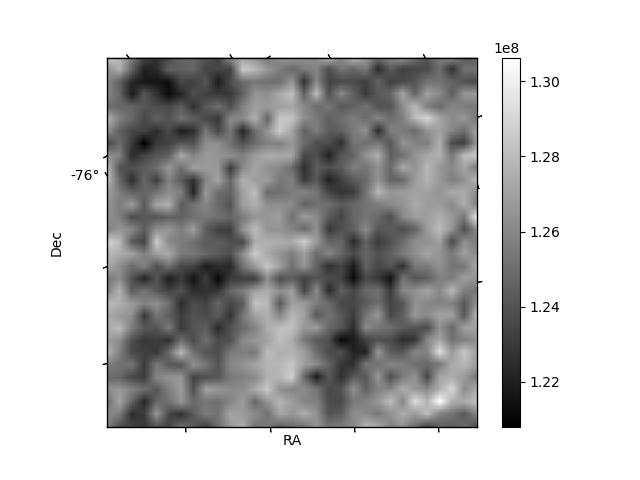
Histogram calculated using DETX and DETY for each event in the final _common_clean file
| Quadrant A | 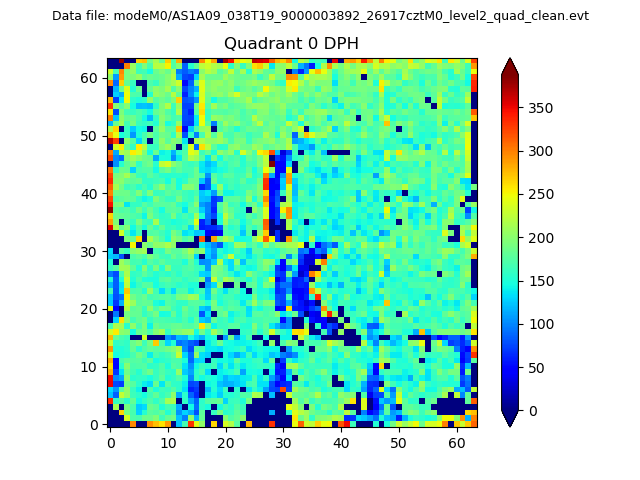 |
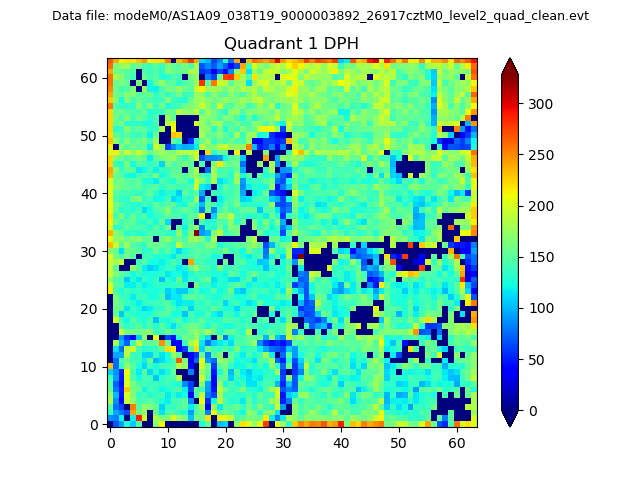 |
Quadrant B |
|---|---|---|---|
| Quadrant D | 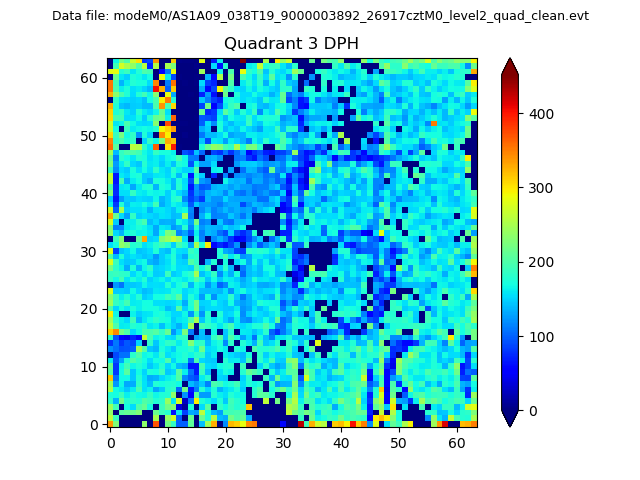 |
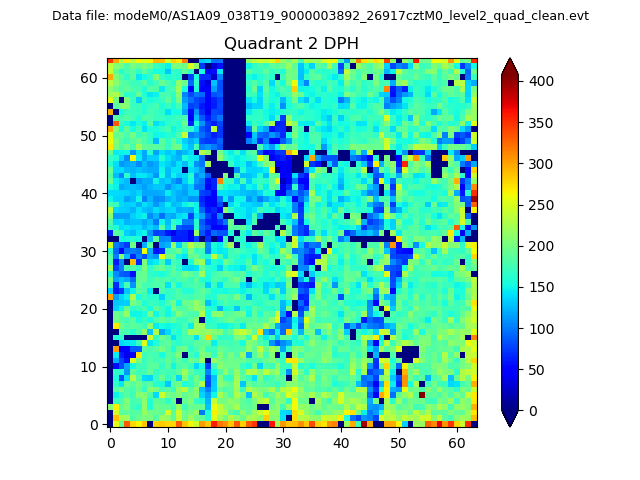 |
Quadrant C |
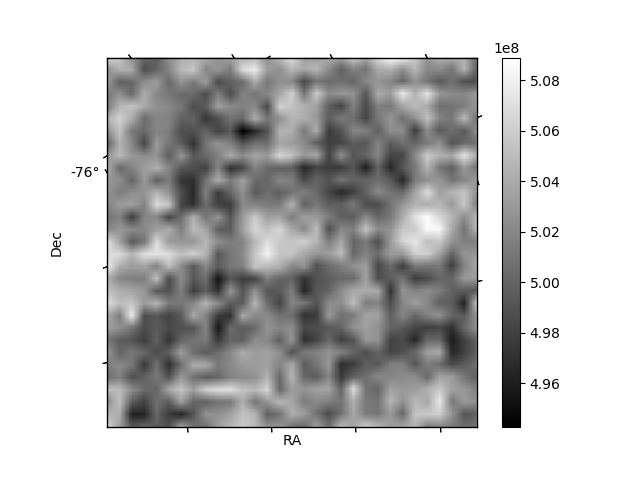
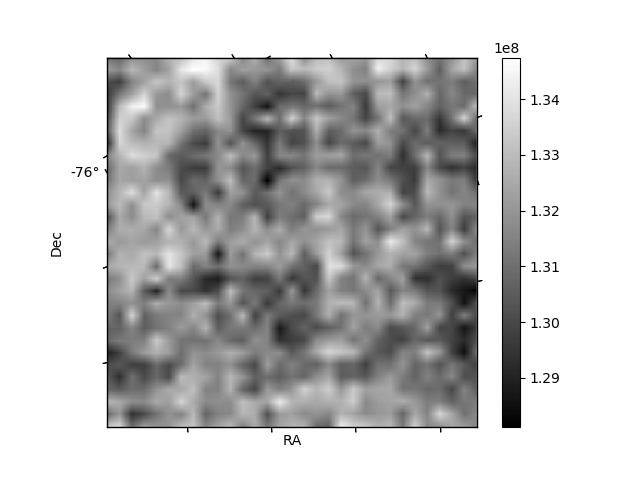
| Plot type | Count rate plots | Images |
|---|---|---|
| Comparison with Poisson distribution Blue bars denote a histogram of data divided into 1 sec bins. Red curve is a Poisson curve with rate = median count rate of data. |
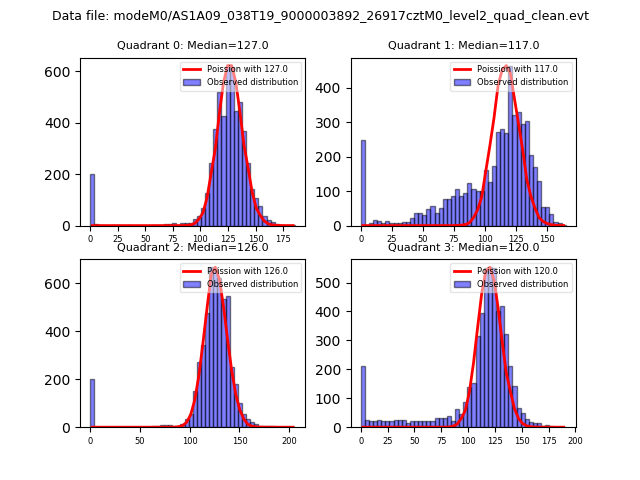 |
 |
| Quadrant-wise count rates Data is divided into 100 sec bins |
 |
|
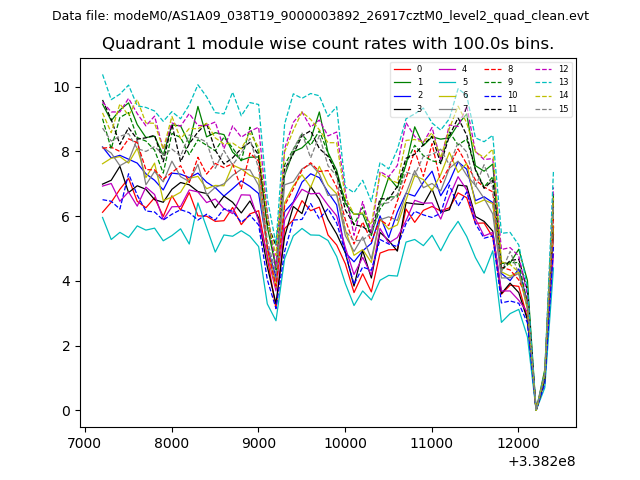
| Module-wise count rates for Quadrant A Data is divided into 100 sec bins |
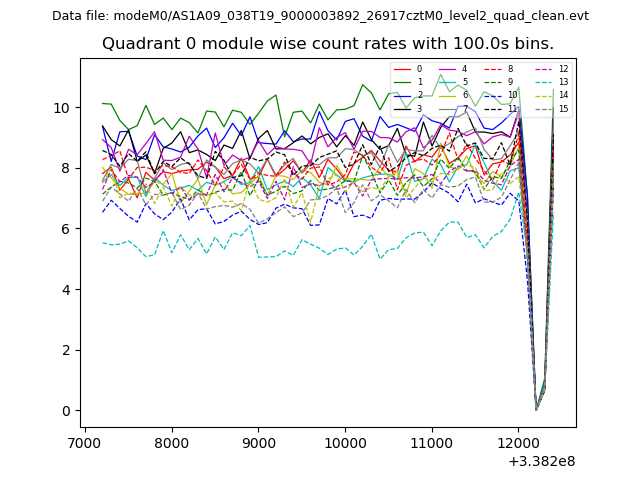 |
 |
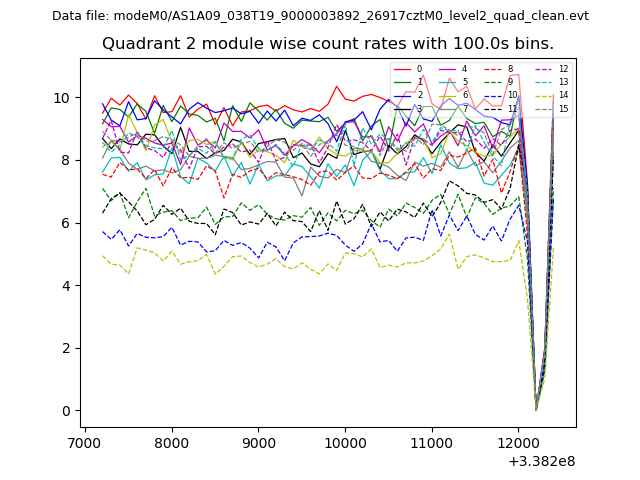
| Module-wise count rates for Quadrant B Data is divided into 100 sec bins |
 |
 |
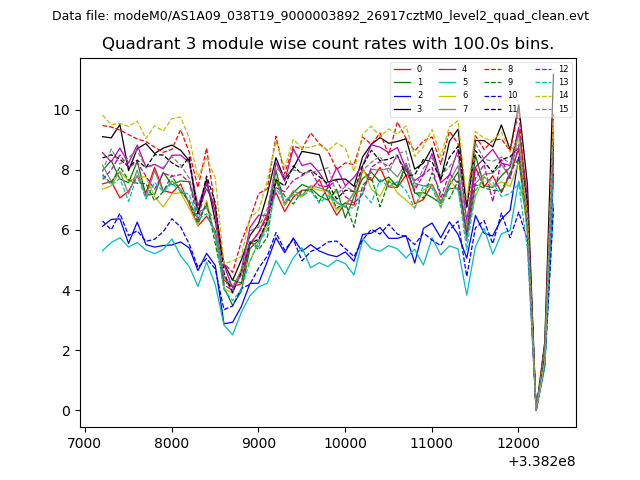
| Module-wise count rates for Quadrant C Data is divided into 100 sec bins |
 |
 |
| Module-wise count rates for Quadrant D Data is divided into 100 sec bins |
 |
 |
| Parameter | Plot |
|---|---|
| CZT HV Monitor | 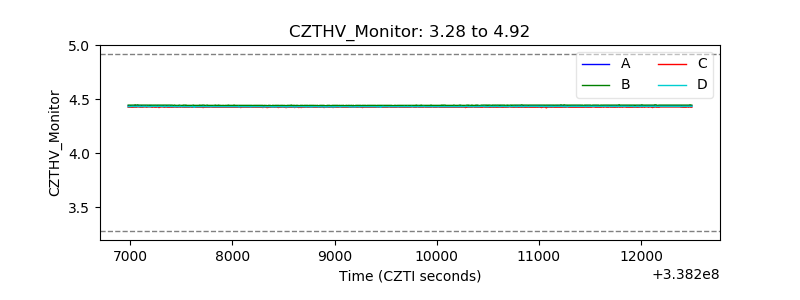 |
| D_VDD | 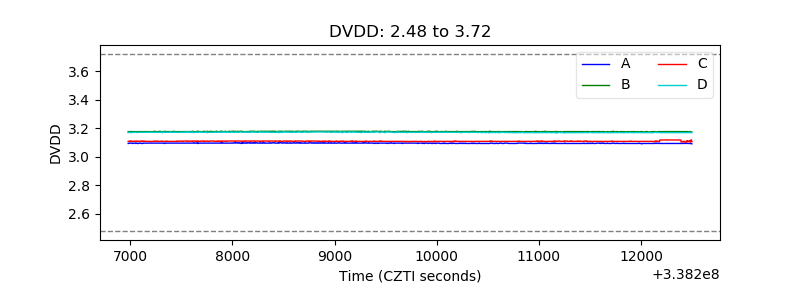 |
| Temperature 1 | 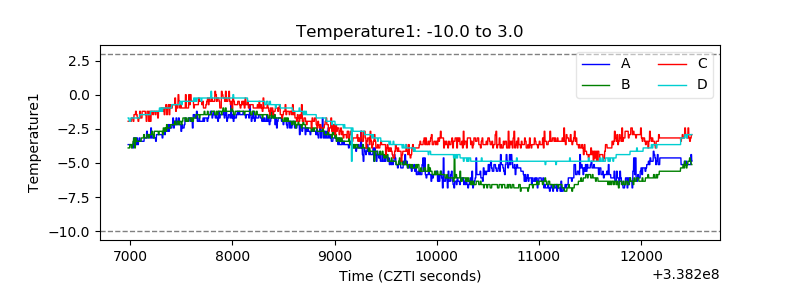 |
| Veto HV Monitor | 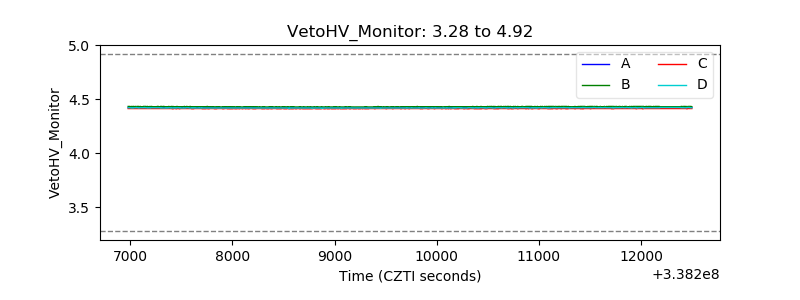 |
| Veto LLD | 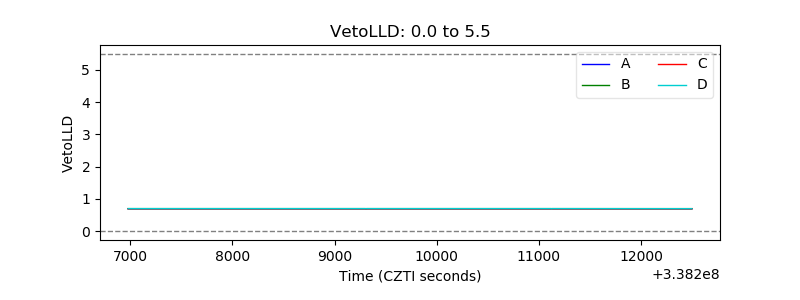 |
| Alpha Counter |  |
| _CPM_Rate | 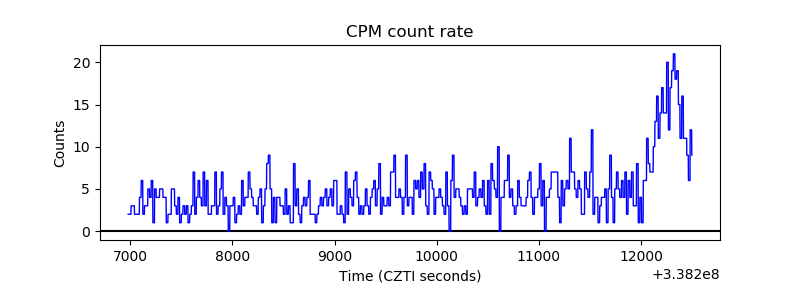 |
| CZT Counter | 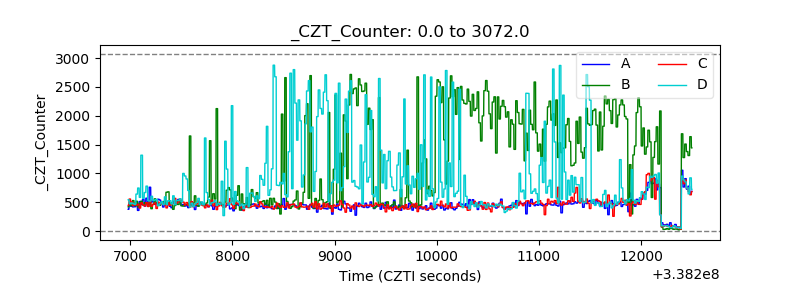 |
| +2.5 Volts monitor |  |
| +5 Volts monitor |  |
| _ROLL_ROT | 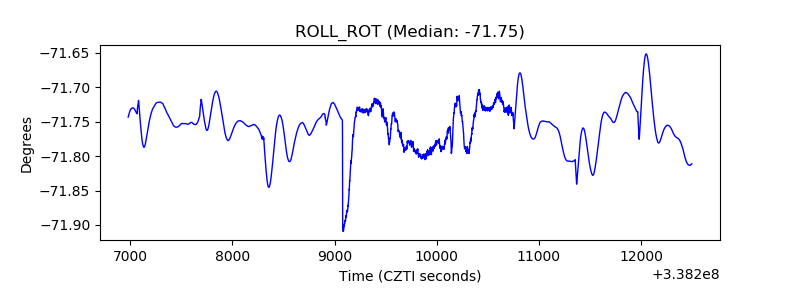 |
| _Roll_DEC | 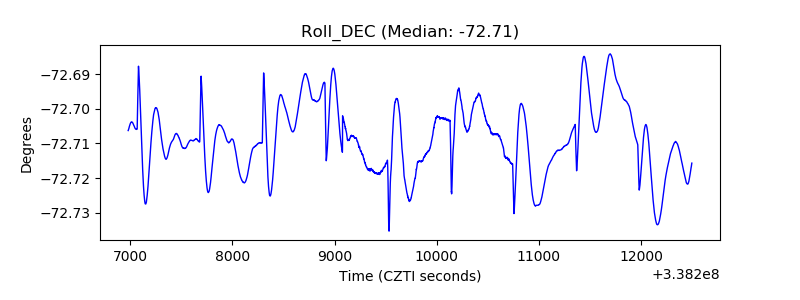 |
| _Roll_RA | 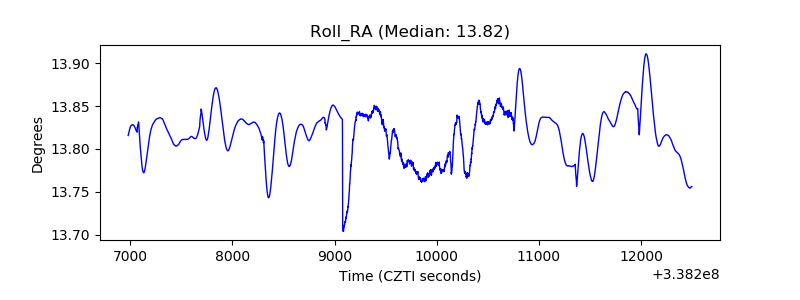 |
| Veto Counter | 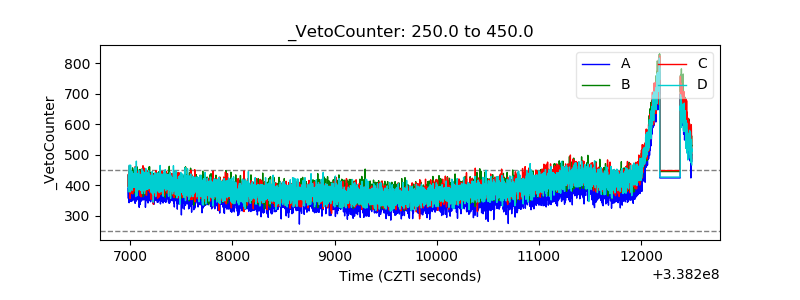 |