| Param | Original file | Final file |
|---|---|---|
| Filename | modeM0/AS1A09_134T01_9000003896cztM0_level2.fits | modeM0/AS1A09_134T01_9000003896cztM0_level2_quad_clean.evt |
| Size (bytes) | 1,809,123,840 | 1,380,144,960 |
| Size | 1.7 GB | 1.3 GB |
| Events in quadrant A | 8,272,334 | 4,881,648 |
| Events in quadrant B | 10,657,826 | 7,521,533 |
| Events in quadrant C | 12,184,010 | 8,765,558 |
| Events in quadrant D | 10,208,762 | 7,223,789 |
| Mode SS | |||
|---|---|---|---|
| Quadrant | BADHDUFLAG | Total packets | Discarded packets |
| A | 0 | 3882 | 0 |
| B | 0 | 3988 | 0 |
| C | 0 | 3988 | 0 |
| D | 0 | 3988 | 0 |
| Mode M9 | |||
|---|---|---|---|
| Quadrant | BADHDUFLAG | Total packets | Discarded packets |
| A | 0 | 335 | 0 |
| B | 0 | 336 | 0 |
| C | 0 | 336 | 0 |
| D | 0 | 336 | 0 |
| Mode M0 | |||
|---|---|---|---|
| Quadrant | BADHDUFLAG | Total packets | Discarded packets |
| A | 0 | 957784 | 0 |
| B | 0 | 731757 | 0 |
| C | 0 | 415971 | 0 |
| D | 0 | 625198 | 0 |
| Quadrant | Total seconds | Saturated seconds | Saturation percentage |
|---|---|---|---|
| A | 195621 | 91385 | 46.715332% |
| B | 195621 | 45405 | 23.210698% |
| C | 195621 | 3489 | 1.783551% |
| D | 195620 | 17435 | 8.912688% |
Noise dominated data is calculated using 1-second bins in cleaned event files. If a bin has >2000 counts, and if more than 50% of those come from <1% of pixels, then it is considered to be noise-dominated and hence unusable.
| Quadrant | # 1 sec bins | Bins with >0 counts | Bins with >2000 counts | High rate bins dominated by noise | Noise dominated (total time) | Noise dominated (detector-on time) | Marked lightcurve |
|---|---|---|---|---|---|---|---|
| A | 233824 | 185689 | 0 | 0 | 0.00% | 0.00% | 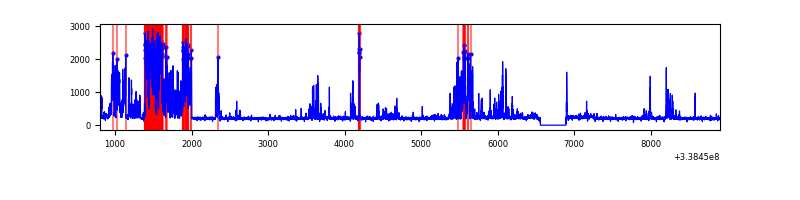 |
| B | 233824 | 192857 | 0 | 0 | 0.00% | 0.00% |  |
| C | 233824 | 195604 | 0 | 0 | 0.00% | 0.00% |  |
| D | 233824 | 195397 | 0 | 0 | 0.00% | 0.00% |  |
Top three noisy pixels from each quadrant. If the there are fewer than three noisy pixels in the level2.evt file, extra rows are filled as -1
| Pixel properties | Quadrant properties | ||||||
|---|---|---|---|---|---|---|---|
| Quadrant | DetID | PixID | Counts | Sigma | Mean | Median | Sigma |
| A | 0 | 29 | 7055 | 9.65 | 2156 | 2028 | 520.9 |
| A | 7 | 110 | 6620 | 8.82 | 2156 | 2028 | 520.9 |
| A | 9 | 19 | 6375 | 8.35 | 2156 | 2028 | 520.9 |
| B | 2 | 9 | 8492 | 10.62 | 2825 | 2712 | 544.0 |
| B | 5 | 128 | 7091 | 8.05 | 2825 | 2712 | 544.0 |
| B | 2 | 8 | 6896 | 7.69 | 2825 | 2712 | 544.0 |
| C | 9 | 209 | 8397 | 6.69 | 3223 | 3030 | 802.6 |
| C | 12 | 241 | 8388 | 6.68 | 3223 | 3030 | 802.6 |
| C | 9 | 233 | 8191 | 6.43 | 3223 | 3030 | 802.6 |
| D | 10 | 189 | 7252 | 6.0 | 2920 | 2673 | 763.3 |
| D | 6 | 231 | 7177 | 5.9 | 2920 | 2673 | 763.3 |
| D | 6 | 67 | 7141 | 5.85 | 2920 | 2673 | 763.3 |
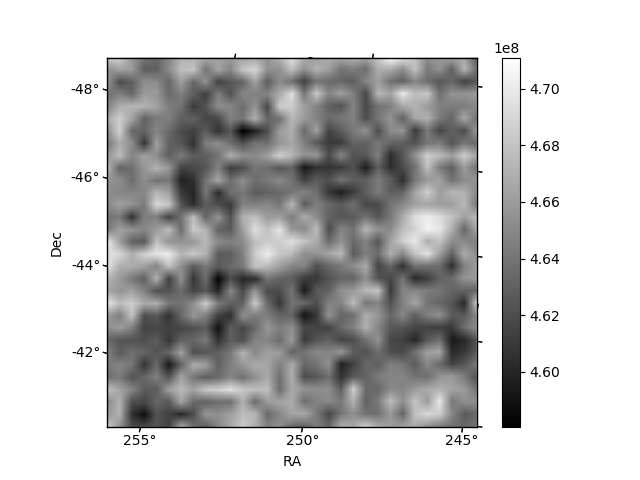
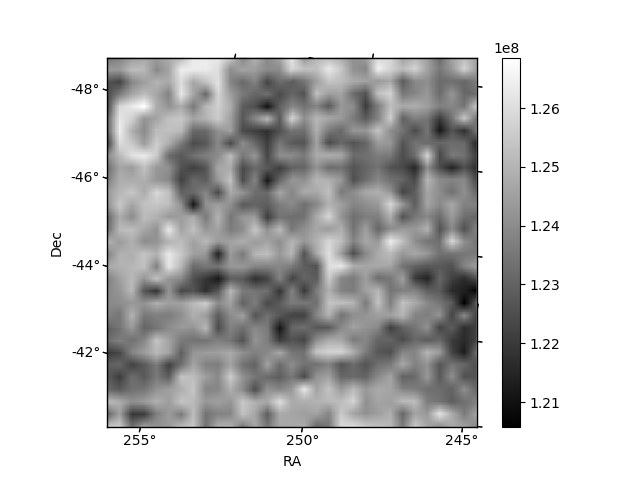
Histogram calculated using DETX and DETY for each event in the final _common_clean file
| Quadrant A | 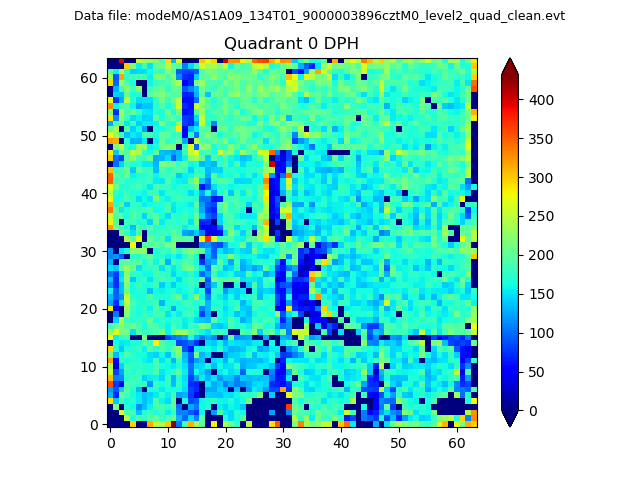 |
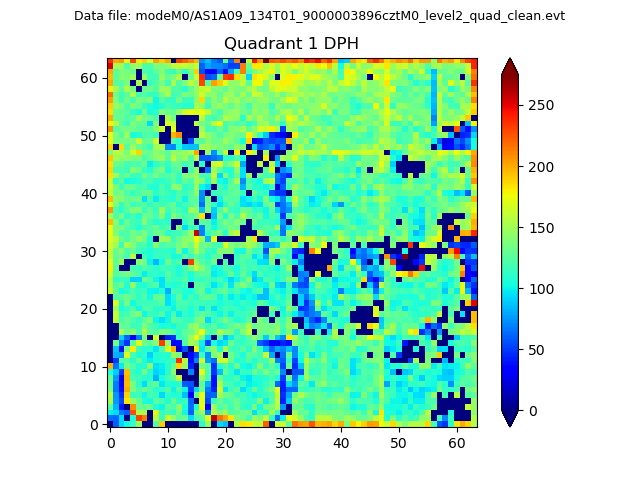 |
Quadrant B |
|---|---|---|---|
| Quadrant D |  |
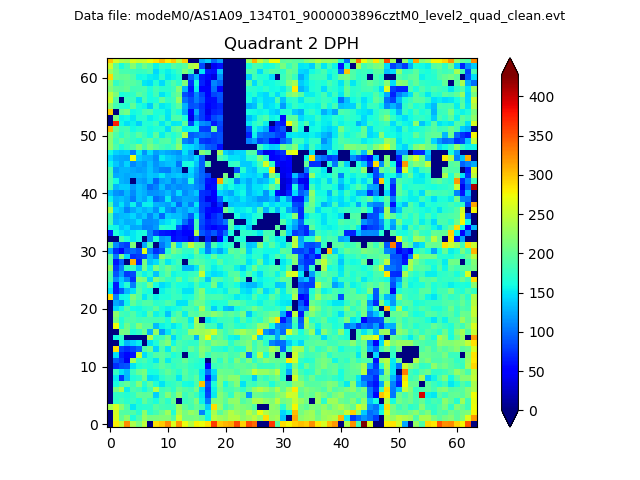 |
Quadrant C |
| Plot type | Count rate plots | Images |
|---|---|---|
| Comparison with Poisson distribution Blue bars denote a histogram of data divided into 1 sec bins. Red curve is a Poisson curve with rate = median count rate of data. |
 |
 |
| Quadrant-wise count rates Data is divided into 100 sec bins |
 |
|
| Module-wise count rates for Quadrant A Data is divided into 100 sec bins |
 |
 |
| Module-wise count rates for Quadrant B Data is divided into 100 sec bins |
 |
 |
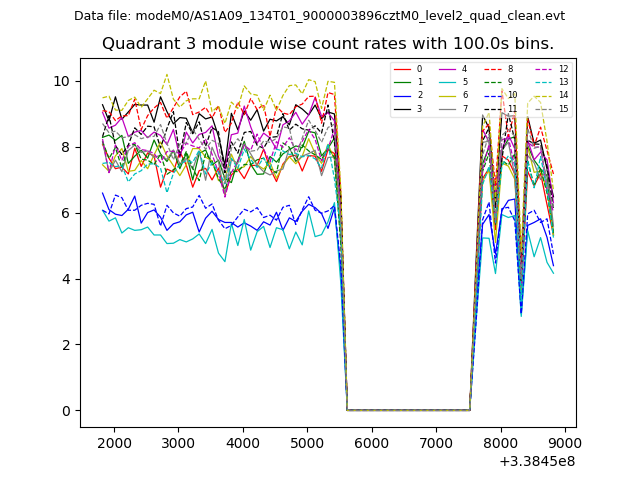
| Module-wise count rates for Quadrant C Data is divided into 100 sec bins |
 |
 |
| Module-wise count rates for Quadrant D Data is divided into 100 sec bins |
 |
 |
| Parameter | Plot |
|---|---|
| CZT HV Monitor |  |
| D_VDD | 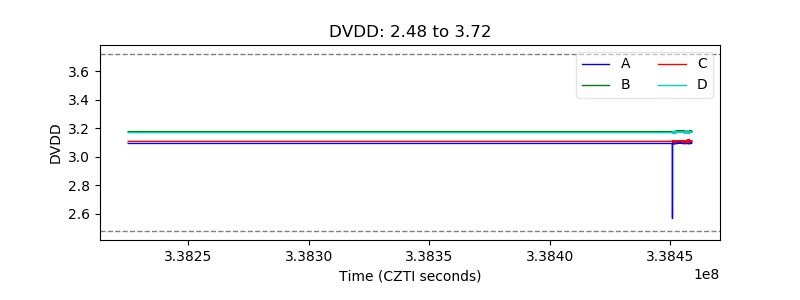 |
| Temperature 1 |  |
| Veto HV Monitor |  |
| Veto LLD | 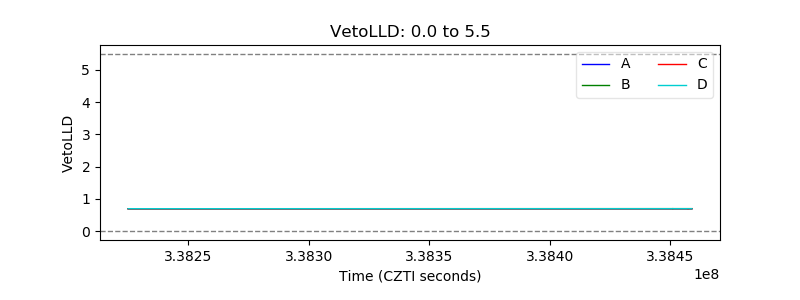 |
| Alpha Counter |  |
| _CPM_Rate | 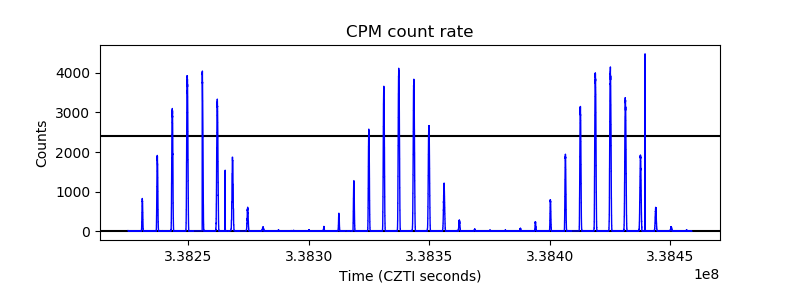 |
| CZT Counter |  |
| +2.5 Volts monitor |  |
| +5 Volts monitor | 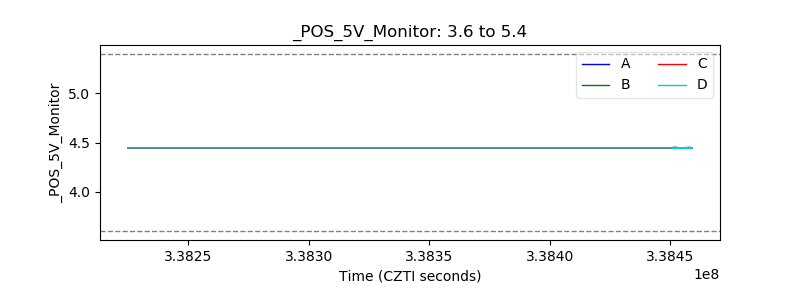 |
| _ROLL_ROT |  |
| _Roll_DEC |  |
| _Roll_RA |  |
| Veto Counter | 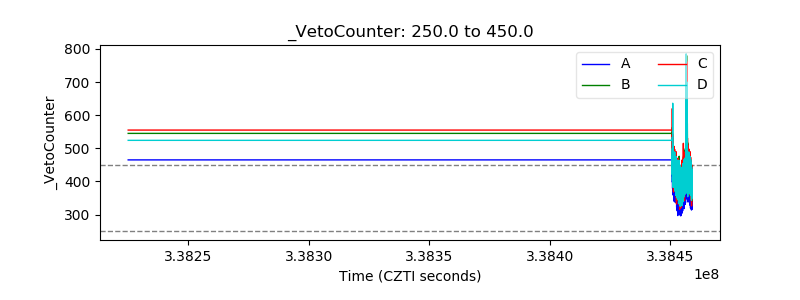 |