| Param | Original file | Final file |
|---|---|---|
| Filename | modeM0/AS1A09_134T01_9000003896_26917cztM0_level2.evt | modeM0/AS1A09_134T01_9000003896_26917cztM0_level2_quad_clean.evt |
| Size (bytes) | 820,359,360 | 92,678,400 |
| Size | 782.4 MB | 88.4 MB |
| Events in quadrant A | 3,486,371 | 653,352 |
| Events in quadrant B | 12,320,352 | 415,747 |
| Events in quadrant C | 3,365,652 | 640,895 |
| Events in quadrant D | 5,196,008 | 605,252 |
| Mode M9 | |||
|---|---|---|---|
| Quadrant | BADHDUFLAG | Total packets | Discarded packets |
| A | 0 | 8 | 0 |
| B | 0 | 8 | 0 |
| C | 0 | 8 | 0 |
| D | 0 | 8 | 0 |
| Mode M0 | |||
|---|---|---|---|
| Quadrant | BADHDUFLAG | Total packets | Discarded packets |
| A | 0 | 14725 | 0 |
| B | 0 | 41423 | 0 |
| C | 0 | 14537 | 0 |
| D | 0 | 20134 | 0 |
| Quadrant | Total seconds | Saturated seconds | Saturation percentage |
|---|---|---|---|
| A | 7040 | 35 | 0.497159% |
| B | 7040 | 4476 | 63.579545% |
| C | 7040 | 74 | 1.051136% |
| D | 7040 | 307 | 4.360795% |
Noise dominated data is calculated using 1-second bins in cleaned event files. If a bin has >2000 counts, and if more than 50% of those come from <1% of pixels, then it is considered to be noise-dominated and hence unusable.
| Quadrant | # 1 sec bins | Bins with >0 counts | Bins with >2000 counts | High rate bins dominated by noise | Noise dominated (total time) | Noise dominated (detector-on time) | Marked lightcurve |
|---|---|---|---|---|---|---|---|
| A | 7850 | 7041 | 0 | 0 | 0.00% | 0.00% | 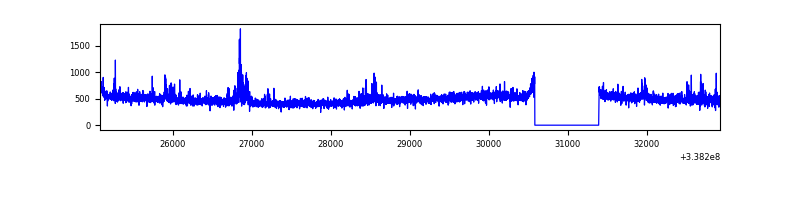 |
| B | 7849 | 7039 | 3451 | 3451 | 43.97% | 49.03% | 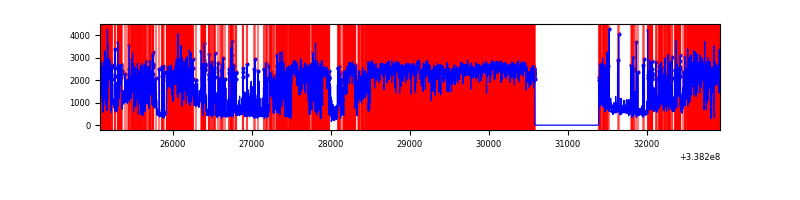 |
| C | 7850 | 7040 | 3 | 3 | 0.04% | 0.04% | 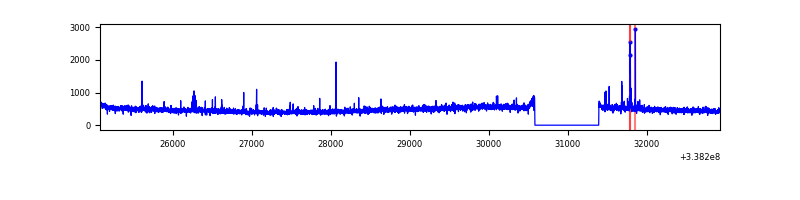 |
| D | 7850 | 7041 | 265 | 265 | 3.38% | 3.76% | 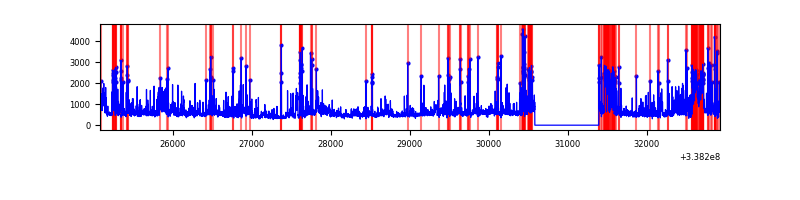 |
Top three noisy pixels from each quadrant. If the there are fewer than three noisy pixels in the level2.evt file, extra rows are filled as -1
| Pixel properties | Quadrant properties | ||||||
|---|---|---|---|---|---|---|---|
| Quadrant | DetID | PixID | Counts | Sigma | Mean | Median | Sigma |
| A | 0 | 13 | 141789 | 815.75 | 856 | 838 | 172.8 |
| A | 5 | 168 | 43619 | 247.59 | 856 | 838 | 172.8 |
| A | 13 | 254 | 11593 | 62.24 | 856 | 838 | 172.8 |
| B | 3 | 64 | 10023795 | 120324.22 | 426 | 416 | 83.3 |
| B | 0 | 189 | 282038 | 3380.69 | 426 | 416 | 83.3 |
| B | 0 | 190 | 91276 | 1090.72 | 426 | 416 | 83.3 |
| C | 14 | 238 | 132025 | 679.35 | 816 | 820 | 193.1 |
| C | 0 | 207 | 31826 | 160.54 | 816 | 820 | 193.1 |
| C | 2 | 16 | 16173 | 79.49 | 816 | 820 | 193.1 |
| D | 7 | 80 | 977606 | 4840.03 | 802 | 783 | 201.8 |
| D | 1 | 52 | 538599 | 2664.81 | 802 | 783 | 201.8 |
| D | 15 | 36 | 259358 | 1281.2 | 802 | 783 | 201.8 |
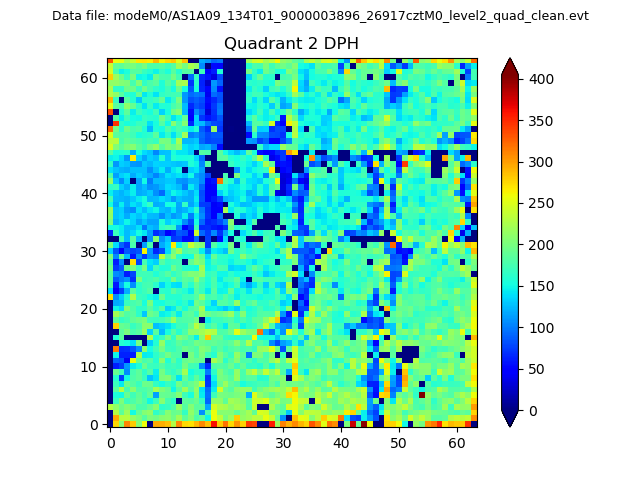
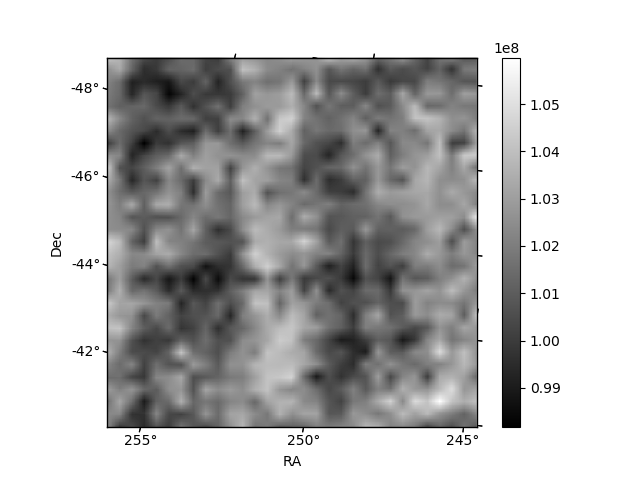
Histogram calculated using DETX and DETY for each event in the final _common_clean file
| Quadrant A | 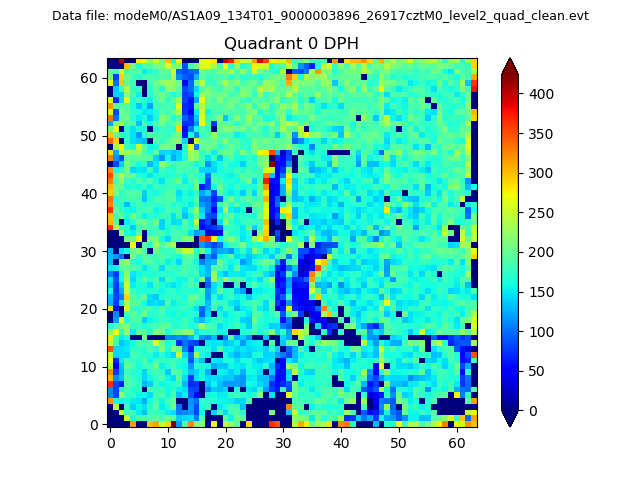 |
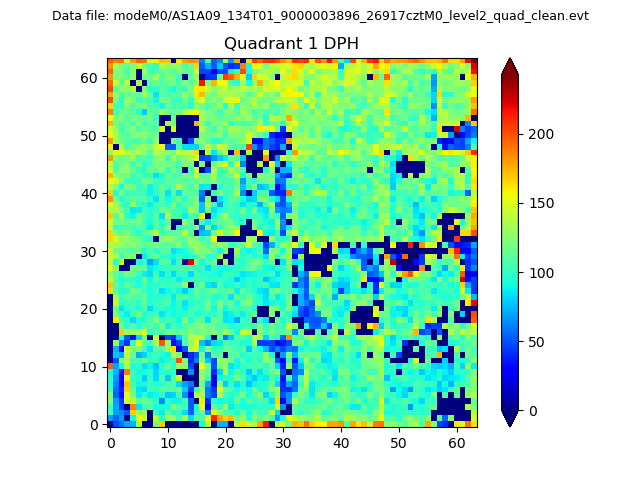 |
Quadrant B |
|---|---|---|---|
| Quadrant D | 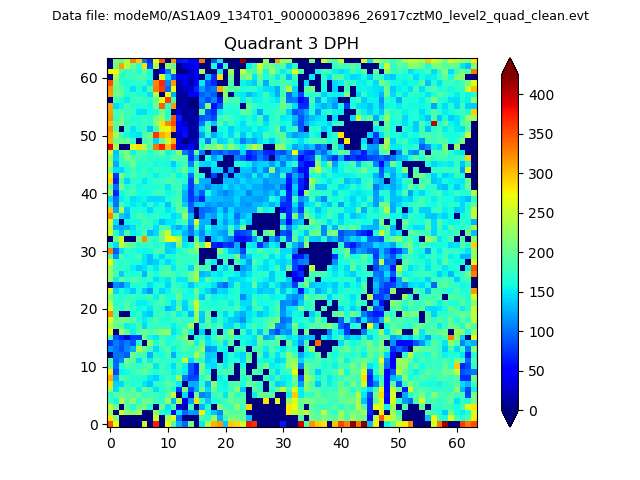 |
 |
Quadrant C |
| Plot type | Count rate plots | Images |
|---|---|---|
| Comparison with Poisson distribution Blue bars denote a histogram of data divided into 1 sec bins. Red curve is a Poisson curve with rate = median count rate of data. |
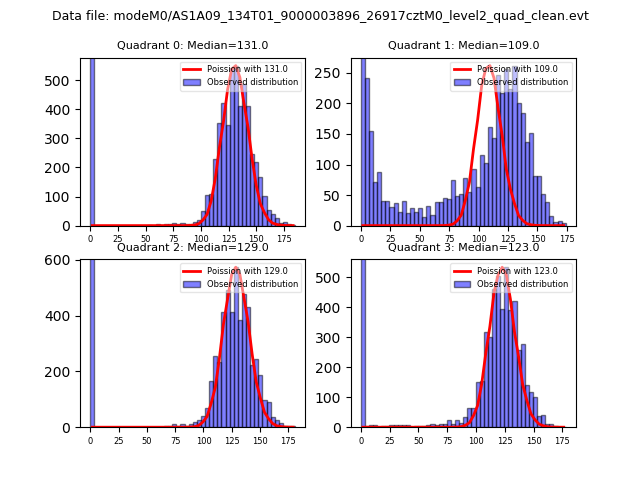 |
 |
| Quadrant-wise count rates Data is divided into 100 sec bins |
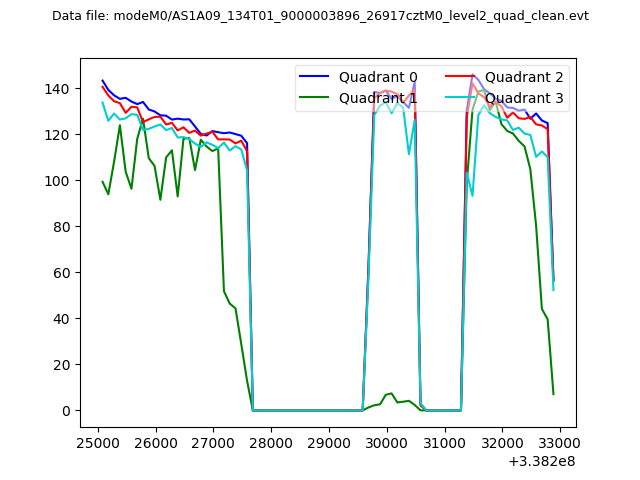 |
|
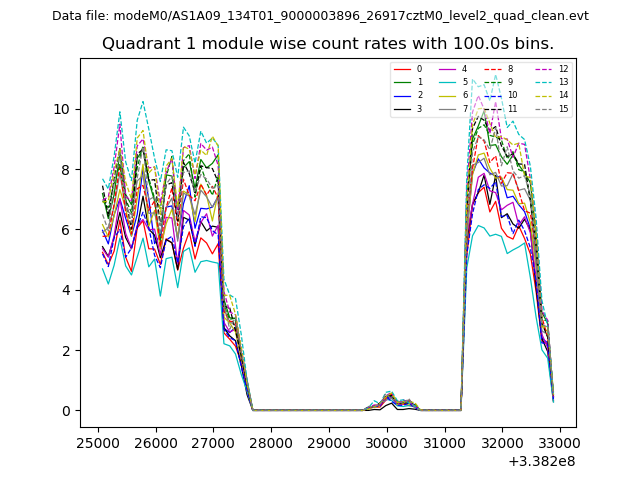
| Module-wise count rates for Quadrant A Data is divided into 100 sec bins |
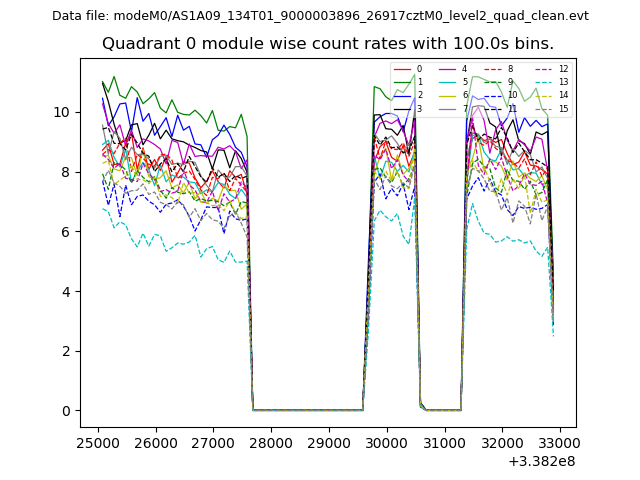 |
 |
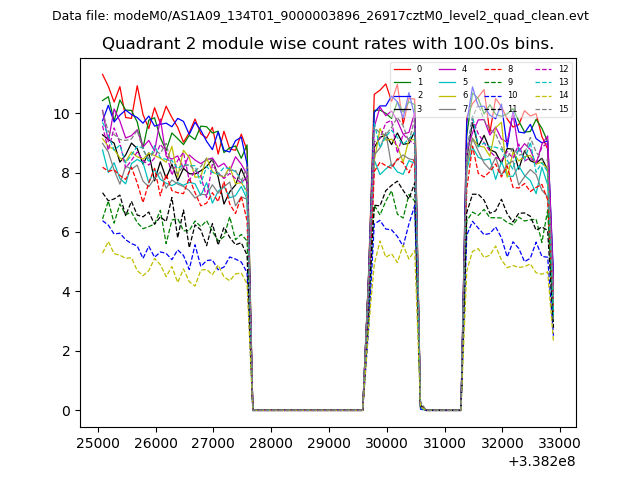
| Module-wise count rates for Quadrant B Data is divided into 100 sec bins |
 |
 |
| Module-wise count rates for Quadrant C Data is divided into 100 sec bins |
 |
 |
| Module-wise count rates for Quadrant D Data is divided into 100 sec bins |
 |
 |
| Parameter | Plot |
|---|---|
| CZT HV Monitor | 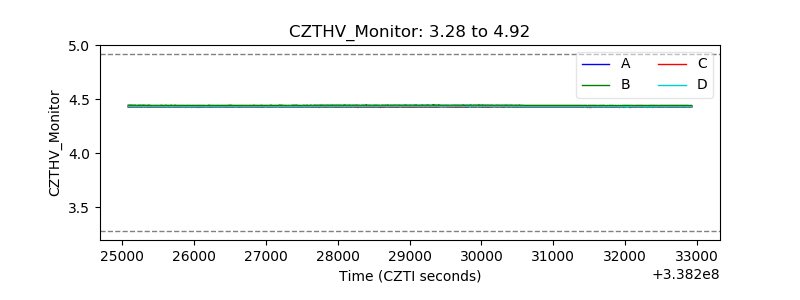 |
| D_VDD | 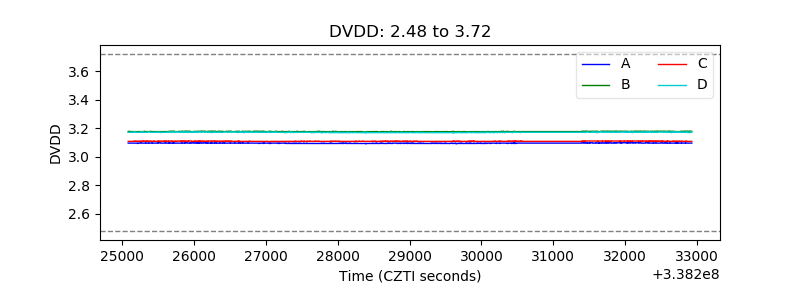 |
| Temperature 1 | 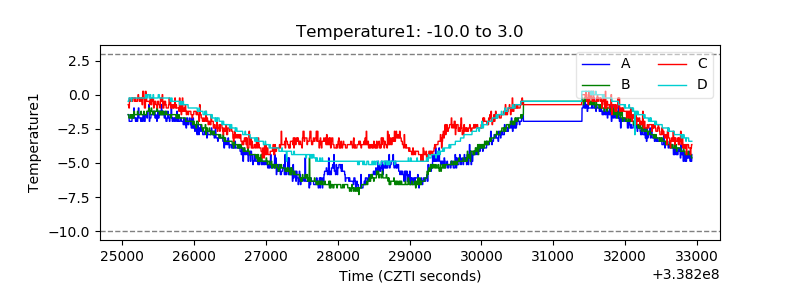 |
| Veto HV Monitor |  |
| Veto LLD | 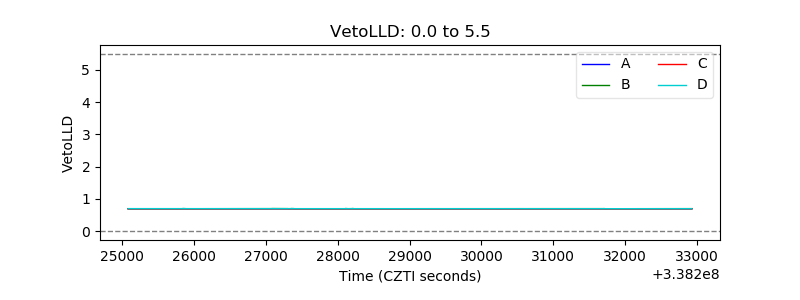 |
| Alpha Counter | 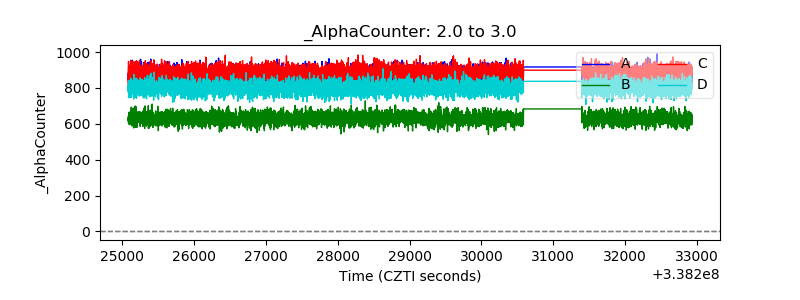 |
| _CPM_Rate | 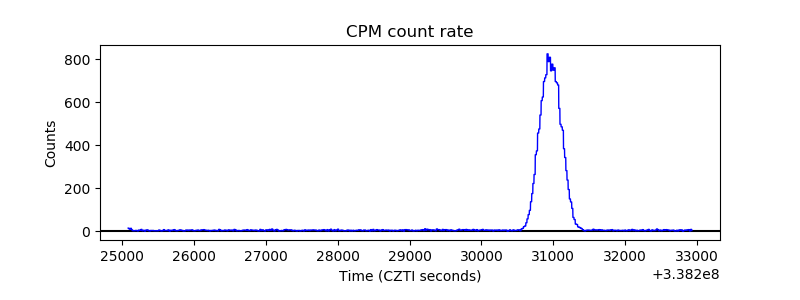 |
| CZT Counter | 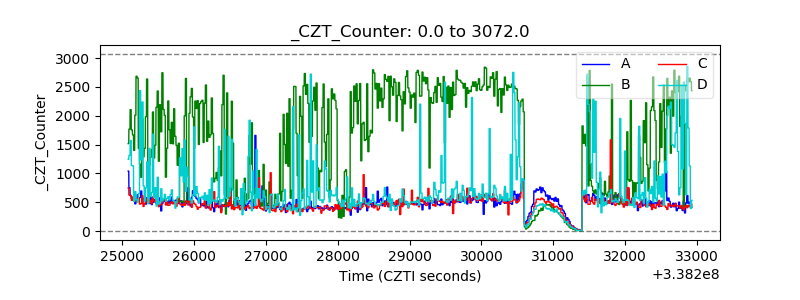 |
| +2.5 Volts monitor | 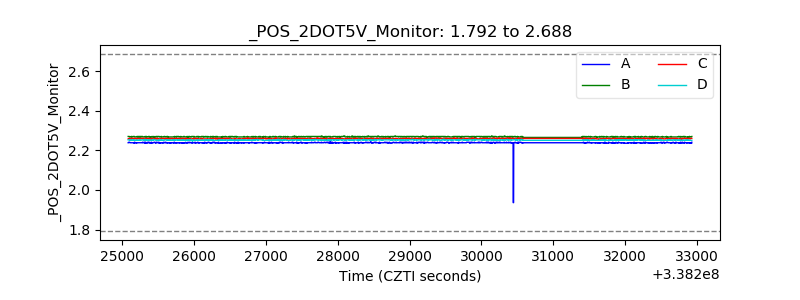 |
| +5 Volts monitor |  |
| _ROLL_ROT | 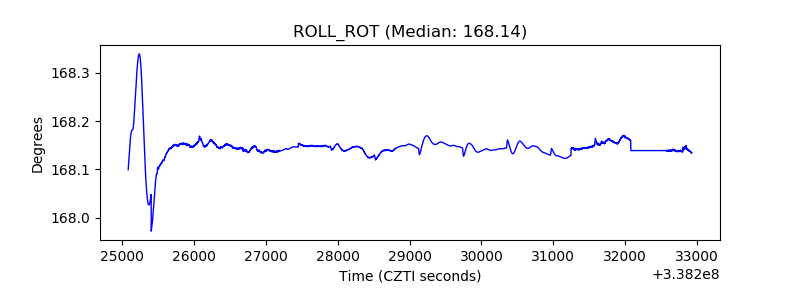 |
| _Roll_DEC |  |
| _Roll_RA | 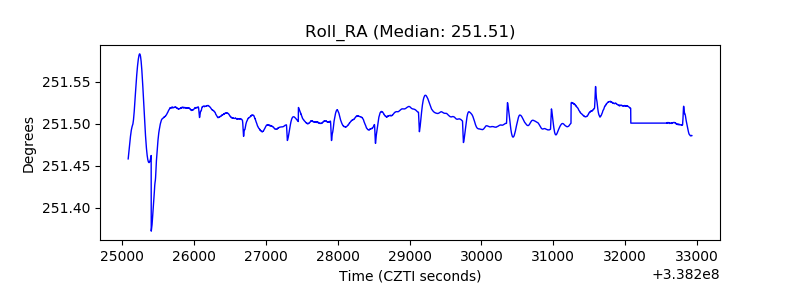 |
| Veto Counter |  |