| Param | Original file | Final file |
|---|---|---|
| Filename | modeM0/AS1A09_134T01_9000003896_26918cztM0_level2.evt | modeM0/AS1A09_134T01_9000003896_26918cztM0_level2_quad_clean.evt |
| Size (bytes) | 769,982,400 | 82,342,080 |
| Size | 734.3 MB | 78.5 MB |
| Events in quadrant A | 3,484,802 | 569,690 |
| Events in quadrant B | 9,751,897 | 388,514 |
| Events in quadrant C | 3,025,803 | 566,305 |
| Events in quadrant D | 6,626,919 | 524,712 |
| Mode M9 | |||
|---|---|---|---|
| Quadrant | BADHDUFLAG | Total packets | Discarded packets |
| A | 0 | 9 | 0 |
| B | 0 | 9 | 0 |
| C | 0 | 9 | 0 |
| D | 0 | 9 | 0 |
| Mode M0 | |||
|---|---|---|---|
| Quadrant | BADHDUFLAG | Total packets | Discarded packets |
| A | 0 | 14458 | 0 |
| B | 0 | 33212 | 0 |
| C | 0 | 13091 | 0 |
| D | 0 | 23929 | 0 |
| Quadrant | Total seconds | Saturated seconds | Saturation percentage |
|---|---|---|---|
| A | 6347 | 135 | 2.126989% |
| B | 6348 | 3312 | 52.173913% |
| C | 6348 | 51 | 0.803403% |
| D | 6348 | 963 | 15.170132% |
Noise dominated data is calculated using 1-second bins in cleaned event files. If a bin has >2000 counts, and if more than 50% of those come from <1% of pixels, then it is considered to be noise-dominated and hence unusable.
| Quadrant | # 1 sec bins | Bins with >0 counts | Bins with >2000 counts | High rate bins dominated by noise | Noise dominated (total time) | Noise dominated (detector-on time) | Marked lightcurve |
|---|---|---|---|---|---|---|---|
| A | 7297 | 6348 | 57 | 57 | 0.78% | 0.90% | 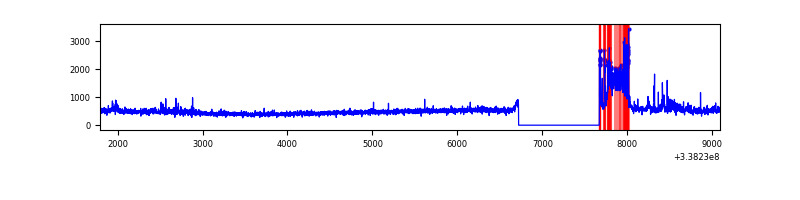 |
| B | 7298 | 6349 | 2460 | 2460 | 33.71% | 38.75% | 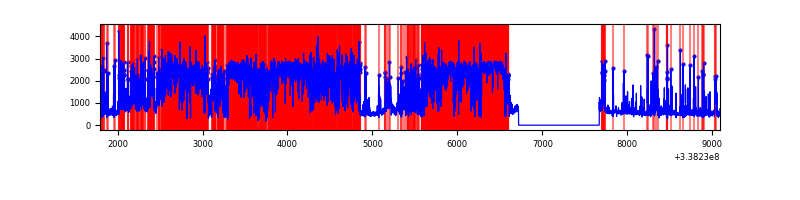 |
| C | 7298 | 6349 | 3 | 3 | 0.04% | 0.05% | 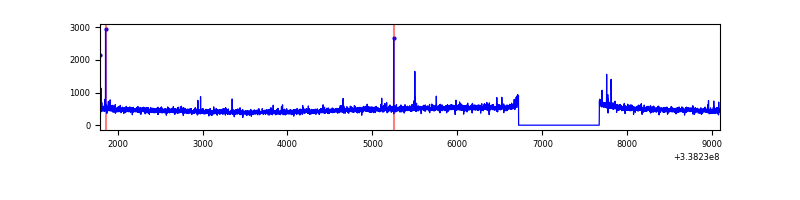 |
| D | 7298 | 6349 | 986 | 986 | 13.51% | 15.53% | 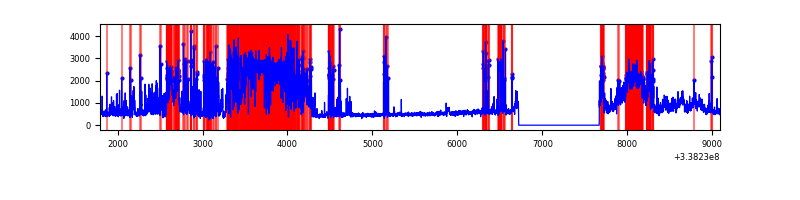 |
Top three noisy pixels from each quadrant. If the there are fewer than three noisy pixels in the level2.evt file, extra rows are filled as -1
| Pixel properties | Quadrant properties | ||||||
|---|---|---|---|---|---|---|---|
| Quadrant | DetID | PixID | Counts | Sigma | Mean | Median | Sigma |
| A | 14 | 235 | 346937 | 2235.33 | 764 | 749 | 154.9 |
| A | 0 | 13 | 111864 | 717.47 | 764 | 749 | 154.9 |
| A | 6 | 16 | 28073 | 176.43 | 764 | 749 | 154.9 |
| B | 3 | 64 | 7228994 | 71100.1 | 528 | 516 | 101.7 |
| B | 0 | 189 | 138943 | 1361.58 | 528 | 516 | 101.7 |
| B | 0 | 219 | 82187 | 803.32 | 528 | 516 | 101.7 |
| C | 14 | 238 | 118110 | 676.59 | 735 | 738 | 173.5 |
| C | 0 | 207 | 26515 | 148.59 | 735 | 738 | 173.5 |
| C | 15 | 208 | 12063 | 65.28 | 735 | 738 | 173.5 |
| D | 7 | 80 | 2666961 | 15363.89 | 686 | 670 | 173.5 |
| D | 15 | 36 | 718852 | 4138.36 | 686 | 670 | 173.5 |
| D | 2 | 250 | 281853 | 1620.25 | 686 | 670 | 173.5 |
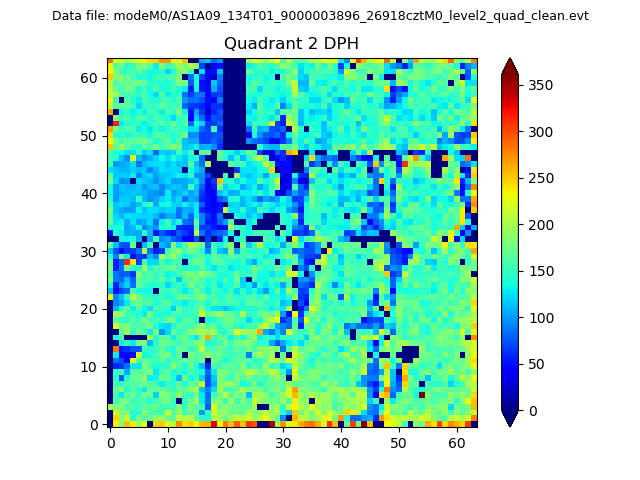
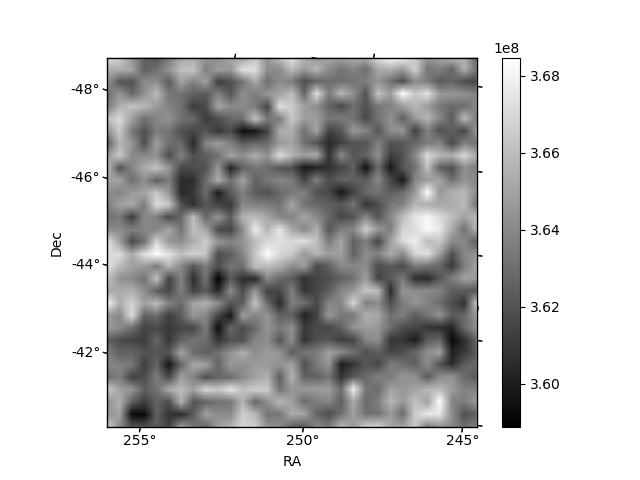
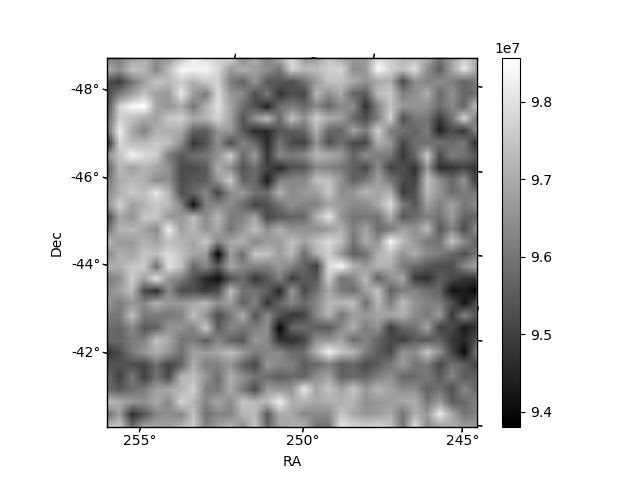
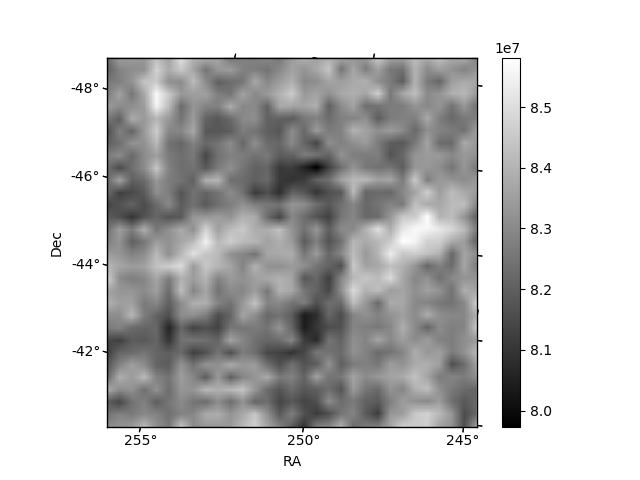
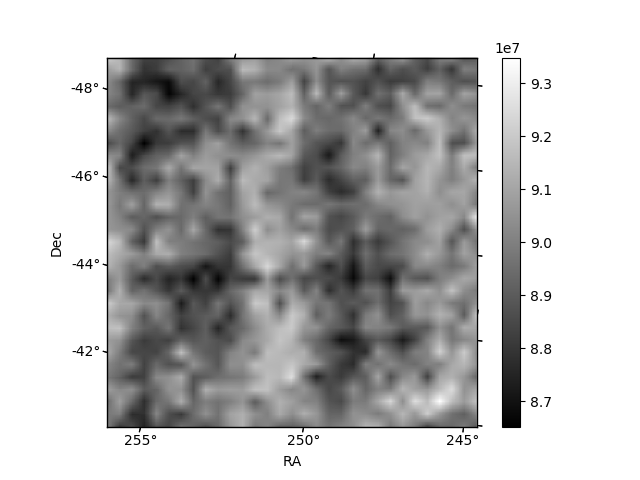
Histogram calculated using DETX and DETY for each event in the final _common_clean file
| Quadrant A | 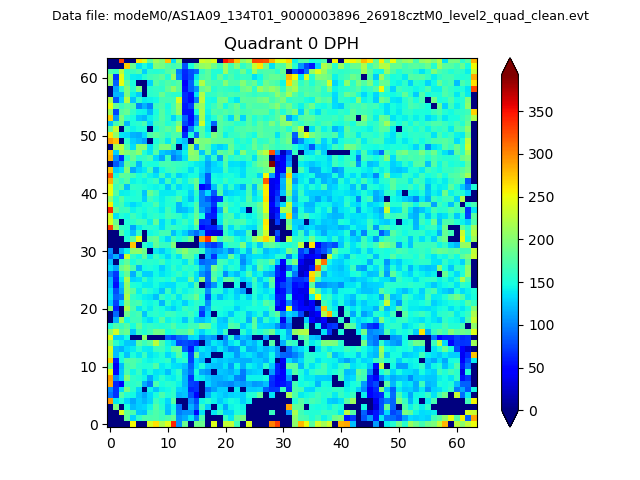 |
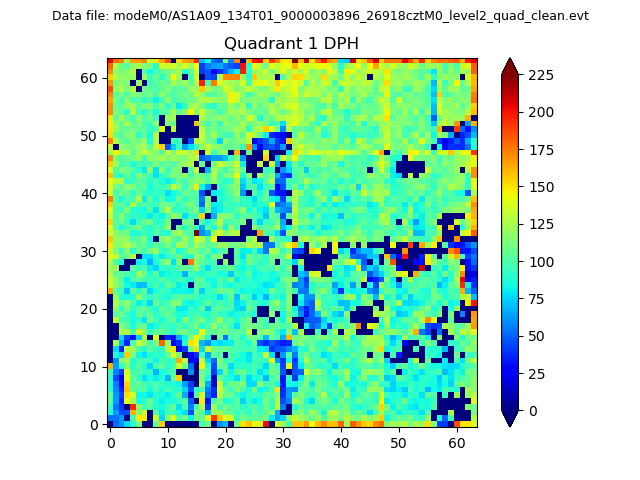 |
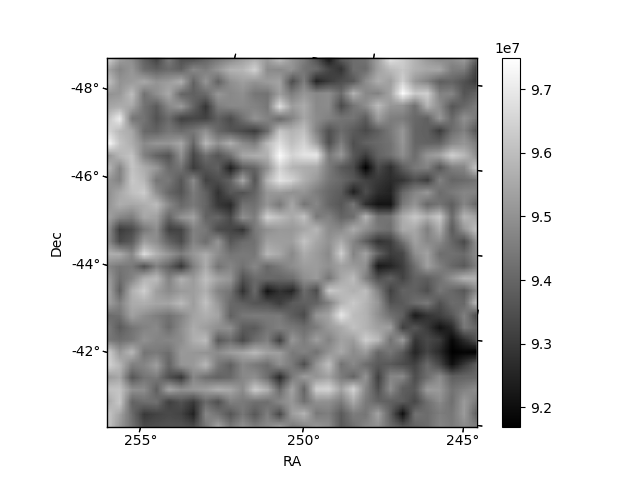
Quadrant B |
|---|---|---|---|
| Quadrant D | 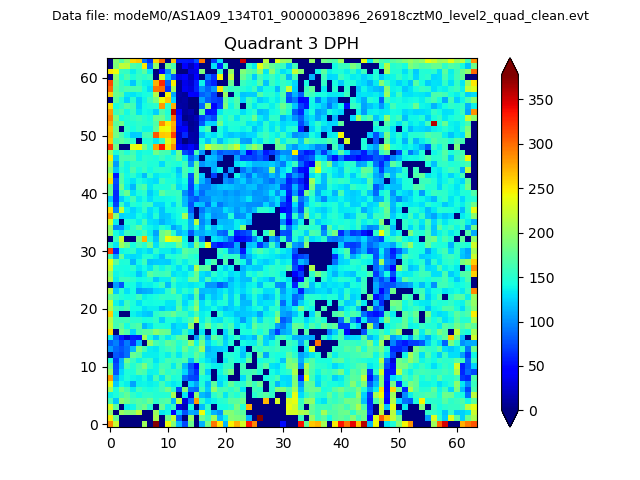 |
 |
Quadrant C |
| Plot type | Count rate plots | Images |
|---|---|---|
| Comparison with Poisson distribution Blue bars denote a histogram of data divided into 1 sec bins. Red curve is a Poisson curve with rate = median count rate of data. |
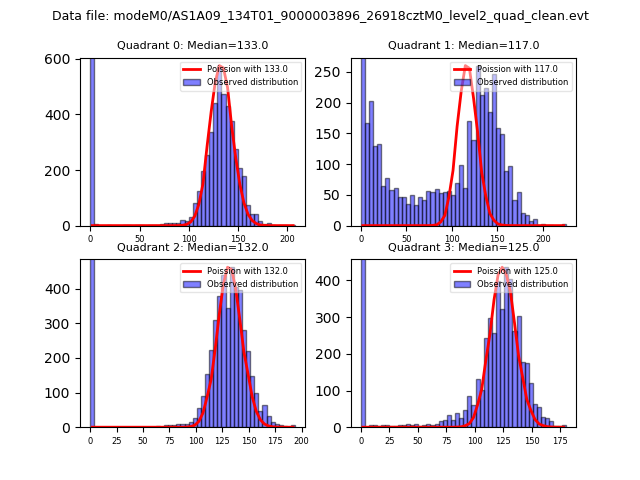 |
 |
| Quadrant-wise count rates Data is divided into 100 sec bins |
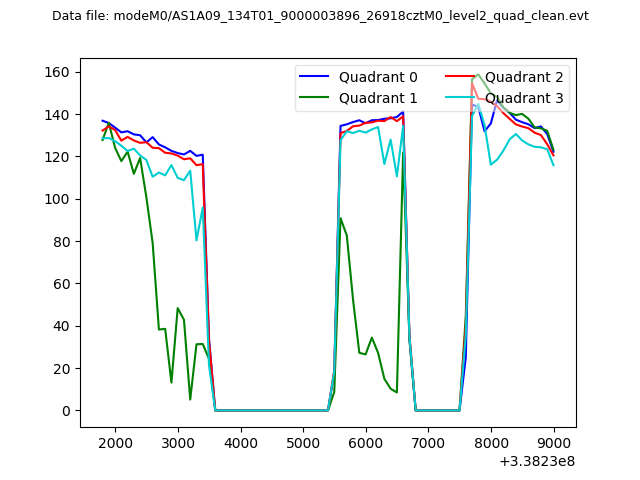 |
|
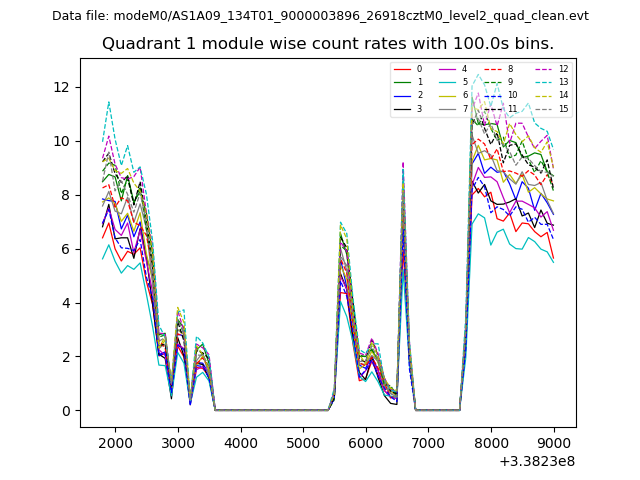
| Module-wise count rates for Quadrant A Data is divided into 100 sec bins |
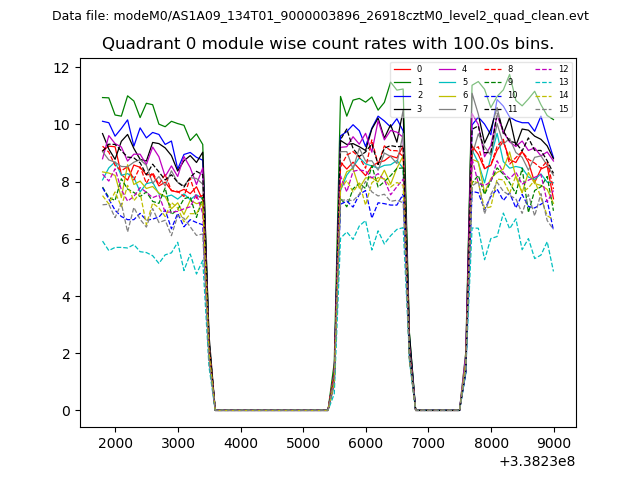 |
 |
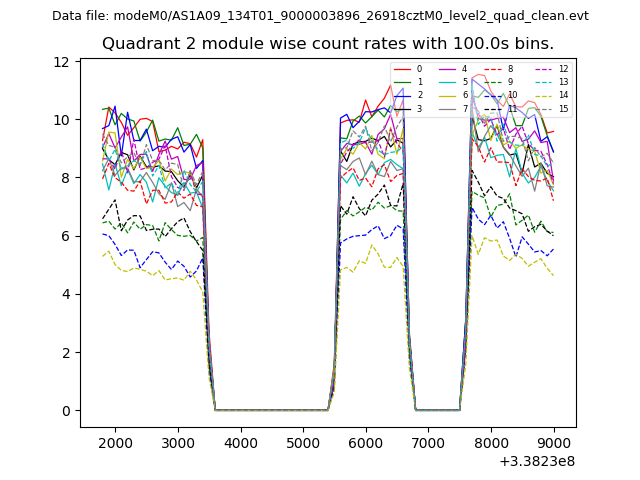
| Module-wise count rates for Quadrant B Data is divided into 100 sec bins |
 |
 |
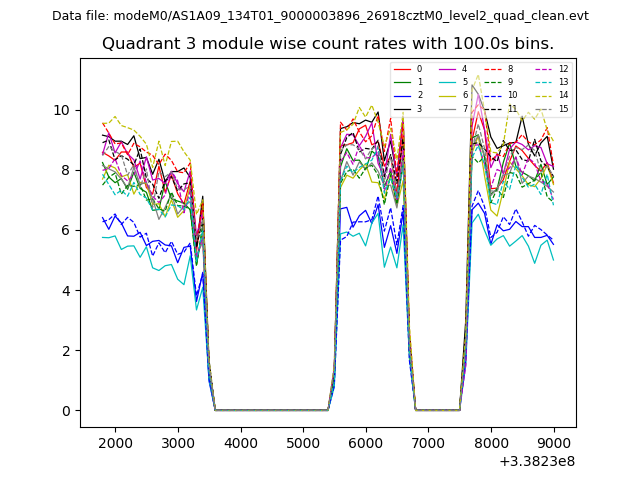
| Module-wise count rates for Quadrant C Data is divided into 100 sec bins |
 |
 |
| Module-wise count rates for Quadrant D Data is divided into 100 sec bins |
 |
 |
| Parameter | Plot |
|---|---|
| CZT HV Monitor | 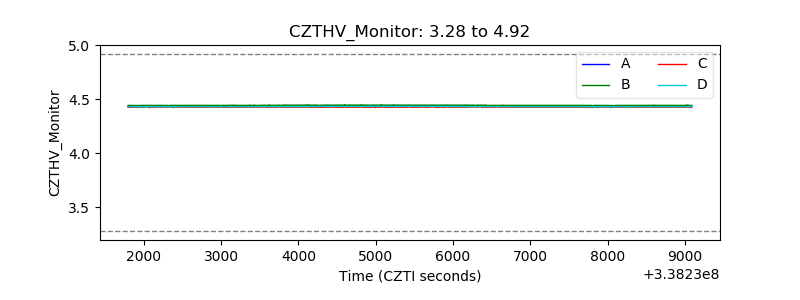 |
| D_VDD | 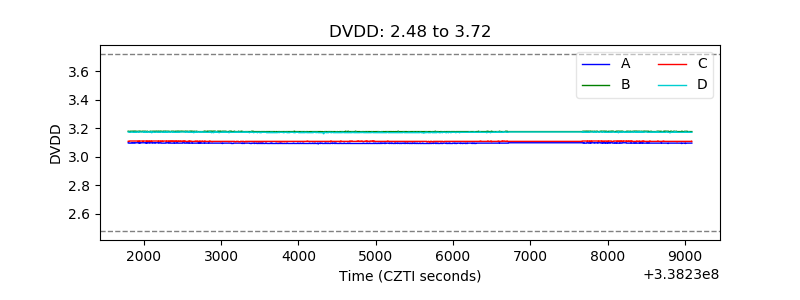 |
| Temperature 1 | 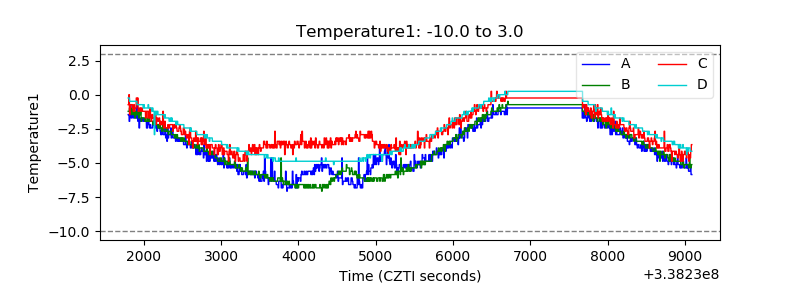 |
| Veto HV Monitor |  |
| Veto LLD | 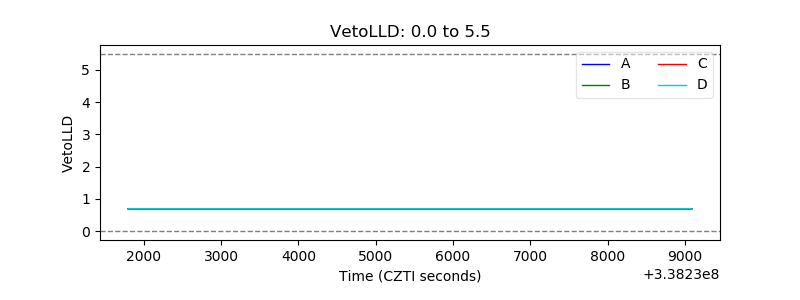 |
| Alpha Counter | 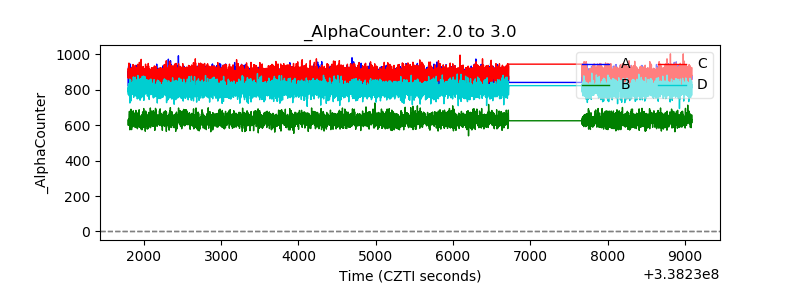 |
| _CPM_Rate | 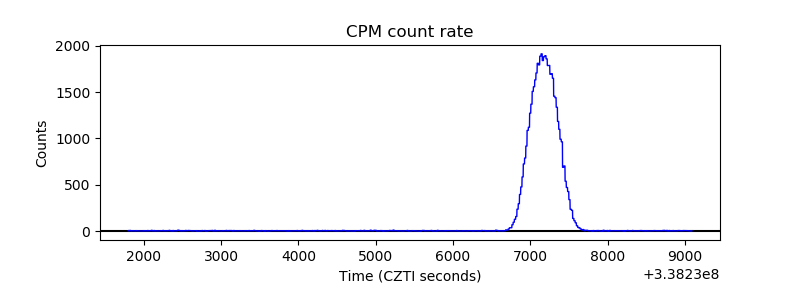 |
| CZT Counter | 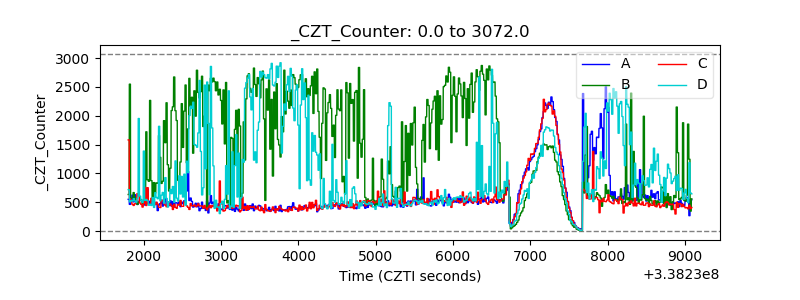 |
| +2.5 Volts monitor | 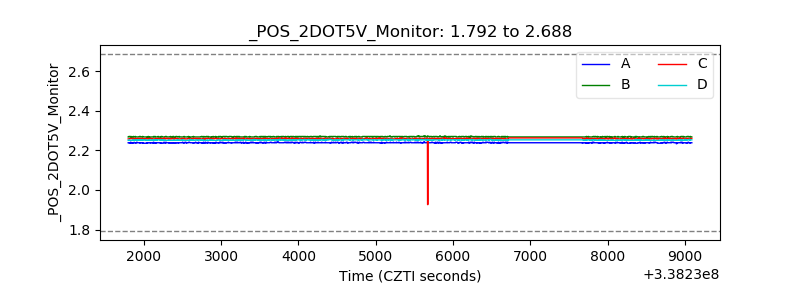 |
| +5 Volts monitor |  |
| _ROLL_ROT | 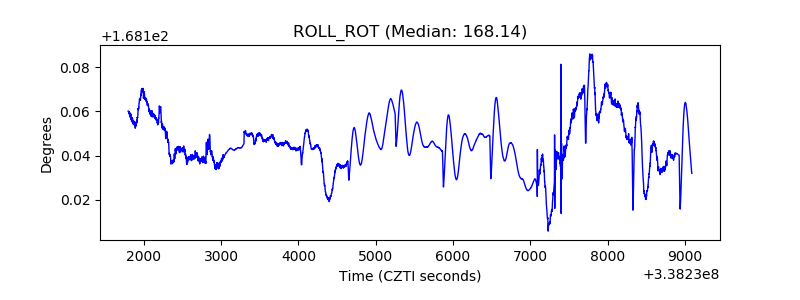 |
| _Roll_DEC | 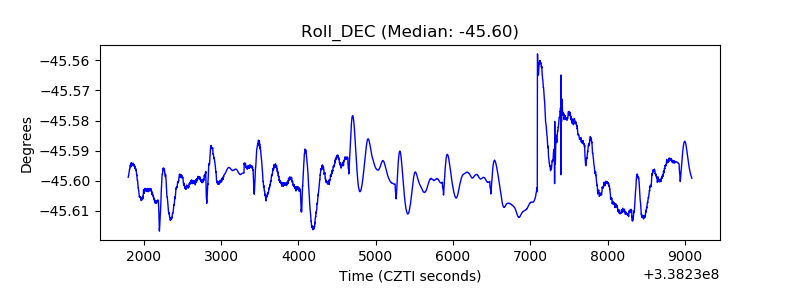 |
| _Roll_RA | 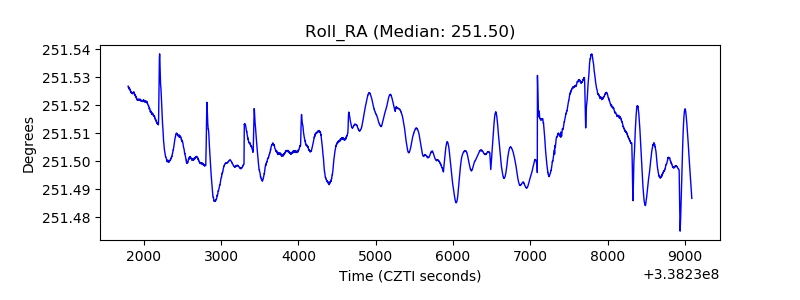 |
| Veto Counter | 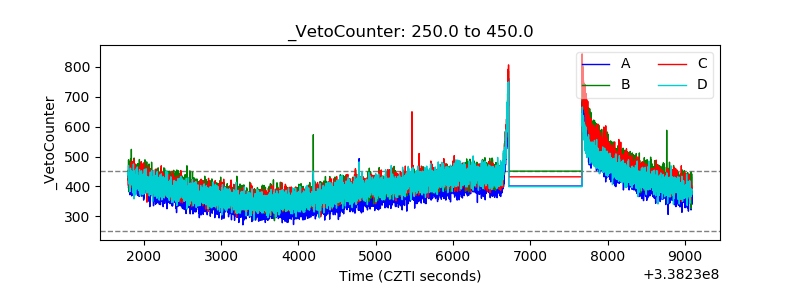 |