| Param | Original file | Final file |
|---|---|---|
| Filename | modeM0/AS1A09_134T01_9000003896_26920cztM0_level2.evt | modeM0/AS1A09_134T01_9000003896_26920cztM0_level2_quad_clean.evt |
| Size (bytes) | 711,800,640 | 87,189,120 |
| Size | 678.8 MB | 83.2 MB |
| Events in quadrant A | 8,245,221 | 460,742 |
| Events in quadrant B | 3,813,072 | 605,795 |
| Events in quadrant C | 3,064,775 | 585,369 |
| Events in quadrant D | 6,006,939 | 546,638 |
| Mode M9 | |||
|---|---|---|---|
| Quadrant | BADHDUFLAG | Total packets | Discarded packets |
| A | 0 | 12 | 0 |
| B | 0 | 12 | 0 |
| C | 0 | 12 | 0 |
| D | 0 | 12 | 0 |
| Mode M0 | |||
|---|---|---|---|
| Quadrant | BADHDUFLAG | Total packets | Discarded packets |
| A | 0 | 28728 | 0 |
| B | 0 | 15257 | 0 |
| C | 0 | 13002 | 0 |
| D | 0 | 22348 | 0 |
| Quadrant | Total seconds | Saturated seconds | Saturation percentage |
|---|---|---|---|
| A | 6316 | 2305 | 36.494617% |
| B | 6316 | 180 | 2.849905% |
| C | 6316 | 44 | 0.696643% |
| D | 6317 | 393 | 6.221308% |
Noise dominated data is calculated using 1-second bins in cleaned event files. If a bin has >2000 counts, and if more than 50% of those come from <1% of pixels, then it is considered to be noise-dominated and hence unusable.
| Quadrant | # 1 sec bins | Bins with >0 counts | Bins with >2000 counts | High rate bins dominated by noise | Noise dominated (total time) | Noise dominated (detector-on time) | Marked lightcurve |
|---|---|---|---|---|---|---|---|
| A | 7425 | 6315 | 1831 | 1831 | 24.66% | 28.99% | 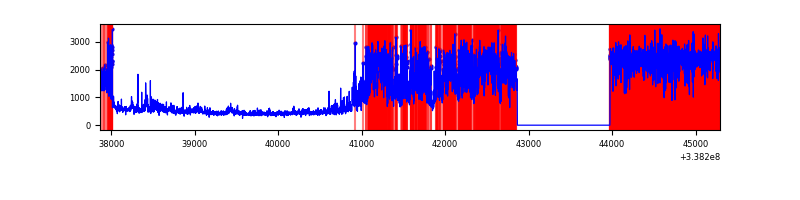 |
| B | 7426 | 6316 | 108 | 108 | 1.45% | 1.71% | 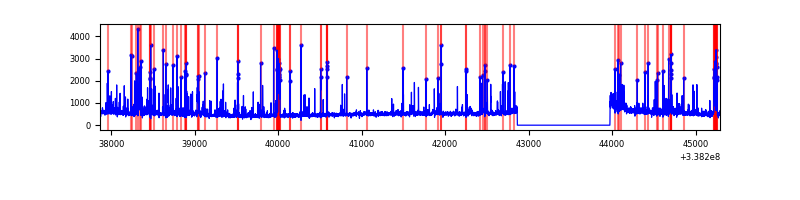 |
| C | 7426 | 6316 | 0 | 0 | 0.00% | 0.00% | 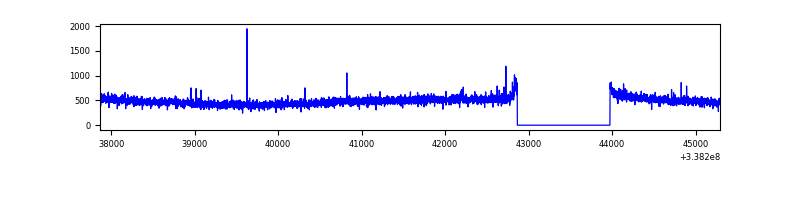 |
| D | 7427 | 6318 | 407 | 407 | 5.48% | 6.44% | 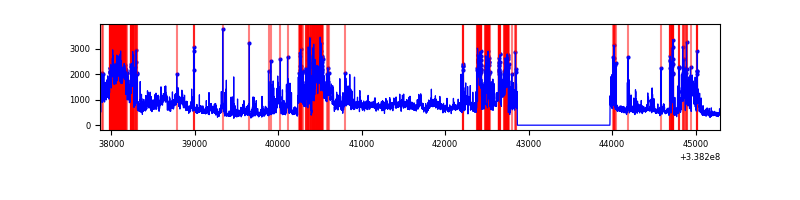 |
Top three noisy pixels from each quadrant. If the there are fewer than three noisy pixels in the level2.evt file, extra rows are filled as -1
| Pixel properties | Quadrant properties | ||||||
|---|---|---|---|---|---|---|---|
| Quadrant | DetID | PixID | Counts | Sigma | Mean | Median | Sigma |
| A | 14 | 235 | 5524902 | 40721.75 | 669 | 656 | 135.7 |
| A | 0 | 13 | 73179 | 534.6 | 669 | 656 | 135.7 |
| A | 6 | 16 | 29901 | 215.58 | 669 | 656 | 135.7 |
| B | 0 | 189 | 269753 | 1829.59 | 783 | 764 | 147.0 |
| B | 3 | 64 | 177222 | 1200.22 | 783 | 764 | 147.0 |
| B | 10 | 246 | 126611 | 855.98 | 783 | 764 | 147.0 |
| C | 14 | 238 | 121738 | 688.06 | 749 | 754 | 175.8 |
| C | 15 | 208 | 13299 | 71.35 | 749 | 754 | 175.8 |
| C | 0 | 207 | 6734 | 34.01 | 749 | 754 | 175.8 |
| D | 7 | 80 | 2286091 | 11935.01 | 729 | 712 | 191.5 |
| D | 15 | 36 | 502565 | 2620.84 | 729 | 712 | 191.5 |
| D | 2 | 250 | 238563 | 1242.14 | 729 | 712 | 191.5 |
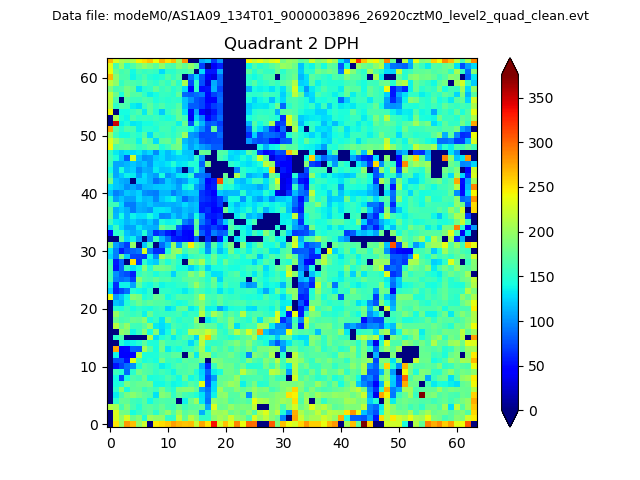
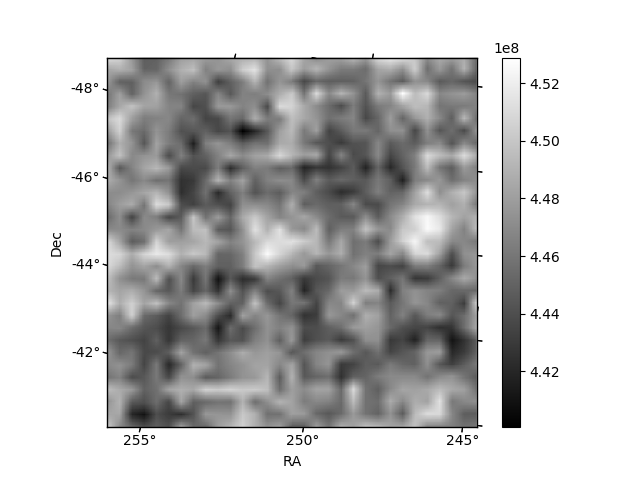
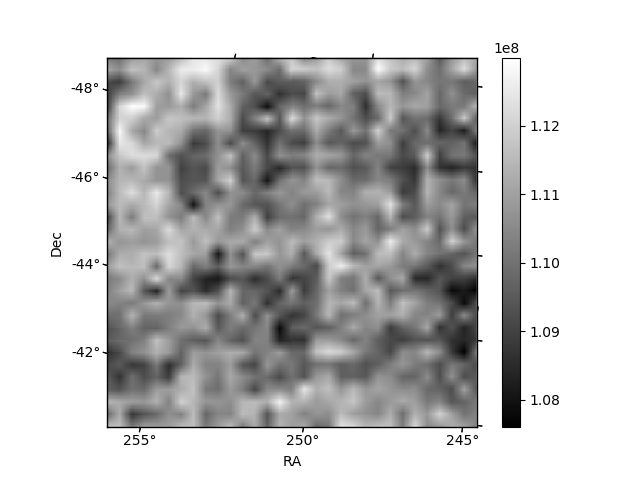
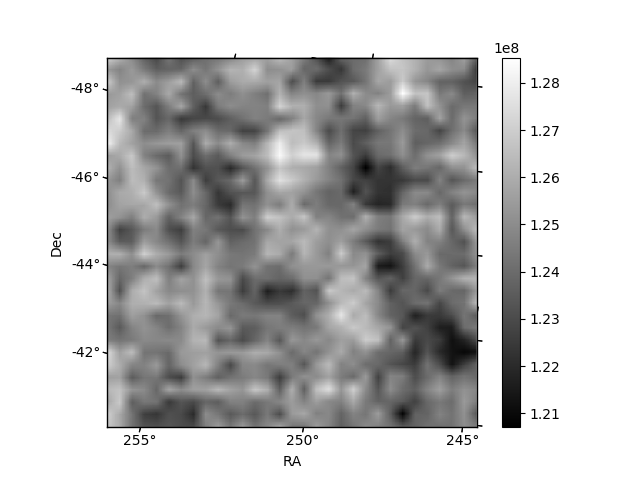
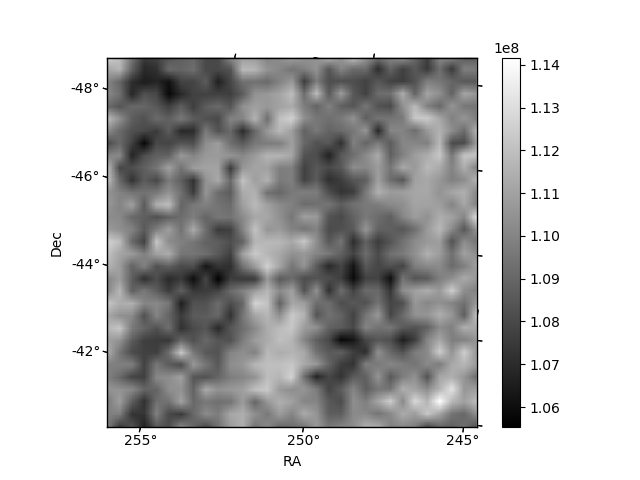
Histogram calculated using DETX and DETY for each event in the final _common_clean file
| Quadrant A | 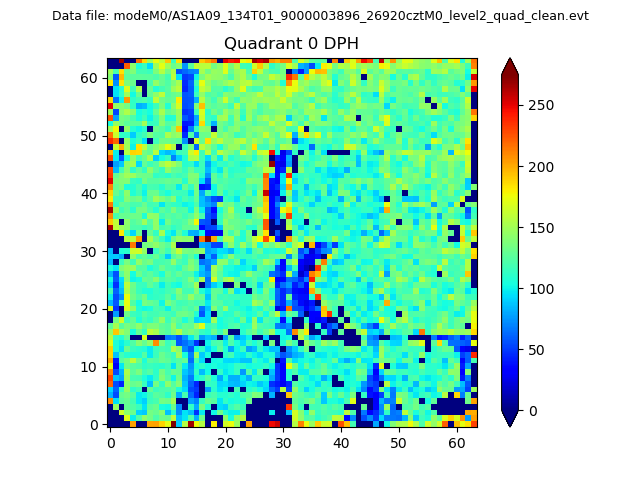 |
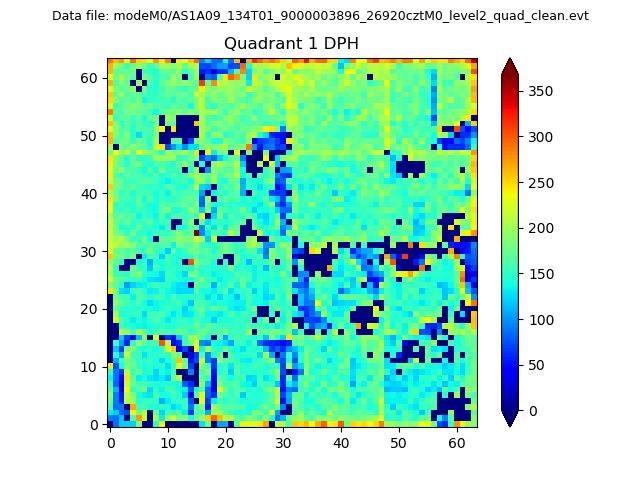 |
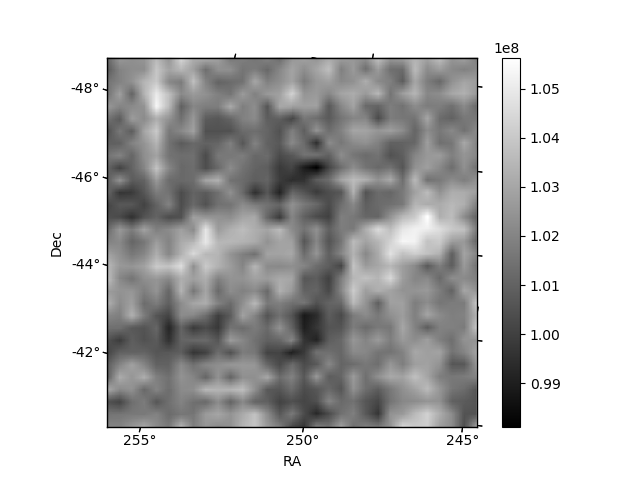
Quadrant B |
|---|---|---|---|
| Quadrant D | 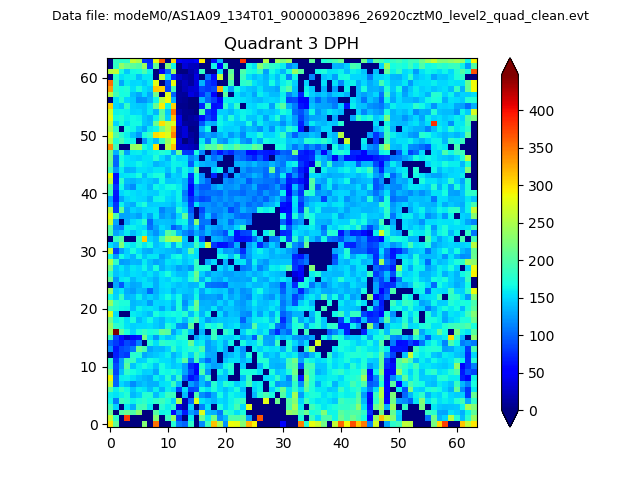 |
 |
Quadrant C |
| Plot type | Count rate plots | Images |
|---|---|---|
| Comparison with Poisson distribution Blue bars denote a histogram of data divided into 1 sec bins. Red curve is a Poisson curve with rate = median count rate of data. |
 |
 |
| Quadrant-wise count rates Data is divided into 100 sec bins |
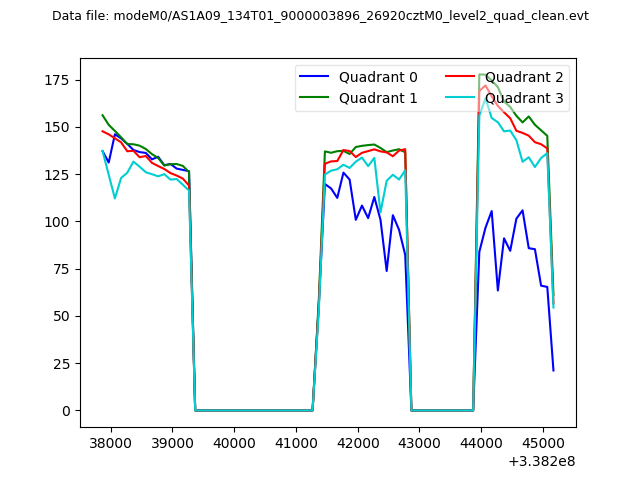 |
|
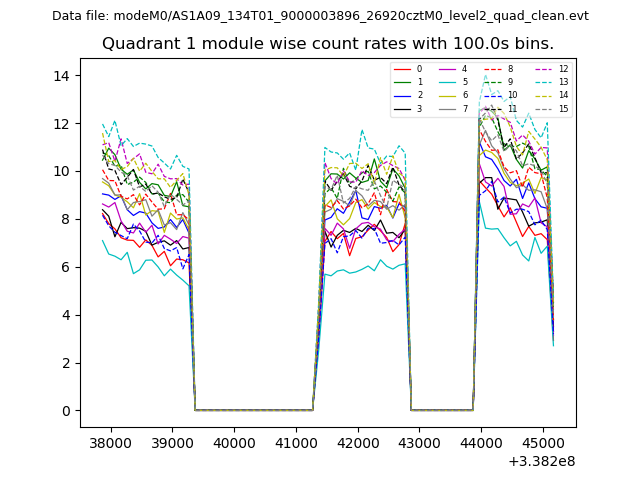
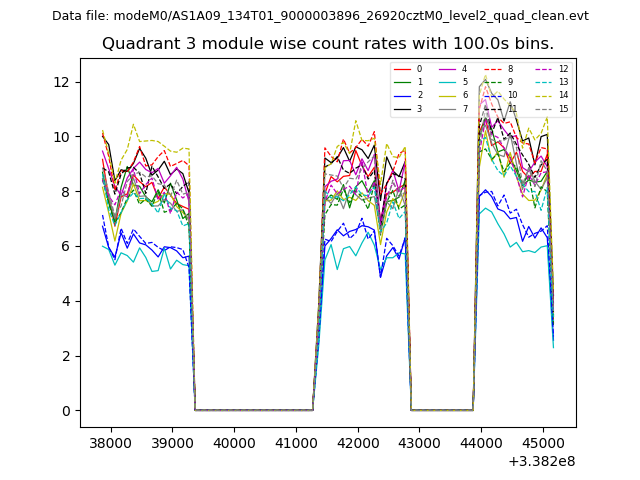
| Module-wise count rates for Quadrant A Data is divided into 100 sec bins |
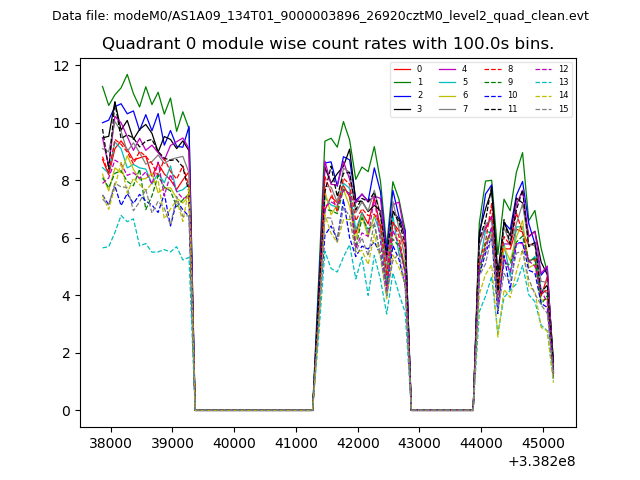 |
 |
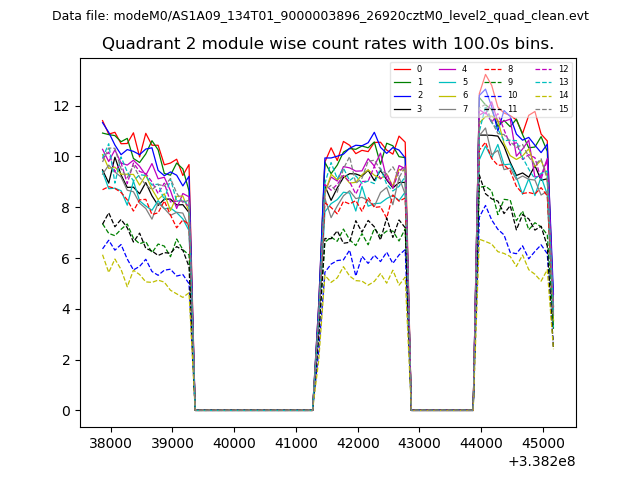
| Module-wise count rates for Quadrant B Data is divided into 100 sec bins |
 |
 |
| Module-wise count rates for Quadrant C Data is divided into 100 sec bins |
 |
 |
| Module-wise count rates for Quadrant D Data is divided into 100 sec bins |
 |
 |
| Parameter | Plot |
|---|---|
| CZT HV Monitor | 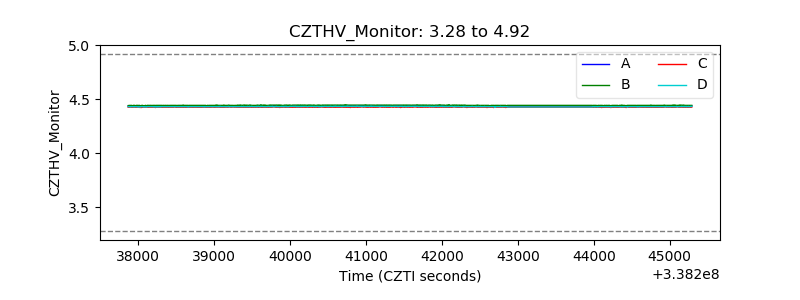 |
| D_VDD | 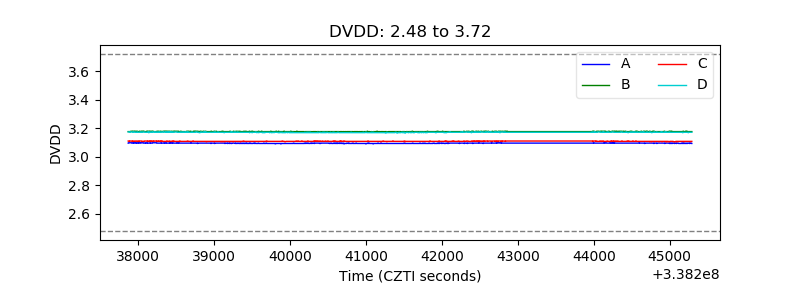 |
| Temperature 1 | 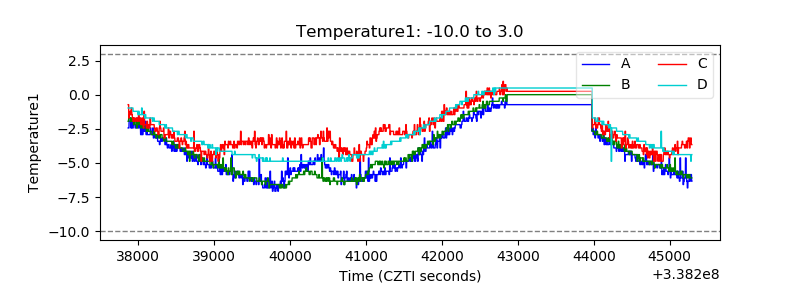 |
| Veto HV Monitor | 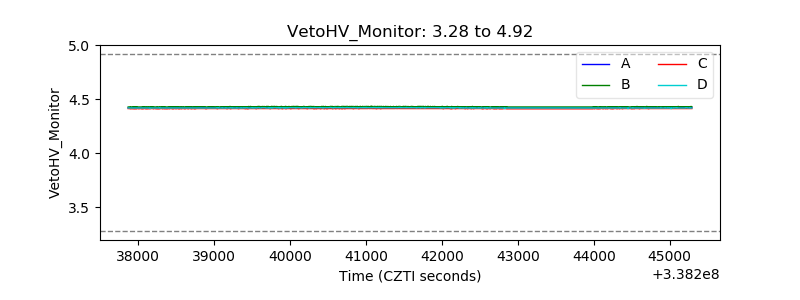 |
| Veto LLD | 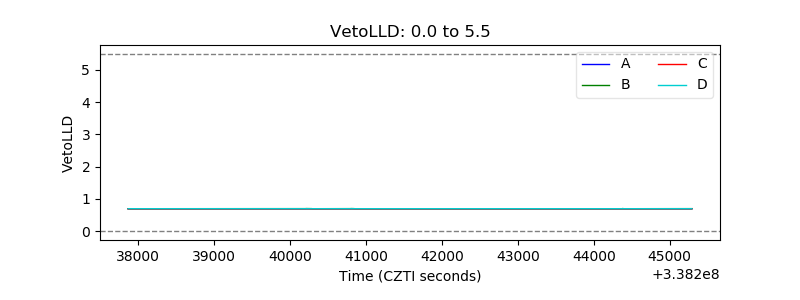 |
| Alpha Counter | 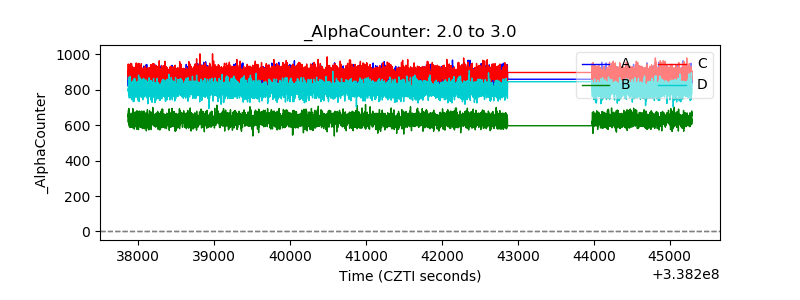 |
| _CPM_Rate | 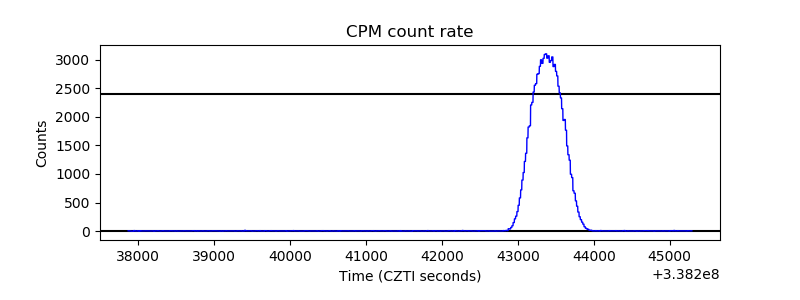 |
| CZT Counter | 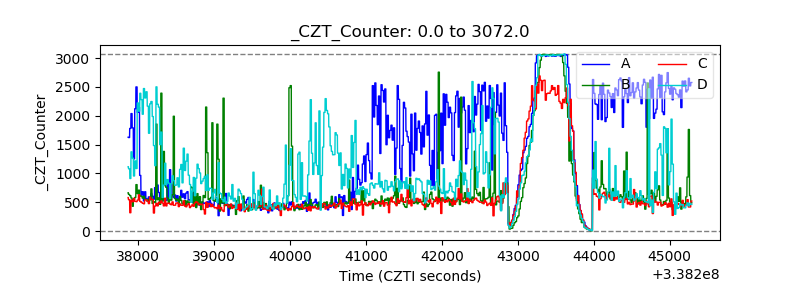 |
| +2.5 Volts monitor | 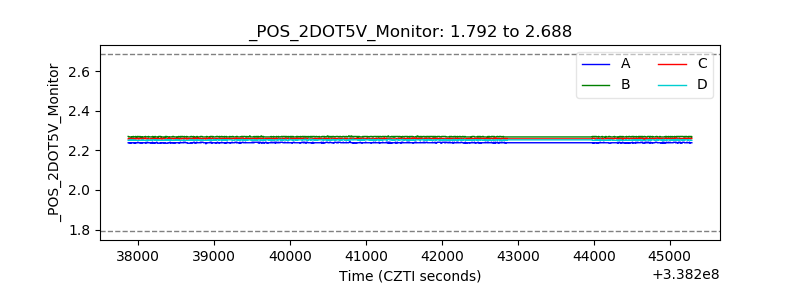 |
| +5 Volts monitor | 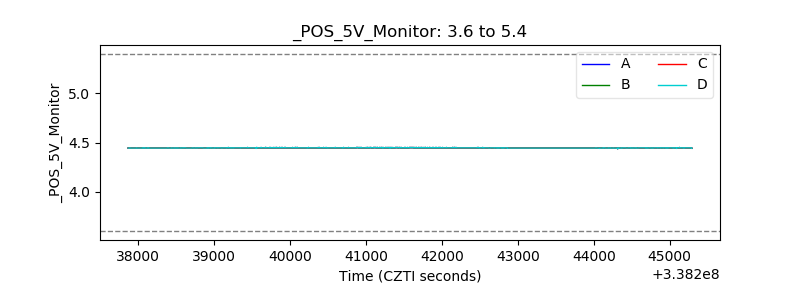 |
| _ROLL_ROT | 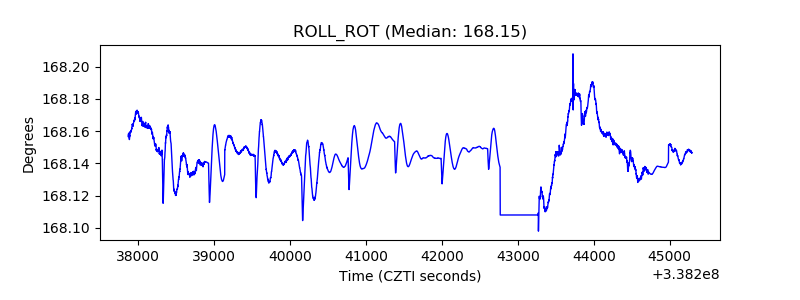 |
| _Roll_DEC | 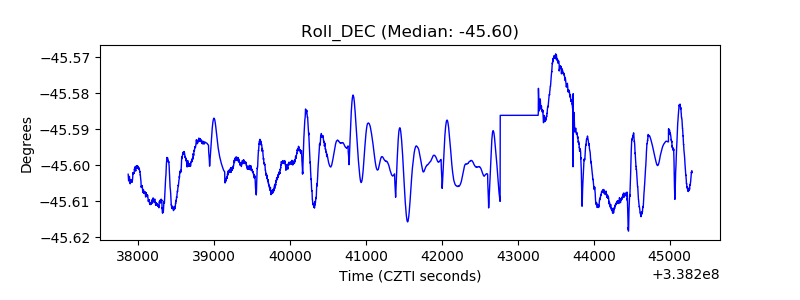 |
| _Roll_RA | 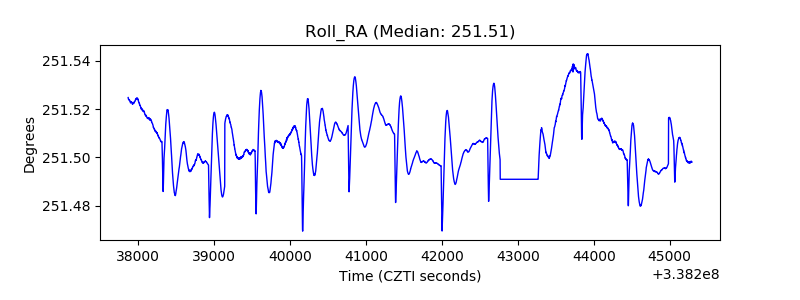 |
| Veto Counter | 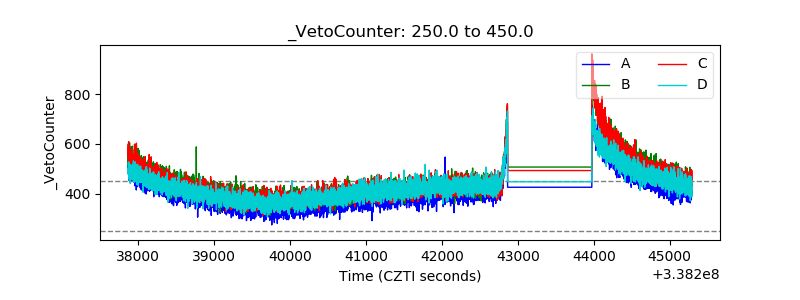 |