| Param | Original file | Final file |
|---|---|---|
| Filename | modeM0/AS1A09_134T01_9000003896_26921cztM0_level2.evt | modeM0/AS1A09_134T01_9000003896_26921cztM0_level2_quad_clean.evt |
| Size (bytes) | 812,998,080 | 81,129,600 |
| Size | 775.3 MB | 77.4 MB |
| Events in quadrant A | 13,460,881 | 297,006 |
| Events in quadrant B | 3,749,681 | 596,516 |
| Events in quadrant C | 3,271,044 | 574,164 |
| Events in quadrant D | 3,714,406 | 548,241 |
| Mode M9 | |||
|---|---|---|---|
| Quadrant | BADHDUFLAG | Total packets | Discarded packets |
| A | 0 | 19 | 0 |
| B | 0 | 20 | 0 |
| C | 0 | 20 | 0 |
| D | 0 | 20 | 0 |
| Mode M0 | |||
|---|---|---|---|
| Quadrant | BADHDUFLAG | Total packets | Discarded packets |
| A | 0 | 44250 | 0 |
| B | 0 | 15042 | 0 |
| C | 0 | 13479 | 0 |
| D | 0 | 15138 | 0 |
| Quadrant | Total seconds | Saturated seconds | Saturation percentage |
|---|---|---|---|
| A | 6293 | 4830 | 76.751947% |
| B | 6293 | 141 | 2.240585% |
| C | 6293 | 64 | 1.017003% |
| D | 6292 | 83 | 1.319135% |
Noise dominated data is calculated using 1-second bins in cleaned event files. If a bin has >2000 counts, and if more than 50% of those come from <1% of pixels, then it is considered to be noise-dominated and hence unusable.
| Quadrant | # 1 sec bins | Bins with >0 counts | Bins with >2000 counts | High rate bins dominated by noise | Noise dominated (total time) | Noise dominated (detector-on time) | Marked lightcurve |
|---|---|---|---|---|---|---|---|
| A | 7533 | 6293 | 4324 | 4324 | 57.40% | 68.71% | 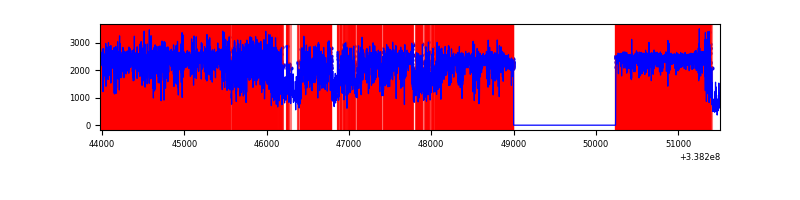 |
| B | 7533 | 6293 | 86 | 86 | 1.14% | 1.37% | 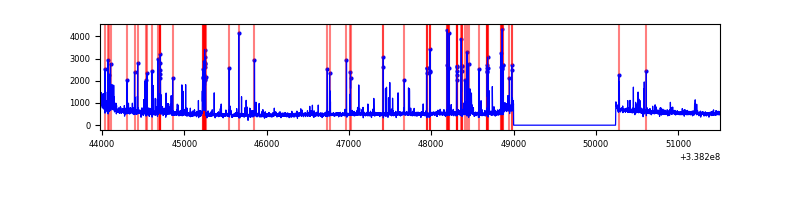 |
| C | 7533 | 6293 | 5 | 5 | 0.07% | 0.08% | 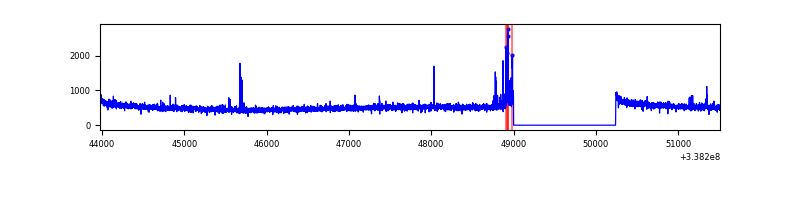 |
| D | 7532 | 6293 | 65 | 65 | 0.86% | 1.03% | 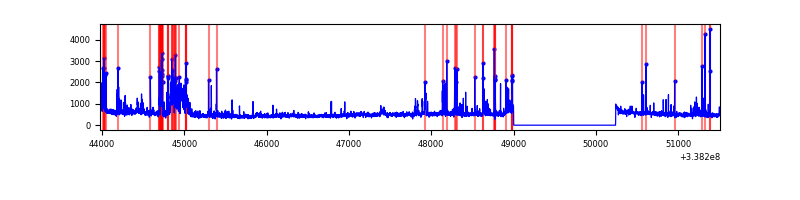 |
Top three noisy pixels from each quadrant. If the there are fewer than three noisy pixels in the level2.evt file, extra rows are filled as -1
| Pixel properties | Quadrant properties | ||||||
|---|---|---|---|---|---|---|---|
| Quadrant | DetID | PixID | Counts | Sigma | Mean | Median | Sigma |
| A | 14 | 235 | 11275170 | 106045.81 | 531 | 523 | 106.3 |
| A | 0 | 13 | 86150 | 805.38 | 531 | 523 | 106.3 |
| A | 8 | 192 | 38185 | 354.24 | 531 | 523 | 106.3 |
| B | 0 | 189 | 225657 | 1484.51 | 816 | 797 | 151.5 |
| B | 10 | 246 | 150648 | 989.3 | 816 | 797 | 151.5 |
| B | 3 | 64 | 46768 | 303.5 | 816 | 797 | 151.5 |
| C | 14 | 238 | 128955 | 706.53 | 786 | 792 | 181.4 |
| C | 0 | 207 | 57953 | 315.11 | 786 | 792 | 181.4 |
| C | 15 | 208 | 15365 | 80.34 | 786 | 792 | 181.4 |
| D | 7 | 80 | 290804 | 1516.81 | 775 | 757 | 191.2 |
| D | 2 | 250 | 265017 | 1381.96 | 775 | 757 | 191.2 |
| D | 1 | 52 | 64695 | 334.37 | 775 | 757 | 191.2 |
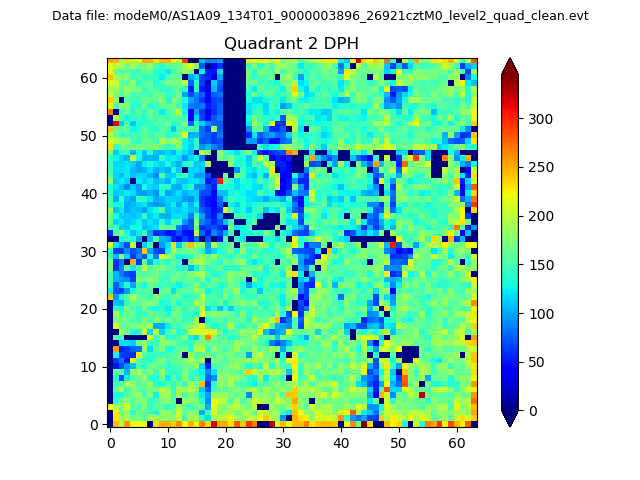
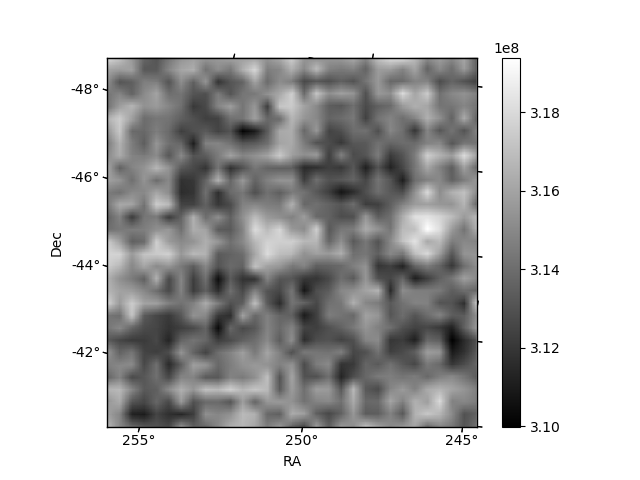
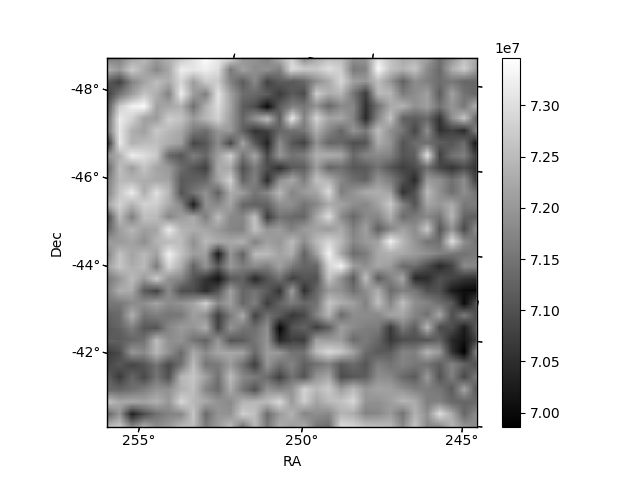
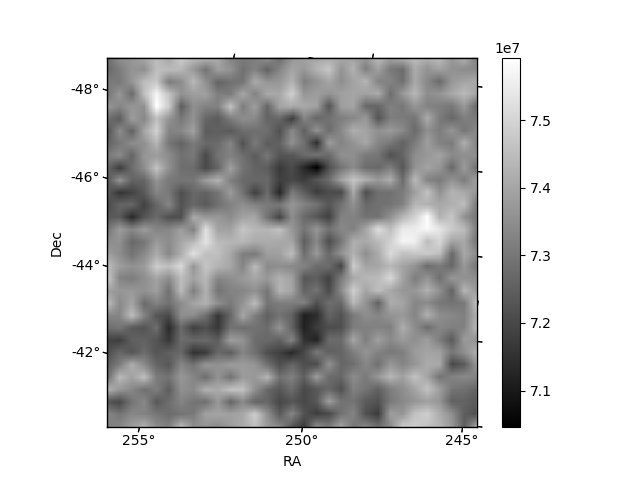
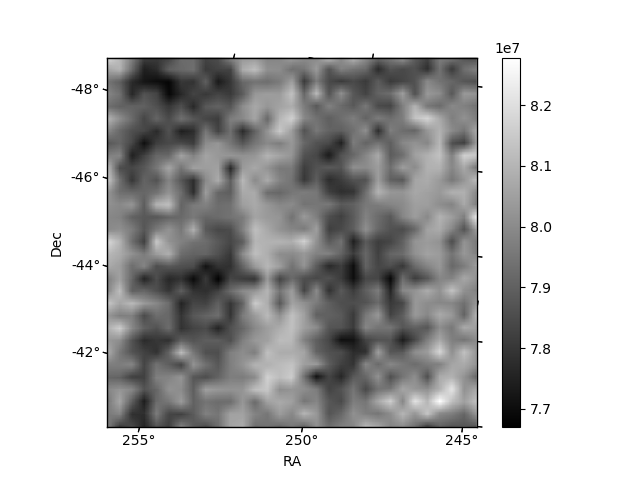
Histogram calculated using DETX and DETY for each event in the final _common_clean file
| Quadrant A | 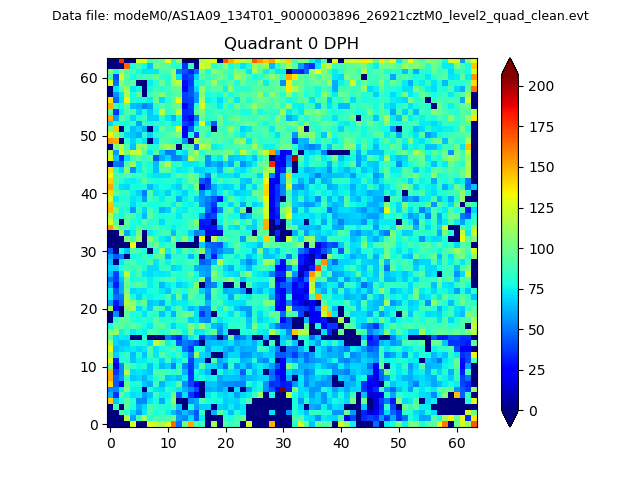 |
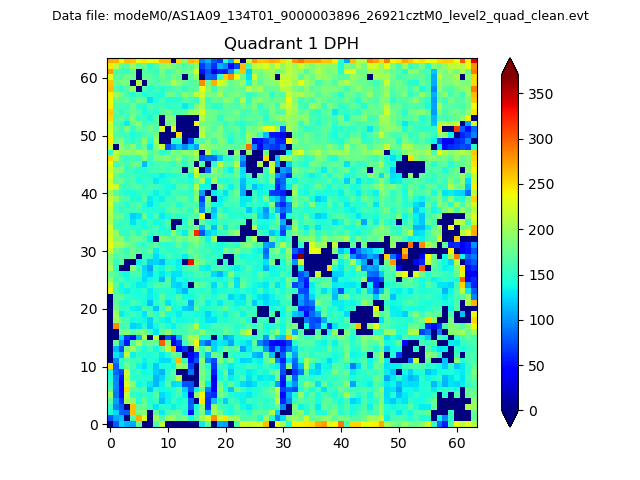 |
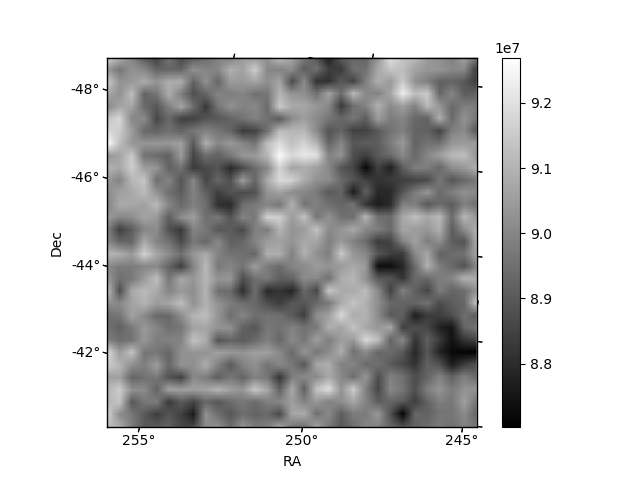
Quadrant B |
|---|---|---|---|
| Quadrant D | 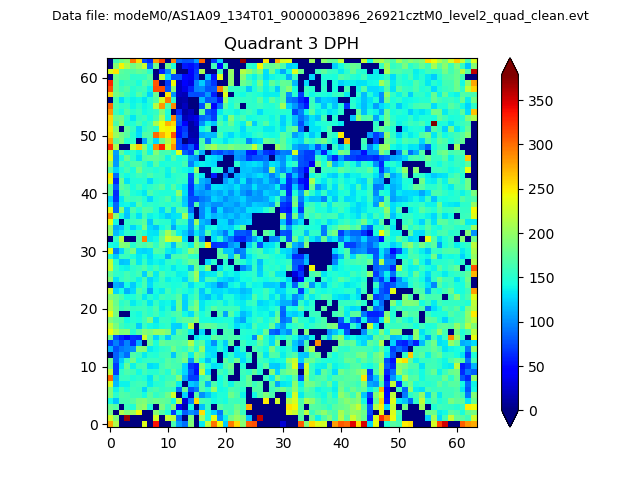 |
 |
Quadrant C |
| Plot type | Count rate plots | Images |
|---|---|---|
| Comparison with Poisson distribution Blue bars denote a histogram of data divided into 1 sec bins. Red curve is a Poisson curve with rate = median count rate of data. |
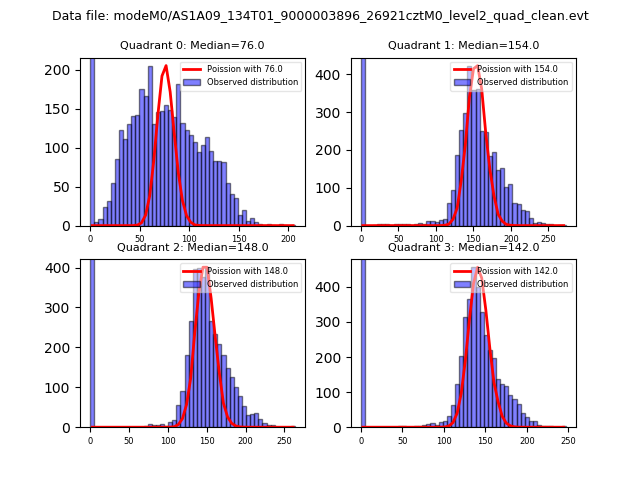 |
 |
| Quadrant-wise count rates Data is divided into 100 sec bins |
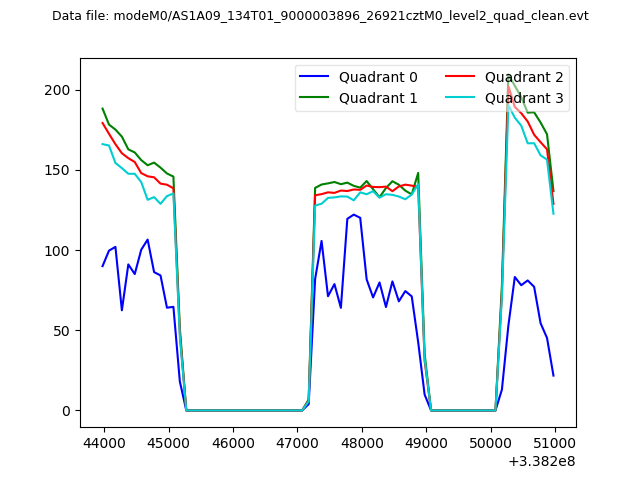 |
|
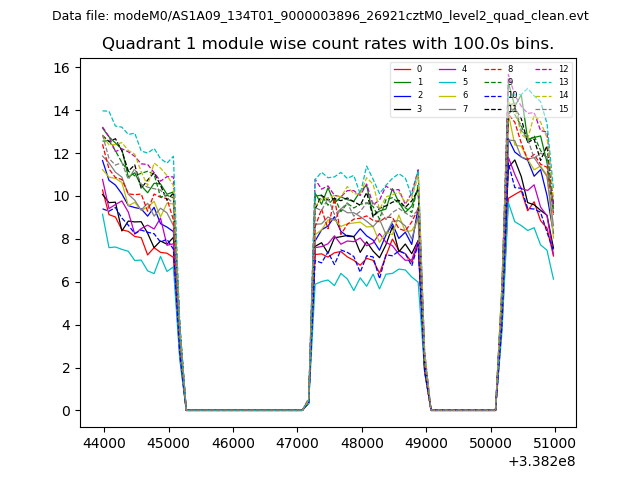
| Module-wise count rates for Quadrant A Data is divided into 100 sec bins |
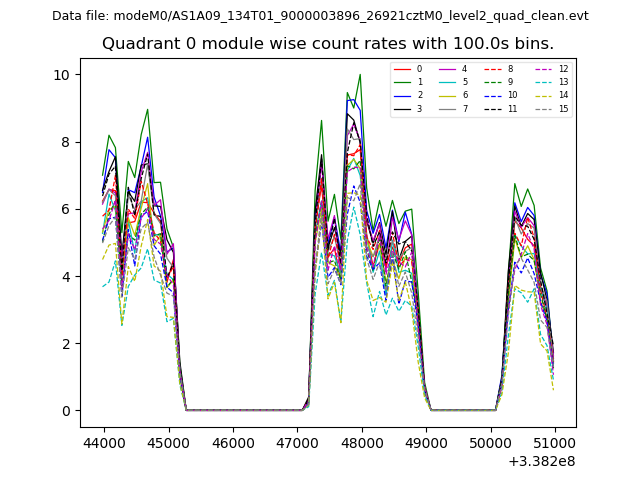 |
 |
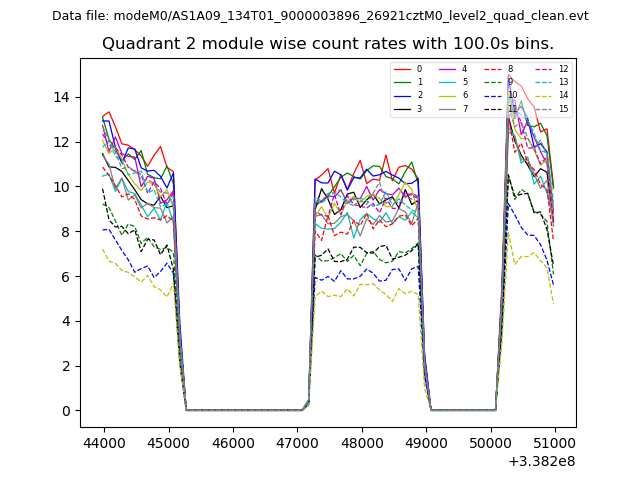
| Module-wise count rates for Quadrant B Data is divided into 100 sec bins |
 |
 |
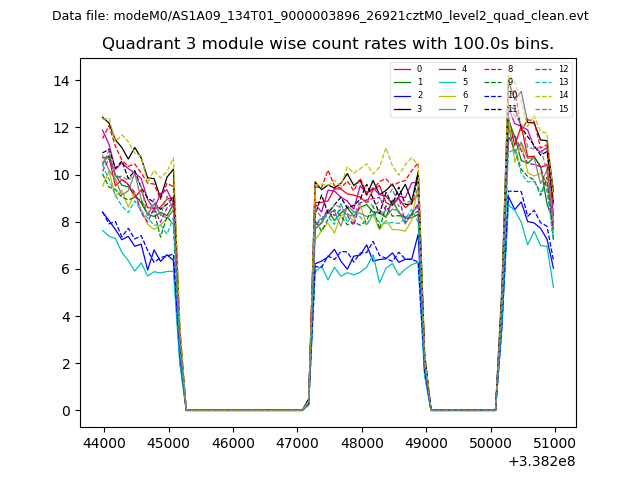
| Module-wise count rates for Quadrant C Data is divided into 100 sec bins |
 |
 |
| Module-wise count rates for Quadrant D Data is divided into 100 sec bins |
 |
 |
| Parameter | Plot |
|---|---|
| CZT HV Monitor | 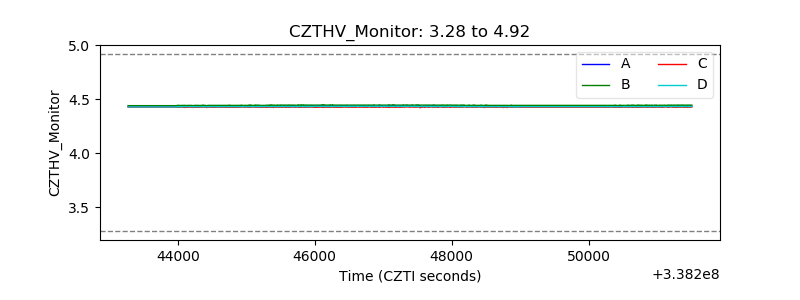 |
| D_VDD | 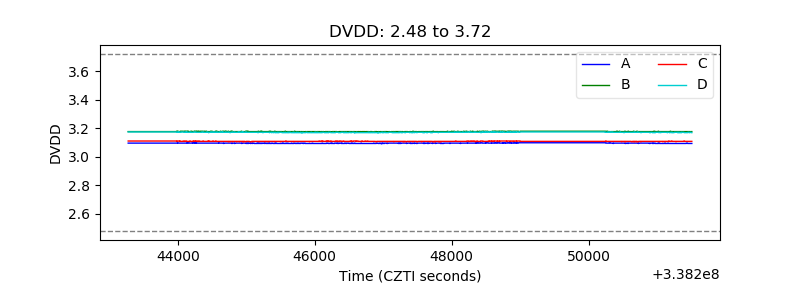 |
| Temperature 1 | 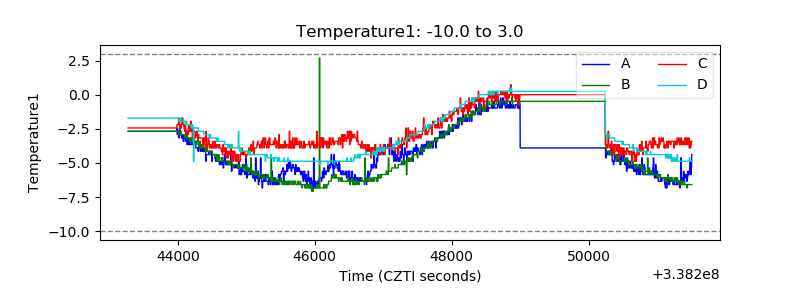 |
| Veto HV Monitor | 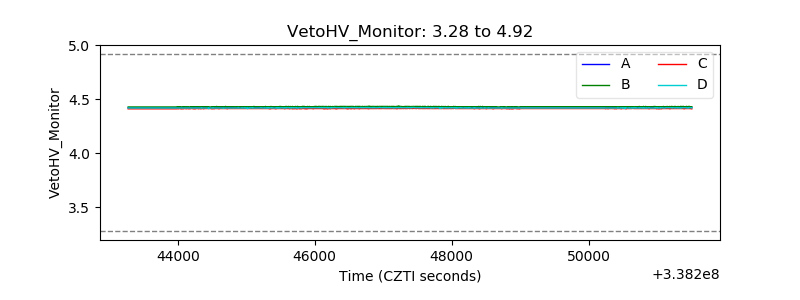 |
| Veto LLD | 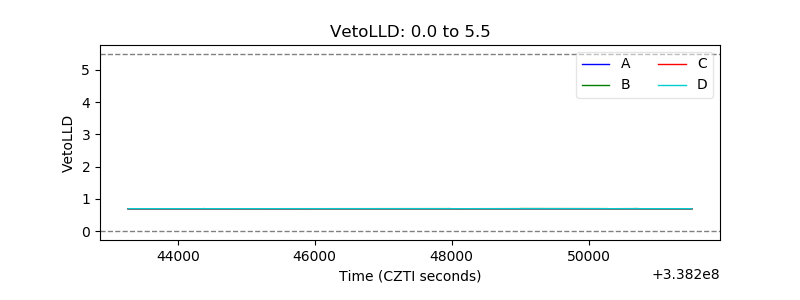 |
| Alpha Counter | 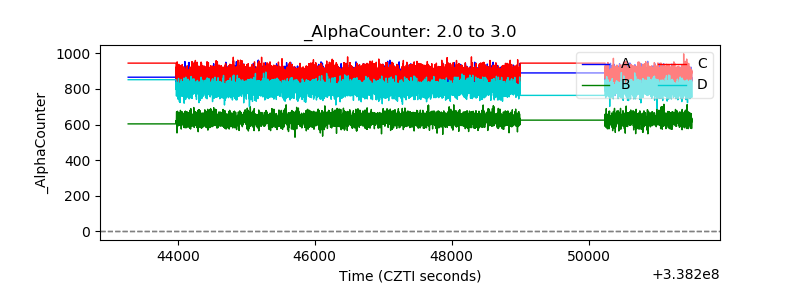 |
| _CPM_Rate | 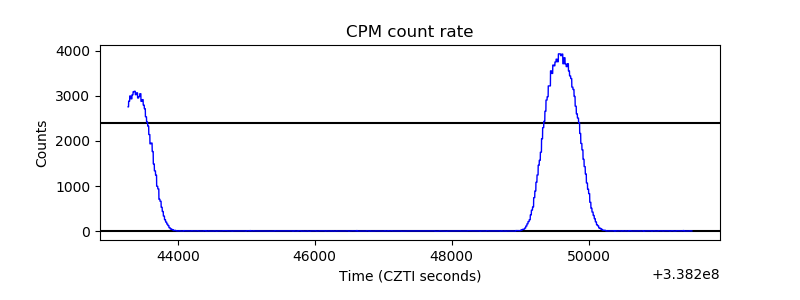 |
| CZT Counter | 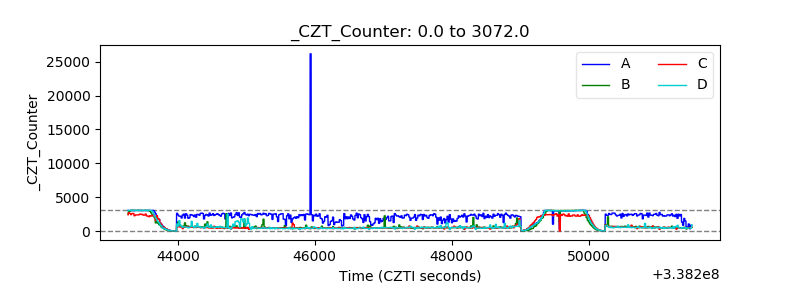 |
| +2.5 Volts monitor |  |
| +5 Volts monitor |  |
| _ROLL_ROT | 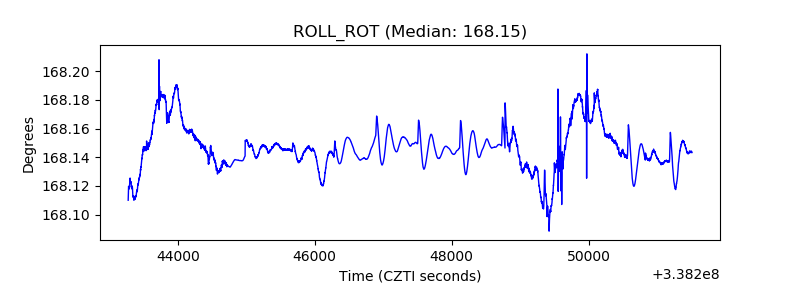 |
| _Roll_DEC | 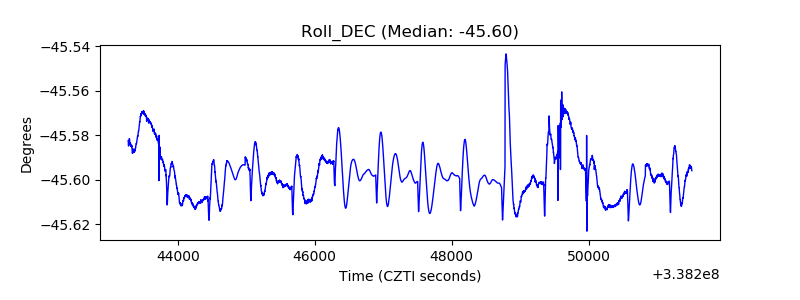 |
| _Roll_RA | 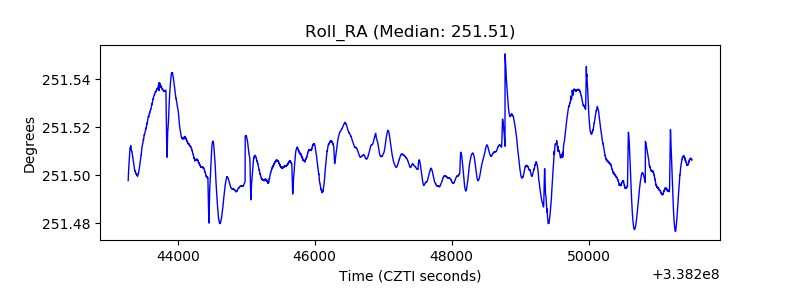 |
| Veto Counter | 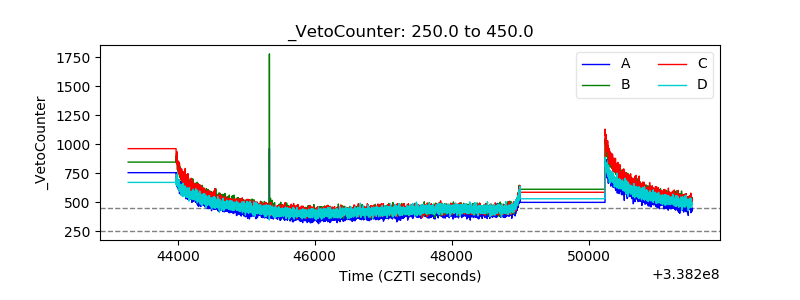 |