| Param | Original file | Final file |
|---|---|---|
| Filename | modeM0/AS1A09_134T01_9000003896_26922cztM0_level2.evt | modeM0/AS1A09_134T01_9000003896_26922cztM0_level2_quad_clean.evt |
| Size (bytes) | 834,822,720 | 69,050,880 |
| Size | 796.1 MB | 65.9 MB |
| Events in quadrant A | 13,583,320 | 108,917 |
| Events in quadrant B | 4,395,592 | 534,283 |
| Events in quadrant C | 3,358,095 | 518,689 |
| Events in quadrant D | 3,530,703 | 499,248 |
| Mode M9 | |||
|---|---|---|---|
| Quadrant | BADHDUFLAG | Total packets | Discarded packets |
| A | 0 | 22 | 0 |
| B | 0 | 23 | 0 |
| C | 0 | 23 | 0 |
| D | 0 | 23 | 0 |
| Mode M0 | |||
|---|---|---|---|
| Quadrant | BADHDUFLAG | Total packets | Discarded packets |
| A | 0 | 44485 | 0 |
| B | 0 | 16856 | 0 |
| C | 0 | 13576 | 0 |
| D | 0 | 14452 | 0 |
| Quadrant | Total seconds | Saturated seconds | Saturation percentage |
|---|---|---|---|
| A | 6133 | 5683 | 92.662645% |
| B | 6133 | 237 | 3.864340% |
| C | 6133 | 55 | 0.896788% |
| D | 6133 | 57 | 0.929398% |
Noise dominated data is calculated using 1-second bins in cleaned event files. If a bin has >2000 counts, and if more than 50% of those come from <1% of pixels, then it is considered to be noise-dominated and hence unusable.
| Quadrant | # 1 sec bins | Bins with >0 counts | Bins with >2000 counts | High rate bins dominated by noise | Noise dominated (total time) | Noise dominated (detector-on time) | Marked lightcurve |
|---|---|---|---|---|---|---|---|
| A | 7482 | 6132 | 4762 | 4762 | 63.65% | 77.66% | 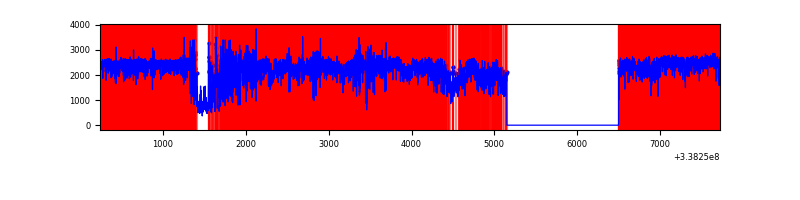 |
| B | 7483 | 6134 | 125 | 125 | 1.67% | 2.04% | 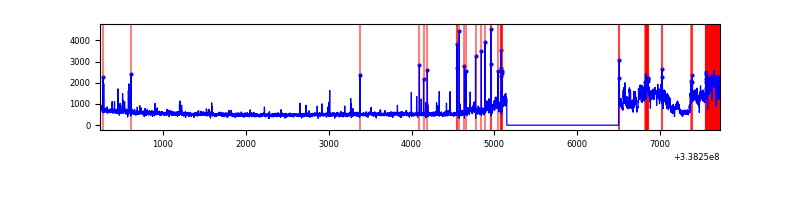 |
| C | 7483 | 6134 | 1 | 1 | 0.01% | 0.02% | 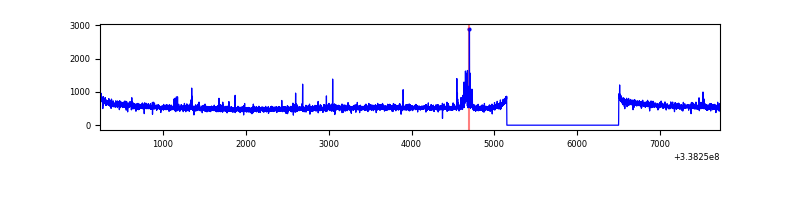 |
| D | 7483 | 6134 | 34 | 34 | 0.45% | 0.55% | 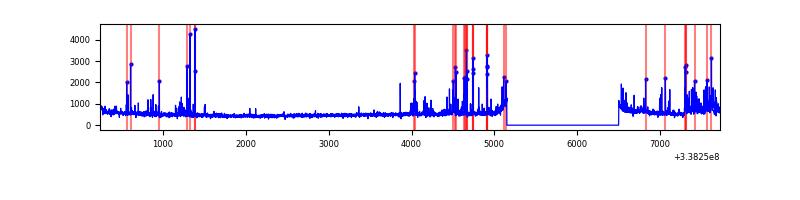 |
Top three noisy pixels from each quadrant. If the there are fewer than three noisy pixels in the level2.evt file, extra rows are filled as -1
| Pixel properties | Quadrant properties | ||||||
|---|---|---|---|---|---|---|---|
| Quadrant | DetID | PixID | Counts | Sigma | Mean | Median | Sigma |
| A | 14 | 235 | 12419268 | 224355.53 | 272 | 268 | 55.4 |
| A | 4 | 2 | 59730 | 1074.21 | 272 | 268 | 55.4 |
| A | 8 | 192 | 32934 | 590.13 | 272 | 268 | 55.4 |
| B | 0 | 189 | 928315 | 6070.01 | 831 | 814 | 152.8 |
| B | 15 | 33 | 132848 | 864.09 | 831 | 814 | 152.8 |
| B | 0 | 229 | 22344 | 140.9 | 831 | 814 | 152.8 |
| C | 14 | 238 | 132992 | 711.47 | 808 | 814 | 185.8 |
| C | 0 | 207 | 49636 | 262.79 | 808 | 814 | 185.8 |
| C | 2 | 16 | 16357 | 83.66 | 808 | 814 | 185.8 |
| D | 7 | 80 | 230491 | 1208.2 | 798 | 781 | 190.1 |
| D | 2 | 250 | 171062 | 895.62 | 798 | 781 | 190.1 |
| D | 11 | 176 | 31912 | 163.74 | 798 | 781 | 190.1 |
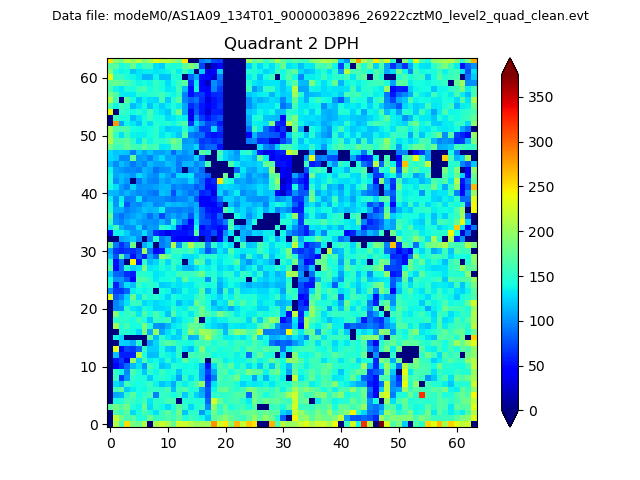
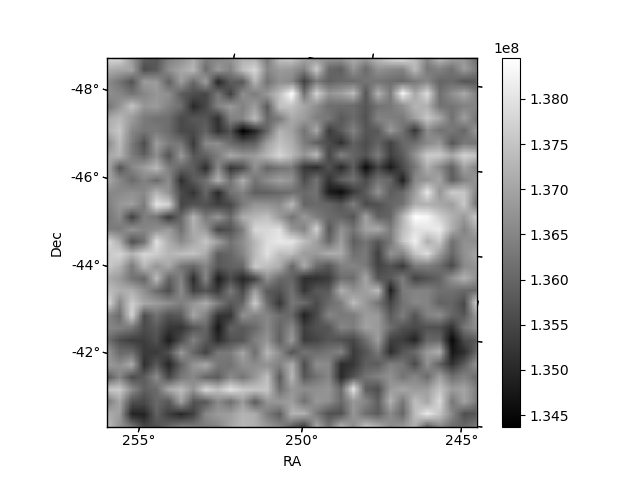
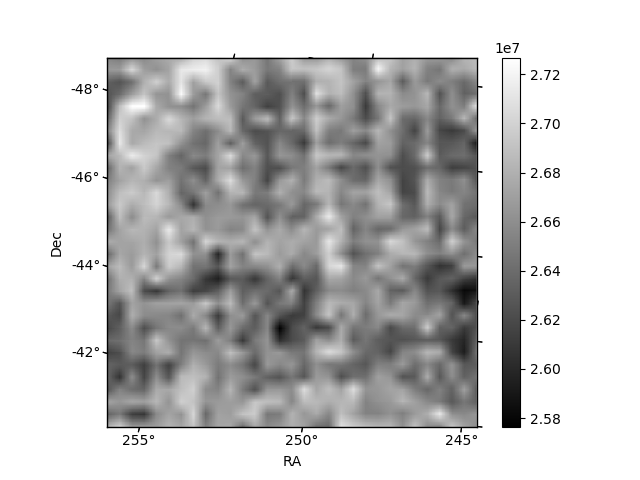
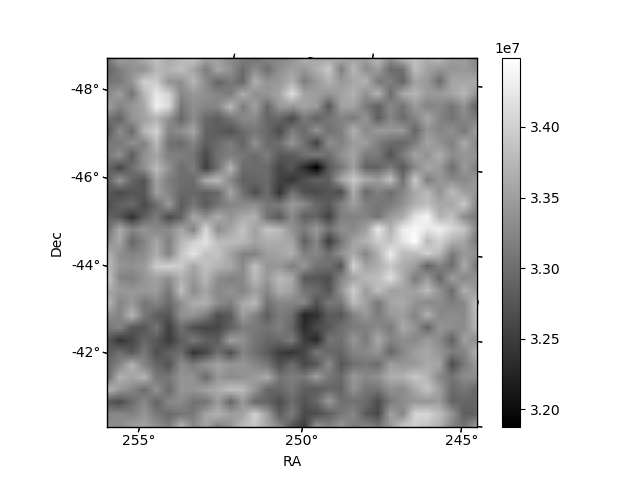
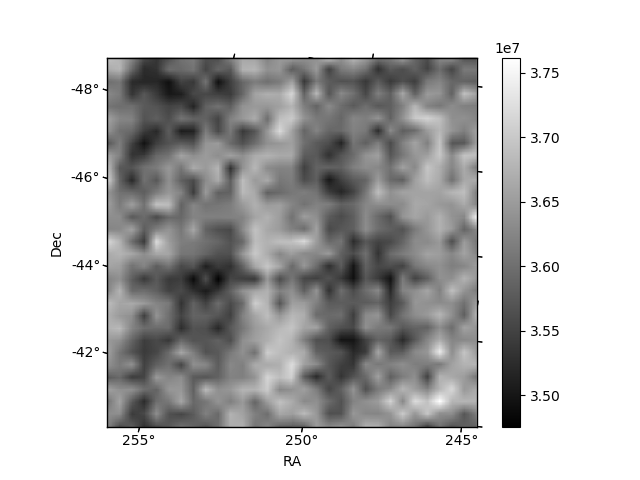
Histogram calculated using DETX and DETY for each event in the final _common_clean file
| Quadrant A | 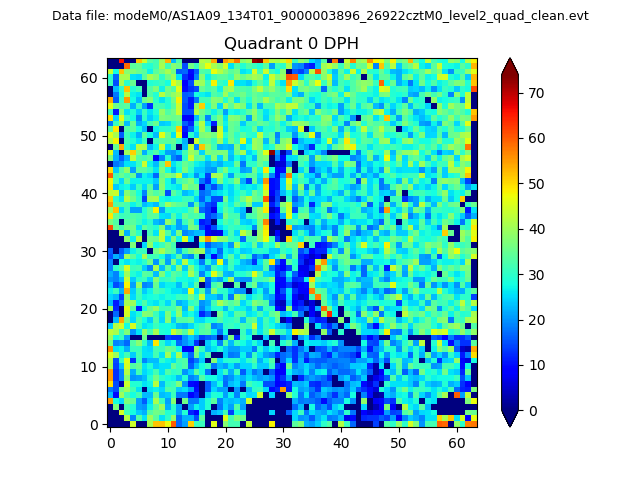 |
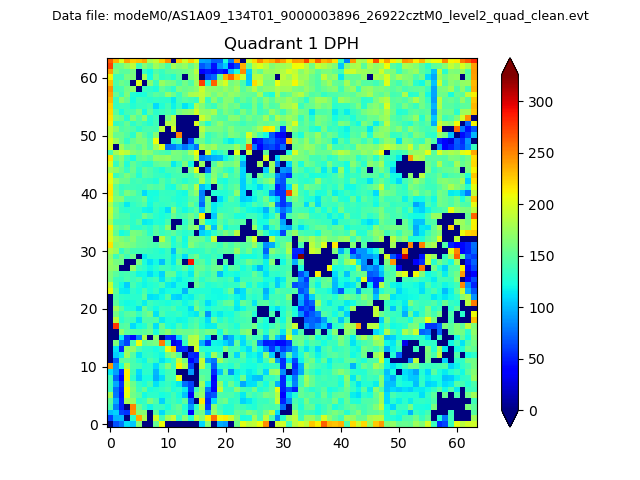 |
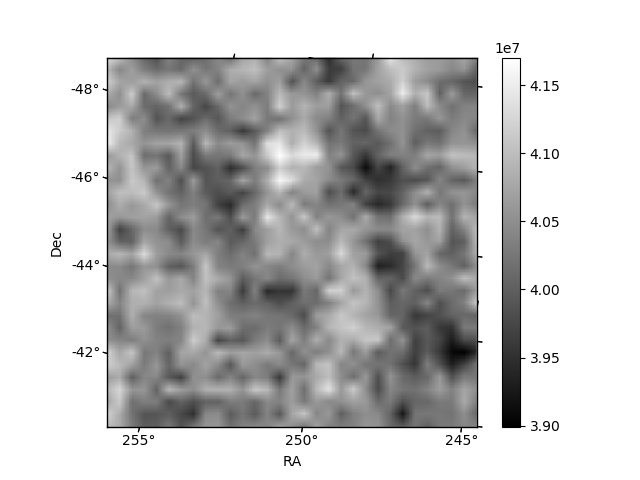
Quadrant B |
|---|---|---|---|
| Quadrant D | 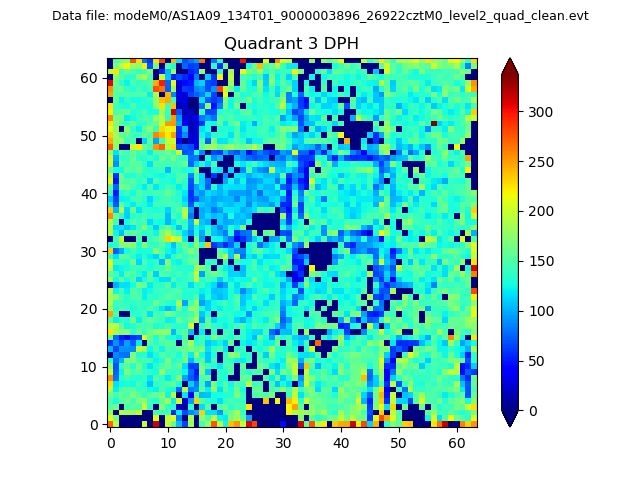 |
 |
Quadrant C |
| Plot type | Count rate plots | Images |
|---|---|---|
| Comparison with Poisson distribution Blue bars denote a histogram of data divided into 1 sec bins. Red curve is a Poisson curve with rate = median count rate of data. |
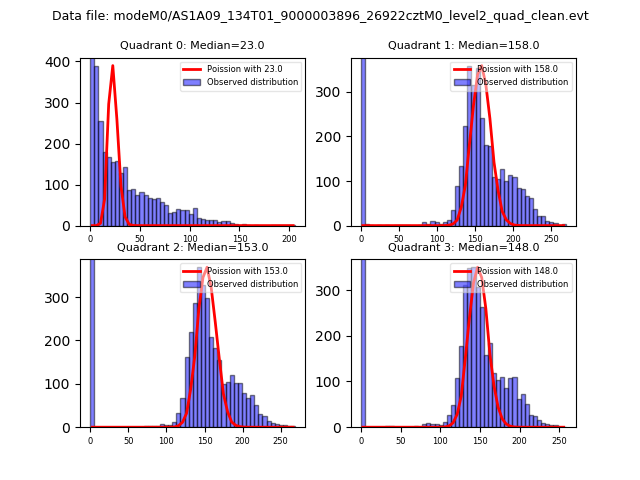 |
 |
| Quadrant-wise count rates Data is divided into 100 sec bins |
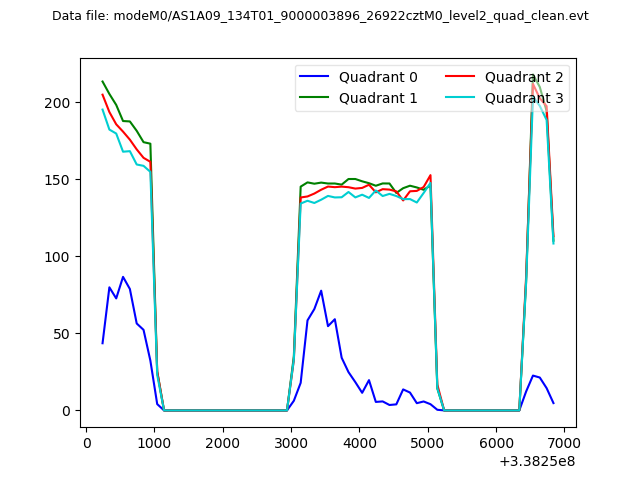 |
|
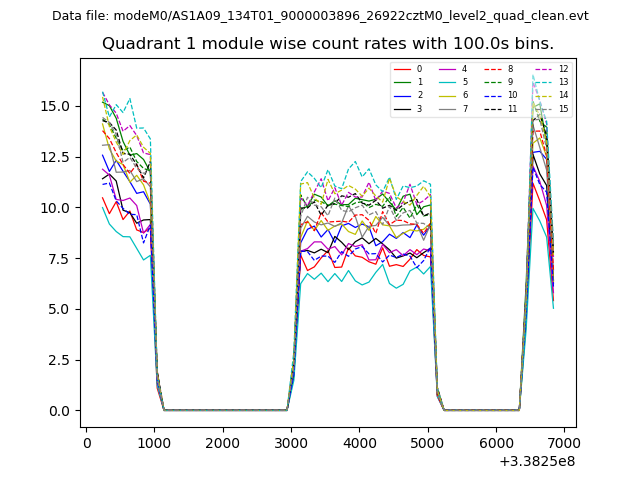
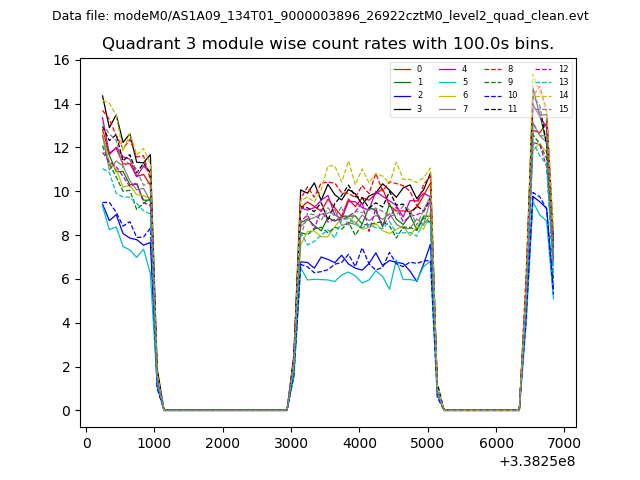
| Module-wise count rates for Quadrant A Data is divided into 100 sec bins |
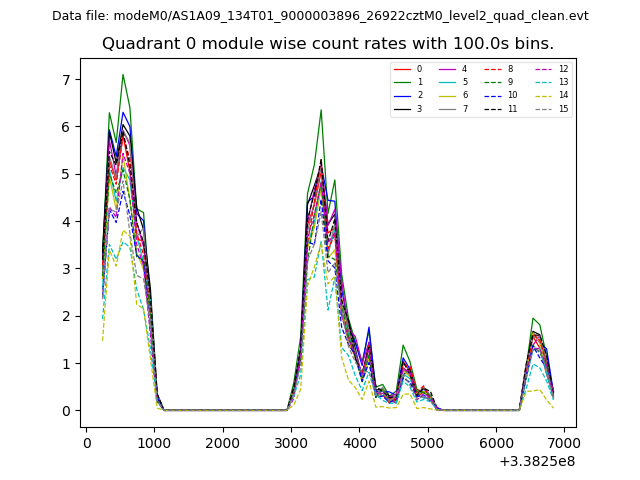 |
 |
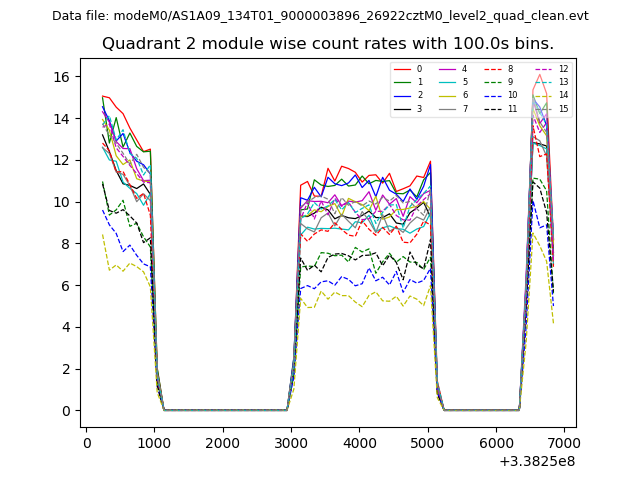
| Module-wise count rates for Quadrant B Data is divided into 100 sec bins |
 |
 |
| Module-wise count rates for Quadrant C Data is divided into 100 sec bins |
 |
 |
| Module-wise count rates for Quadrant D Data is divided into 100 sec bins |
 |
 |
| Parameter | Plot |
|---|---|
| CZT HV Monitor | 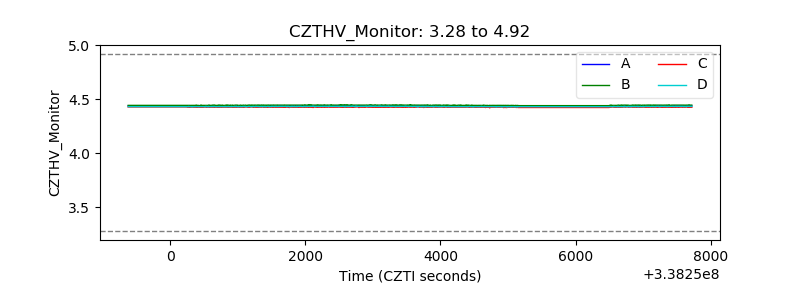 |
| D_VDD | 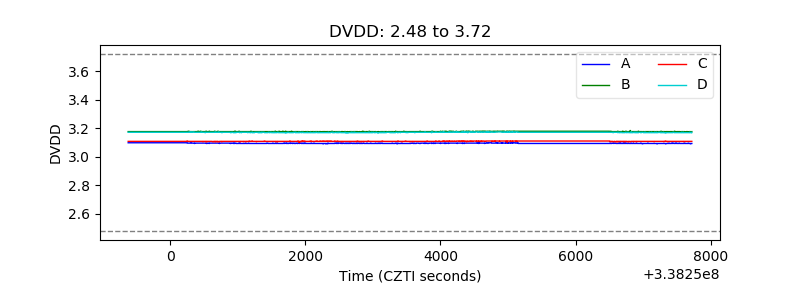 |
| Temperature 1 | 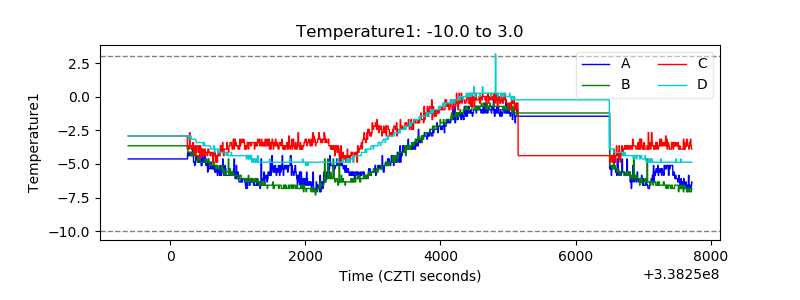 |
| Veto HV Monitor | 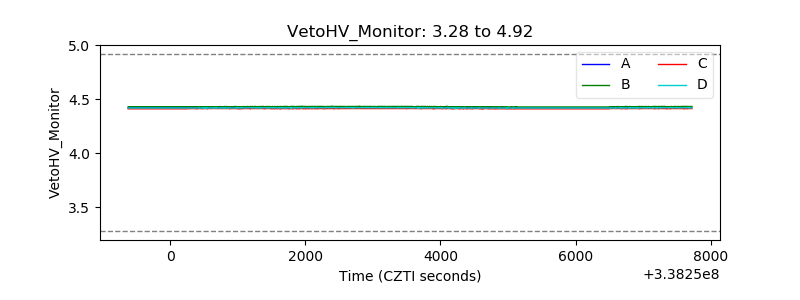 |
| Veto LLD | 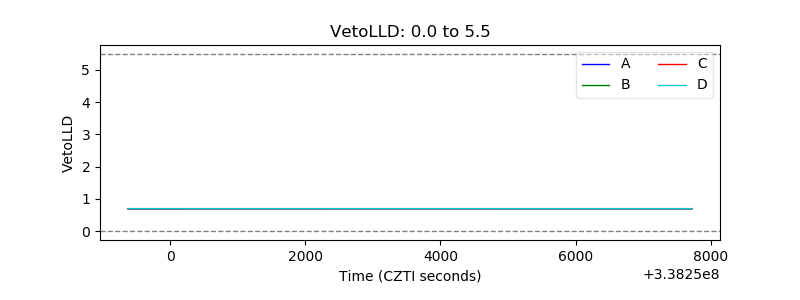 |
| Alpha Counter | 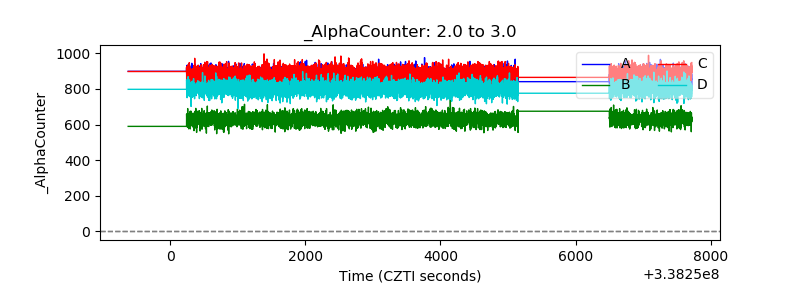 |
| _CPM_Rate | 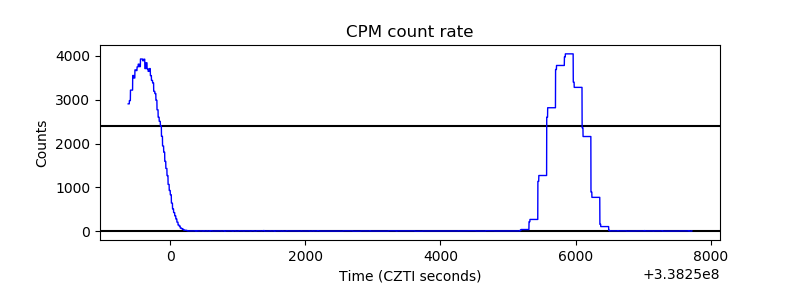 |
| CZT Counter | 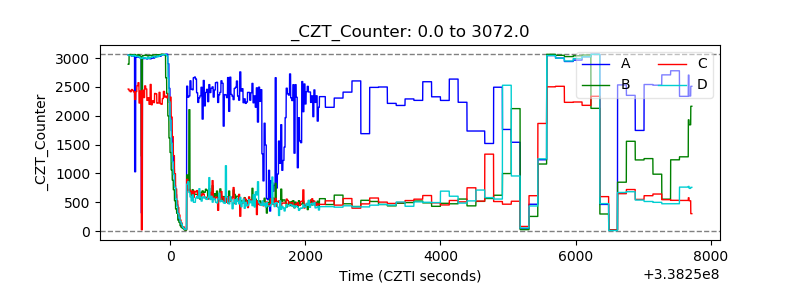 |
| +2.5 Volts monitor | 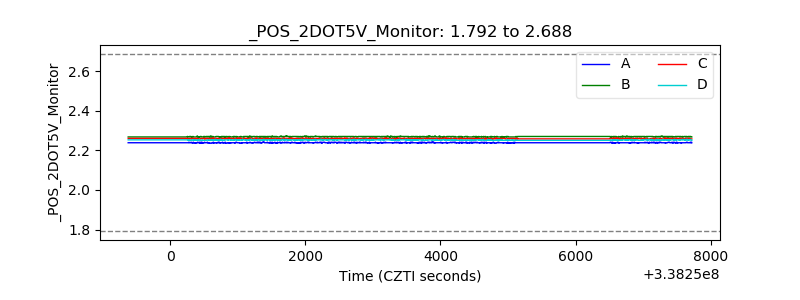 |
| +5 Volts monitor |  |
| _ROLL_ROT | 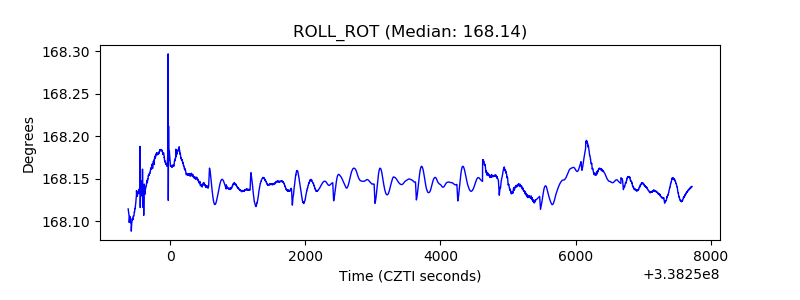 |
| _Roll_DEC |  |
| _Roll_RA | 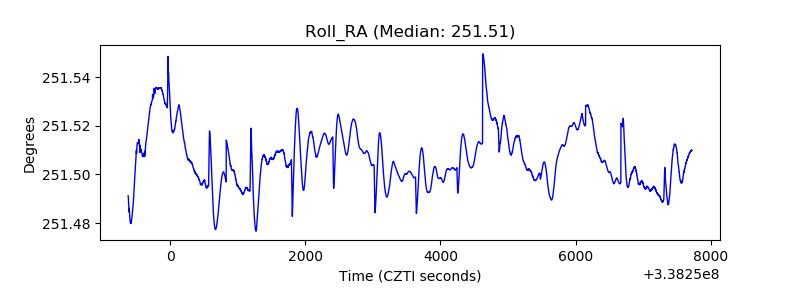 |
| Veto Counter | 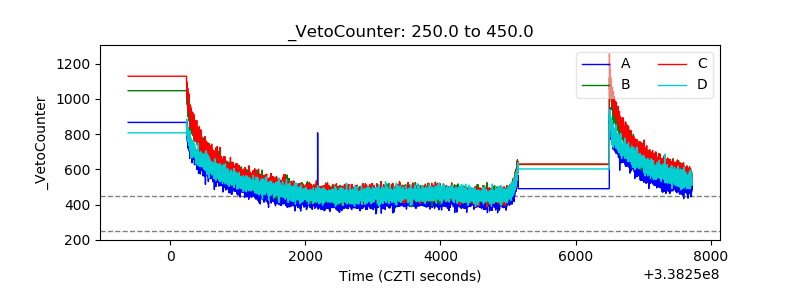 |