| Param | Original file | Final file |
|---|---|---|
| Filename | modeM0/AS1A09_134T01_9000003896_26923cztM0_level2.evt | modeM0/AS1A09_134T01_9000003896_26923cztM0_level2_quad_clean.evt |
| Size (bytes) | 1,198,408,320 | 53,524,800 |
| Size | 1.1 GB | 51.0 MB |
| Events in quadrant A | 14,781,726 | 50,106 |
| Events in quadrant B | 12,083,487 | 286,427 |
| Events in quadrant C | 3,594,695 | 433,297 |
| Events in quadrant D | 5,407,482 | 404,187 |
| Mode M9 | |||
|---|---|---|---|
| Quadrant | BADHDUFLAG | Total packets | Discarded packets |
| A | 0 | 15 | 0 |
| B | 0 | 16 | 0 |
| C | 0 | 16 | 0 |
| D | 0 | 16 | 0 |
| Mode M0 | |||
|---|---|---|---|
| Quadrant | BADHDUFLAG | Total packets | Discarded packets |
| A | 0 | 48219 | 0 |
| B | 0 | 40268 | 0 |
| C | 0 | 14411 | 0 |
| D | 0 | 20334 | 0 |
| Quadrant | Total seconds | Saturated seconds | Saturation percentage |
|---|---|---|---|
| A | 6365 | 6160 | 96.779262% |
| B | 6364 | 3876 | 60.905091% |
| C | 6364 | 78 | 1.225644% |
| D | 6364 | 407 | 6.395349% |
Noise dominated data is calculated using 1-second bins in cleaned event files. If a bin has >2000 counts, and if more than 50% of those come from <1% of pixels, then it is considered to be noise-dominated and hence unusable.
| Quadrant | # 1 sec bins | Bins with >0 counts | Bins with >2000 counts | High rate bins dominated by noise | Noise dominated (total time) | Noise dominated (detector-on time) | Marked lightcurve |
|---|---|---|---|---|---|---|---|
| A | 7774 | 6364 | 5346 | 5346 | 68.77% | 84.00% | 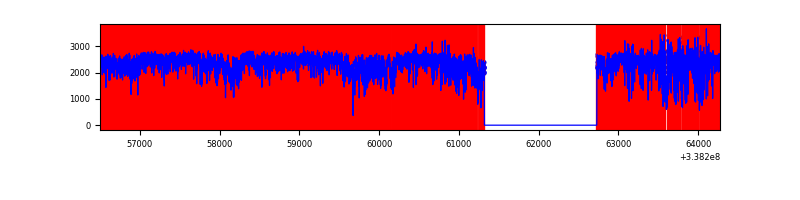 |
| B | 7774 | 6364 | 3244 | 3244 | 41.73% | 50.97% | 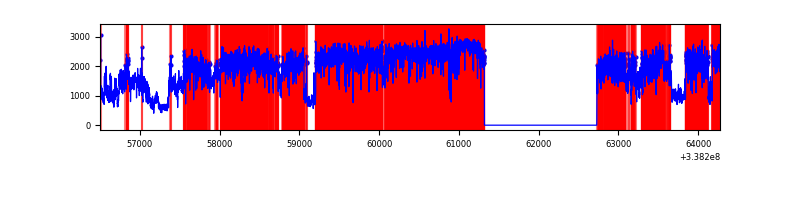 |
| C | 7774 | 6365 | 5 | 5 | 0.06% | 0.08% | 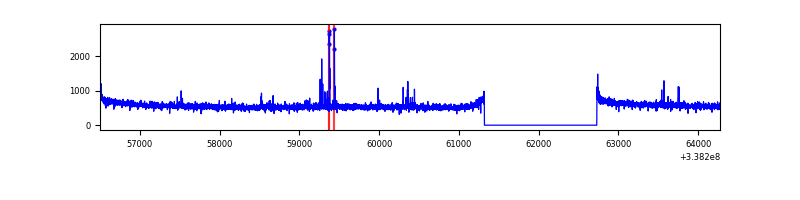 |
| D | 7774 | 6365 | 349 | 349 | 4.49% | 5.48% | 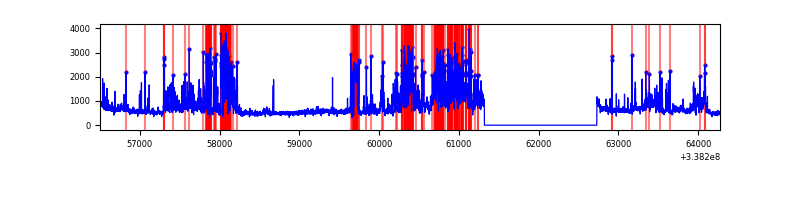 |
Top three noisy pixels from each quadrant. If the there are fewer than three noisy pixels in the level2.evt file, extra rows are filled as -1
| Pixel properties | Quadrant properties | ||||||
|---|---|---|---|---|---|---|---|
| Quadrant | DetID | PixID | Counts | Sigma | Mean | Median | Sigma |
| A | 14 | 235 | 13774680 | 327318.86 | 207 | 204 | 42.1 |
| A | 0 | 13 | 153392 | 3640.16 | 207 | 204 | 42.1 |
| A | 8 | 192 | 30310 | 715.4 | 207 | 204 | 42.1 |
| B | 0 | 189 | 8548801 | 64795.54 | 735 | 722 | 131.9 |
| B | 3 | 64 | 522925 | 3958.37 | 735 | 722 | 131.9 |
| B | 15 | 33 | 46478 | 346.84 | 735 | 722 | 131.9 |
| C | 14 | 238 | 143464 | 716.1 | 869 | 878 | 199.1 |
| C | 15 | 208 | 48909 | 241.22 | 869 | 878 | 199.1 |
| C | 0 | 207 | 9224 | 41.91 | 869 | 878 | 199.1 |
| D | 7 | 80 | 1725820 | 8702.78 | 843 | 825 | 198.2 |
| D | 2 | 250 | 231814 | 1165.36 | 843 | 825 | 198.2 |
| D | 12 | 233 | 171059 | 858.85 | 843 | 825 | 198.2 |
Histogram calculated using DETX and DETY for each event in the final _common_clean file
| Quadrant A | 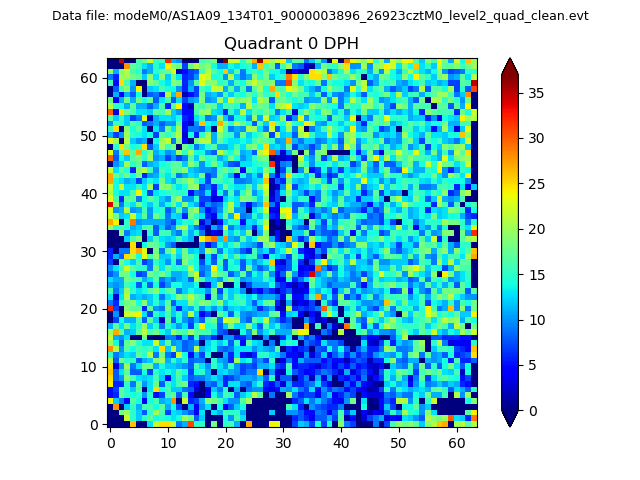 |
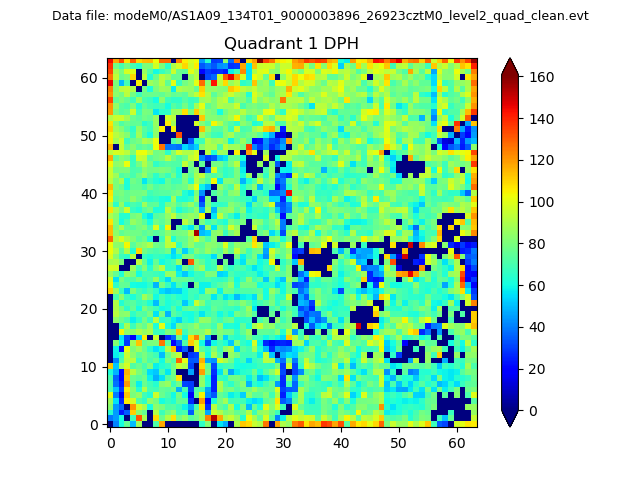 |
Quadrant B |
|---|---|---|---|
| Quadrant D | 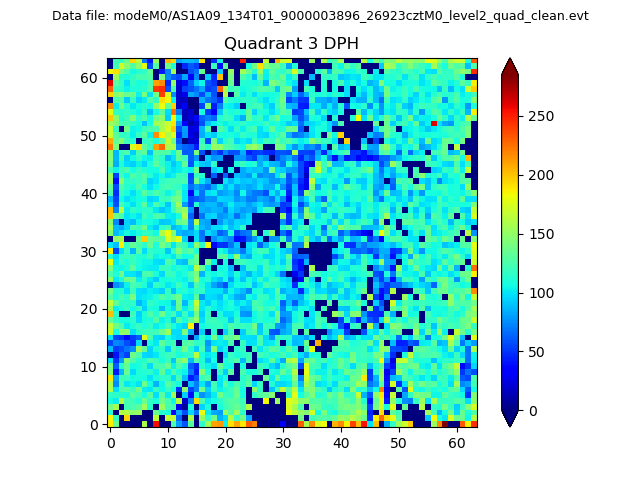 |
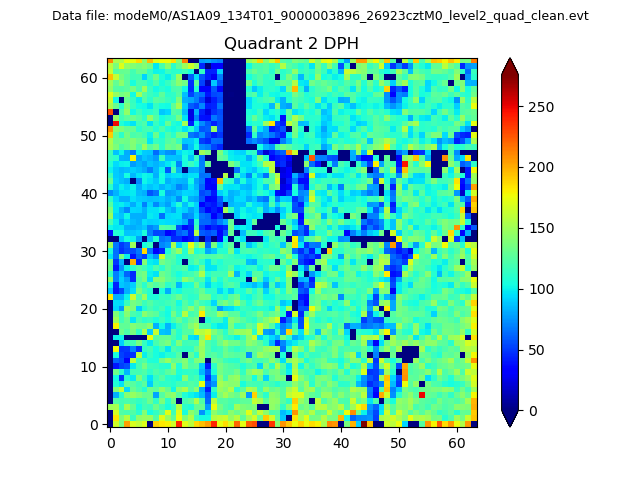 |
Quadrant C |
| Plot type | Count rate plots | Images |
|---|---|---|
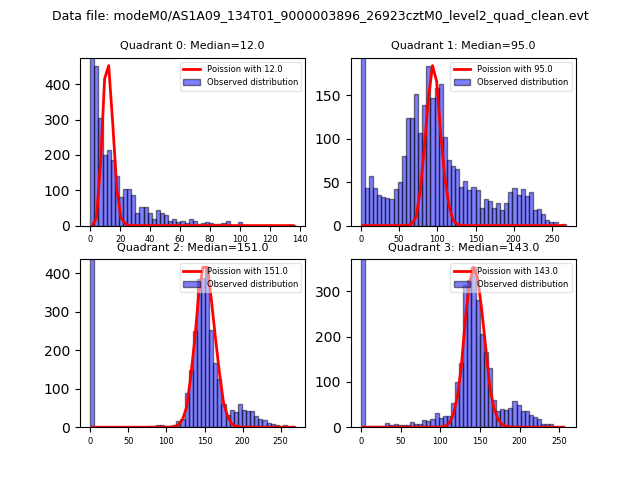
| Comparison with Poisson distribution Blue bars denote a histogram of data divided into 1 sec bins. Red curve is a Poisson curve with rate = median count rate of data. |
 |
 |
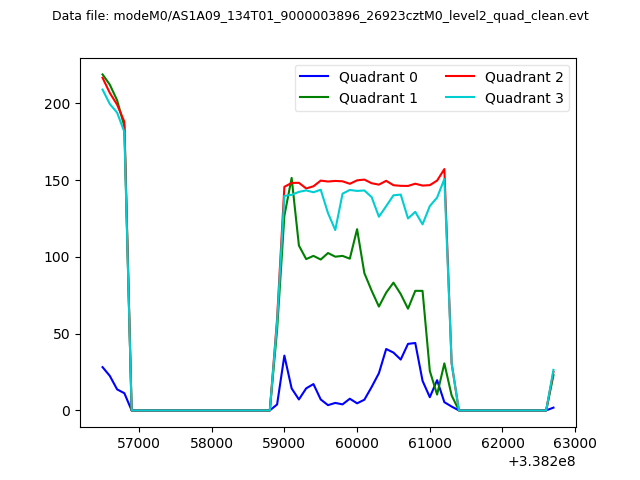
| Quadrant-wise count rates Data is divided into 100 sec bins |
 |
|
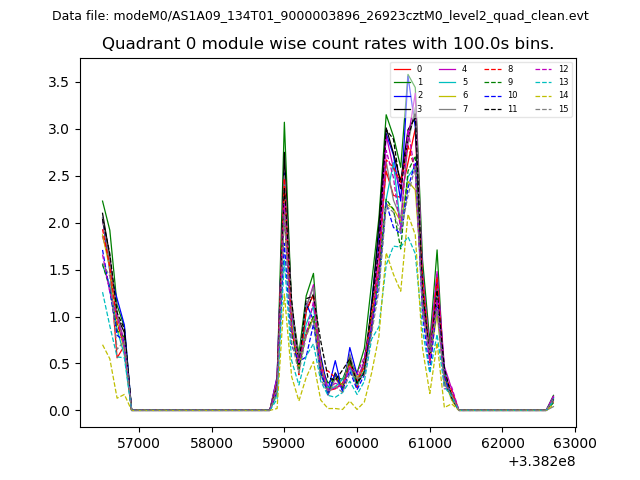
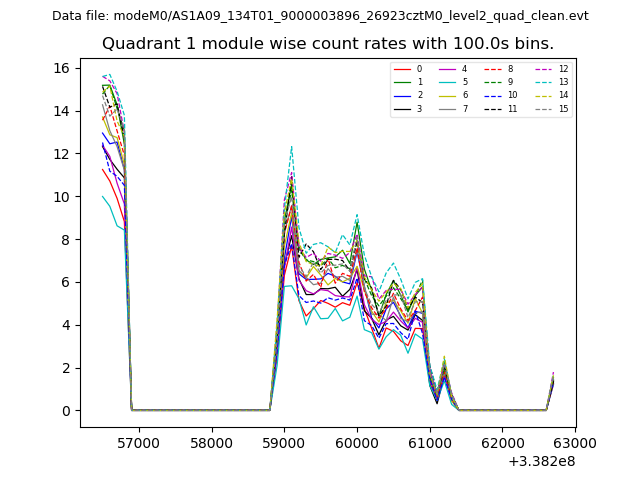
| Module-wise count rates for Quadrant A Data is divided into 100 sec bins |
 |
 |
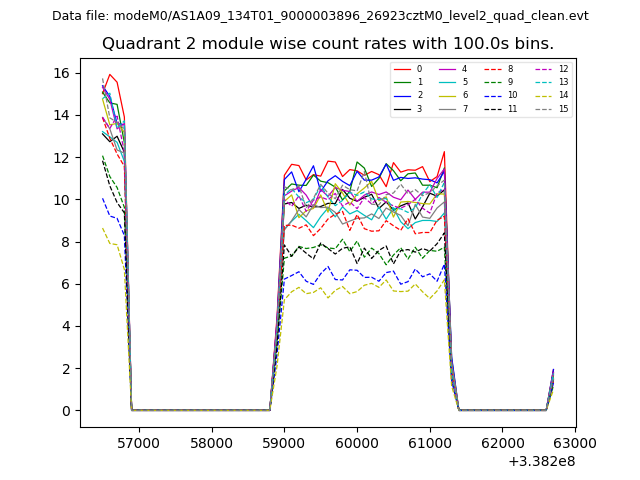
| Module-wise count rates for Quadrant B Data is divided into 100 sec bins |
 |
 |
| Module-wise count rates for Quadrant C Data is divided into 100 sec bins |
 |
 |
| Module-wise count rates for Quadrant D Data is divided into 100 sec bins |
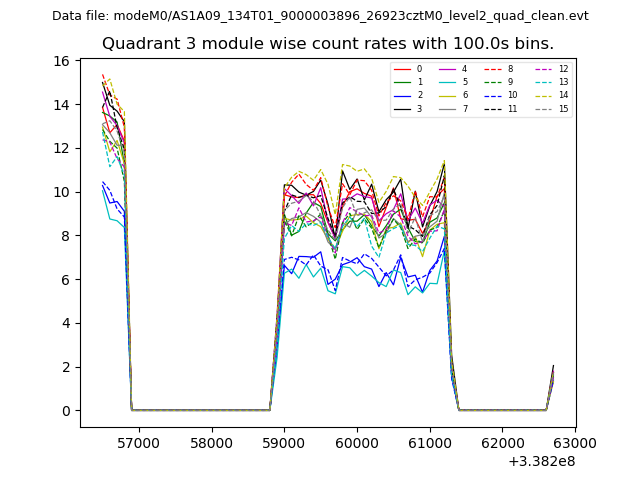 |
 |
| Parameter | Plot |
|---|---|
| CZT HV Monitor | 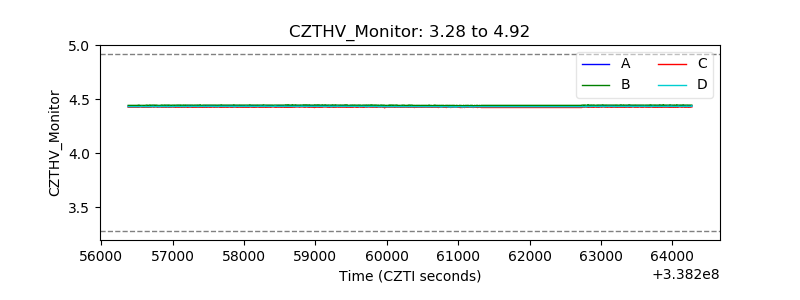 |
| D_VDD | 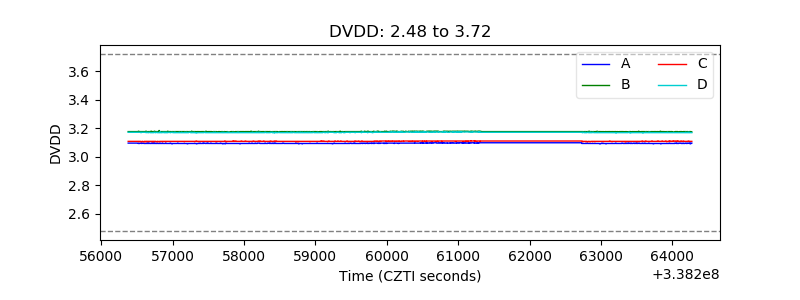 |
| Temperature 1 | 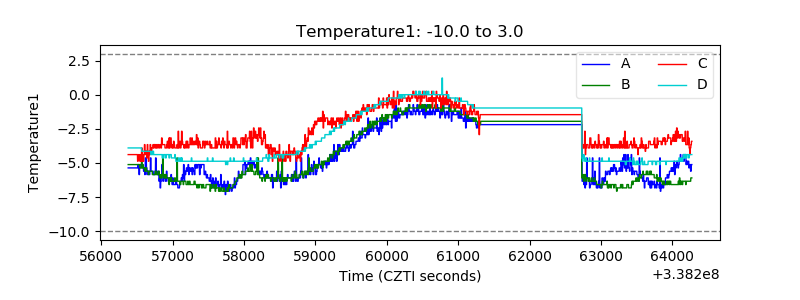 |
| Veto HV Monitor | 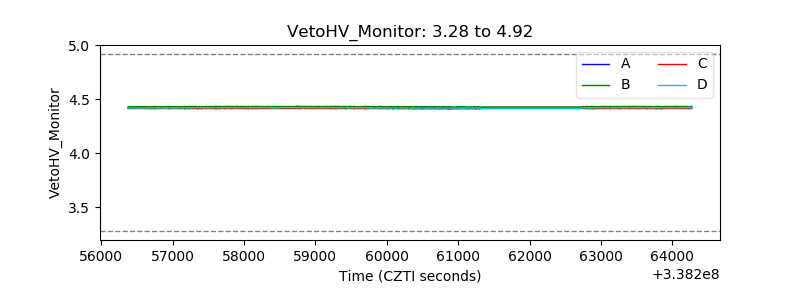 |
| Veto LLD | 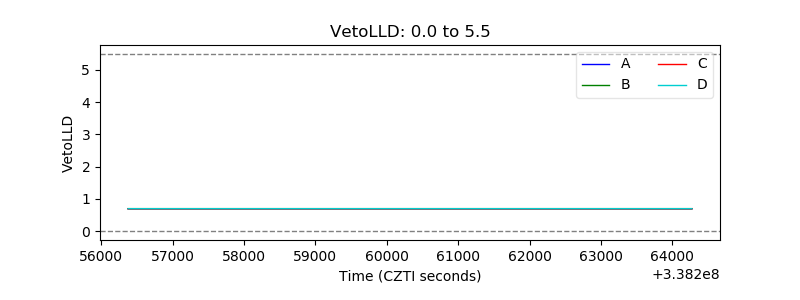 |
| Alpha Counter | 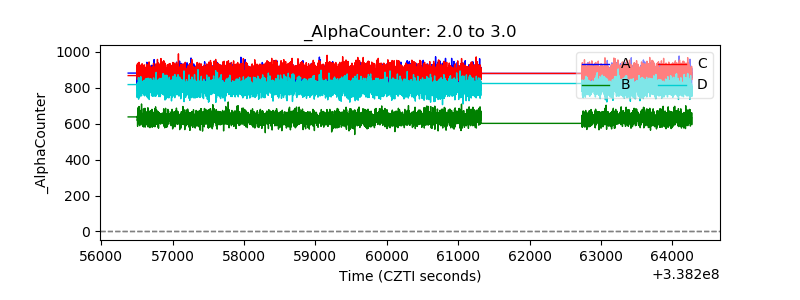 |
| _CPM_Rate | 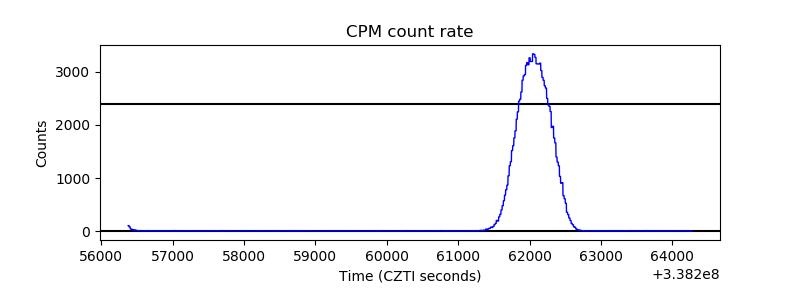 |
| CZT Counter | 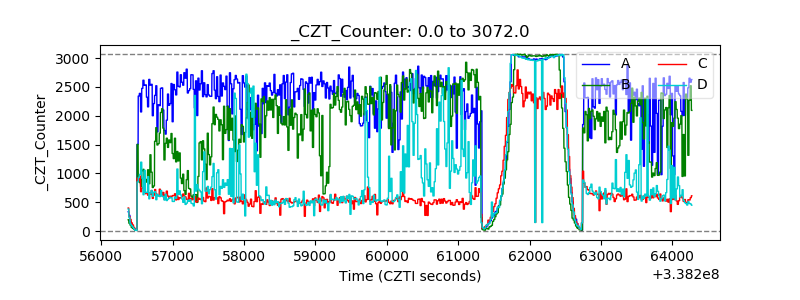 |
| +2.5 Volts monitor | 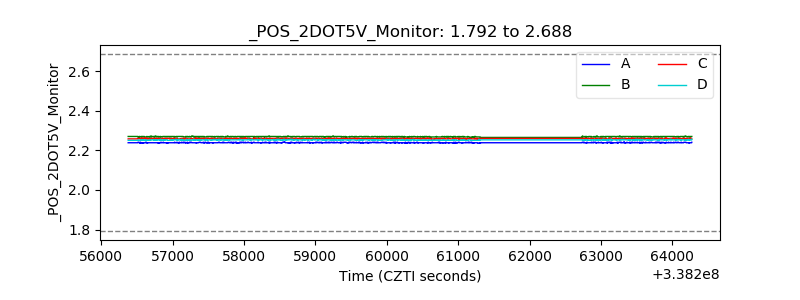 |
| +5 Volts monitor | 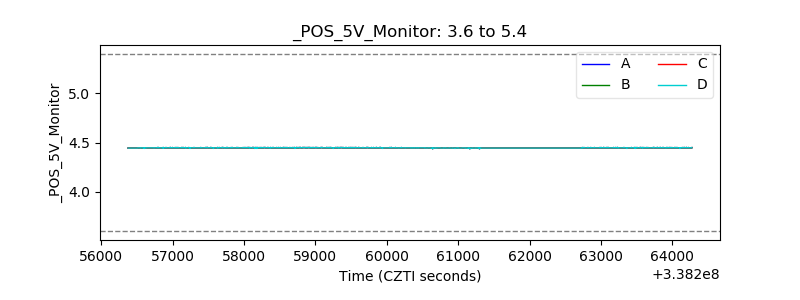 |
| _ROLL_ROT | 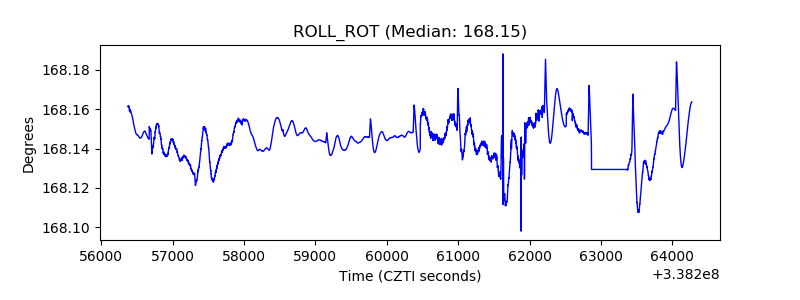 |
| _Roll_DEC | 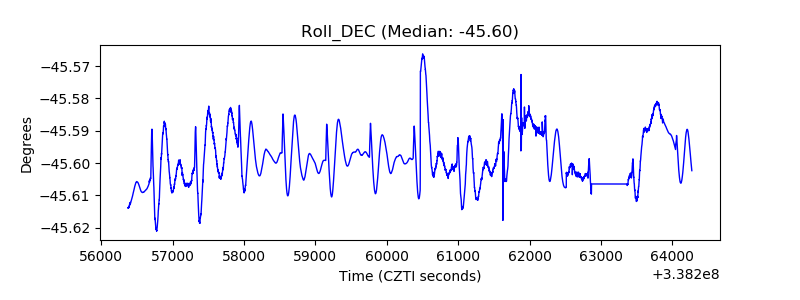 |
| _Roll_RA | 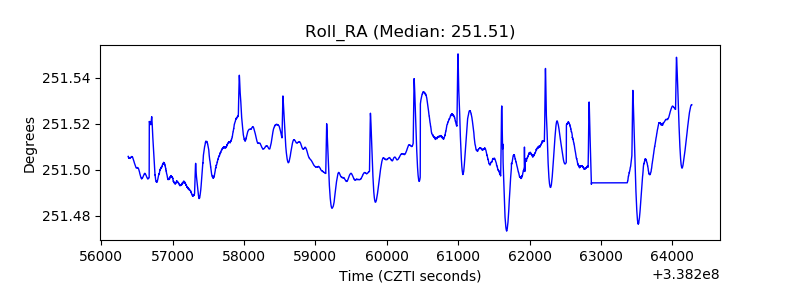 |
| Veto Counter | 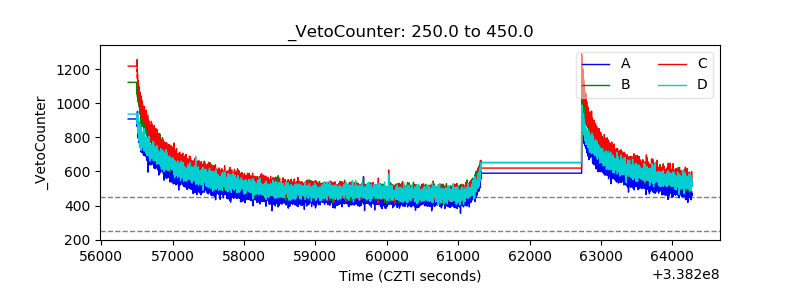 |