| Param | Original file | Final file |
|---|---|---|
| Filename | modeM0/AS1A09_134T01_9000003896_26924cztM0_level2.evt | modeM0/AS1A09_134T01_9000003896_26924cztM0_level2_quad_clean.evt |
| Size (bytes) | 1,024,902,720 | 53,176,320 |
| Size | 977.4 MB | 50.7 MB |
| Events in quadrant A | 13,087,457 | 84,131 |
| Events in quadrant B | 11,233,705 | 308,964 |
| Events in quadrant C | 3,105,464 | 413,980 |
| Events in quadrant D | 3,231,224 | 403,890 |
| Mode M9 | |||
|---|---|---|---|
| Quadrant | BADHDUFLAG | Total packets | Discarded packets |
| A | 0 | 13 | 0 |
| B | 0 | 13 | 0 |
| C | 0 | 13 | 0 |
| D | 0 | 13 | 0 |
| Mode M0 | |||
|---|---|---|---|
| Quadrant | BADHDUFLAG | Total packets | Discarded packets |
| A | 0 | 42714 | 0 |
| B | 0 | 37273 | 0 |
| C | 0 | 12318 | 0 |
| D | 0 | 12952 | 0 |
| Quadrant | Total seconds | Saturated seconds | Saturation percentage |
|---|---|---|---|
| A | 5660 | 5105 | 90.194346% |
| B | 5661 | 3988 | 70.446918% |
| C | 5661 | 86 | 1.519166% |
| D | 5661 | 44 | 0.777248% |
Noise dominated data is calculated using 1-second bins in cleaned event files. If a bin has >2000 counts, and if more than 50% of those come from <1% of pixels, then it is considered to be noise-dominated and hence unusable.
| Quadrant | # 1 sec bins | Bins with >0 counts | Bins with >2000 counts | High rate bins dominated by noise | Noise dominated (total time) | Noise dominated (detector-on time) | Marked lightcurve |
|---|---|---|---|---|---|---|---|
| A | 7064 | 5659 | 4709 | 4709 | 66.66% | 83.21% | 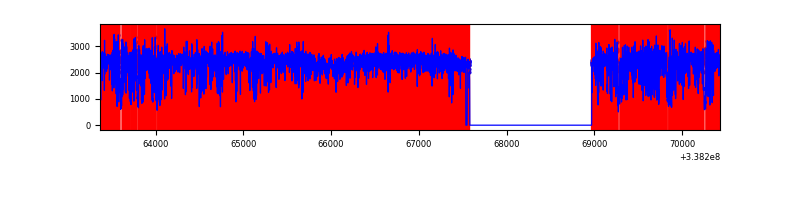 |
| B | 7066 | 5662 | 3224 | 3224 | 45.63% | 56.94% | 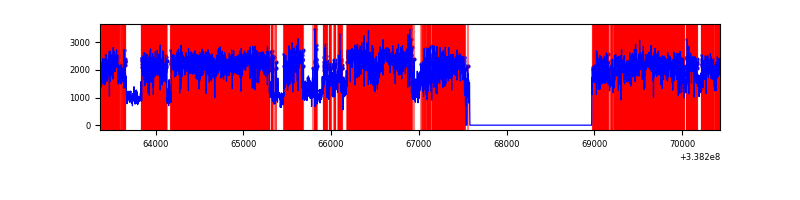 |
| C | 7066 | 5663 | 4 | 4 | 0.06% | 0.07% | 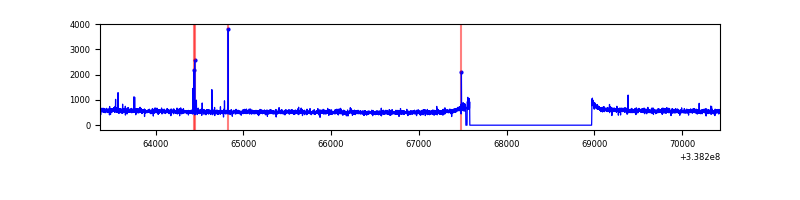 |
| D | 7066 | 5663 | 29 | 29 | 0.41% | 0.51% | 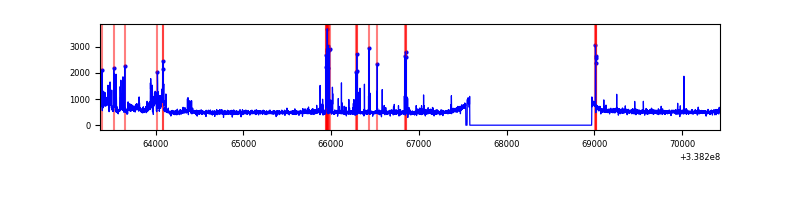 |
Top three noisy pixels from each quadrant. If the there are fewer than three noisy pixels in the level2.evt file, extra rows are filled as -1
| Pixel properties | Quadrant properties | ||||||
|---|---|---|---|---|---|---|---|
| Quadrant | DetID | PixID | Counts | Sigma | Mean | Median | Sigma |
| A | 14 | 235 | 11788238 | 185877.98 | 318 | 312 | 63.4 |
| A | 0 | 13 | 33777 | 527.69 | 318 | 312 | 63.4 |
| A | 8 | 192 | 18653 | 289.21 | 318 | 312 | 63.4 |
| B | 0 | 189 | 8465911 | 73095.49 | 631 | 617 | 115.8 |
| B | 3 | 64 | 140773 | 1210.21 | 631 | 617 | 115.8 |
| B | 15 | 33 | 56438 | 482.0 | 631 | 617 | 115.8 |
| C | 14 | 238 | 122872 | 704.54 | 756 | 763 | 173.3 |
| C | 15 | 208 | 26799 | 150.22 | 756 | 763 | 173.3 |
| C | 2 | 16 | 10692 | 57.29 | 756 | 763 | 173.3 |
| D | 7 | 80 | 203876 | 1152.21 | 754 | 741 | 176.3 |
| D | 2 | 250 | 129782 | 731.94 | 754 | 741 | 176.3 |
| D | 11 | 176 | 31655 | 175.35 | 754 | 741 | 176.3 |
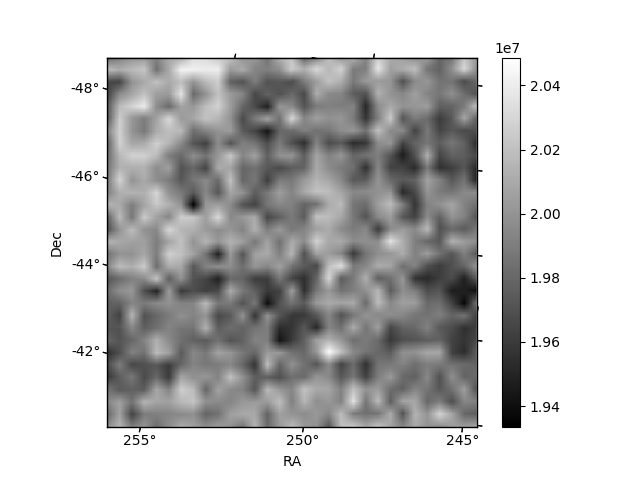
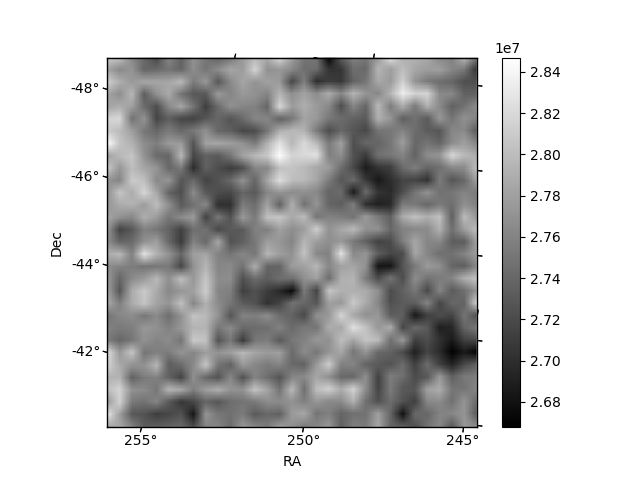
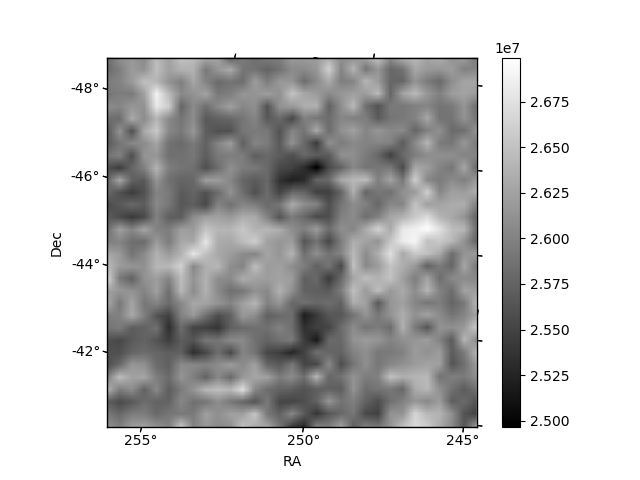
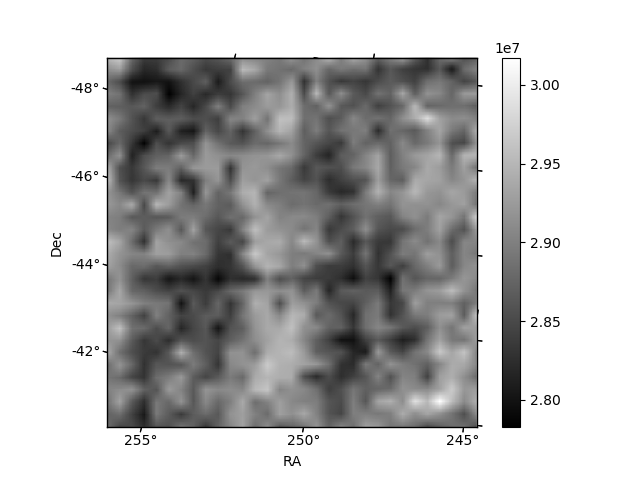
Histogram calculated using DETX and DETY for each event in the final _common_clean file
| Quadrant A | 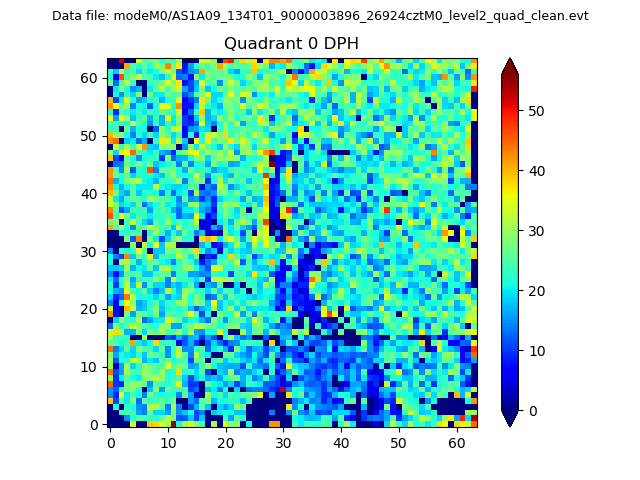 |
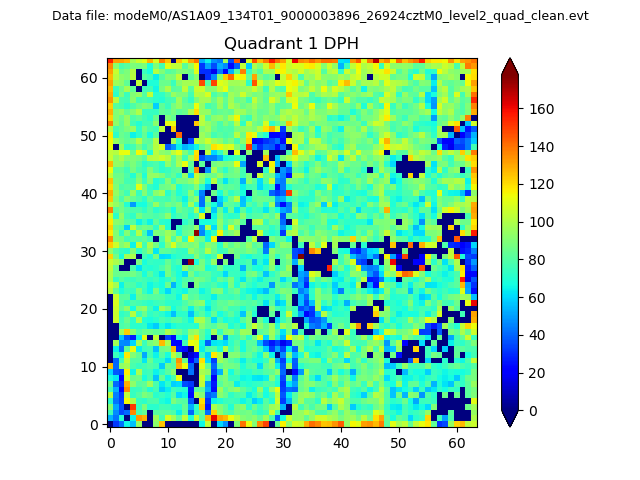 |
Quadrant B |
|---|---|---|---|
| Quadrant D | 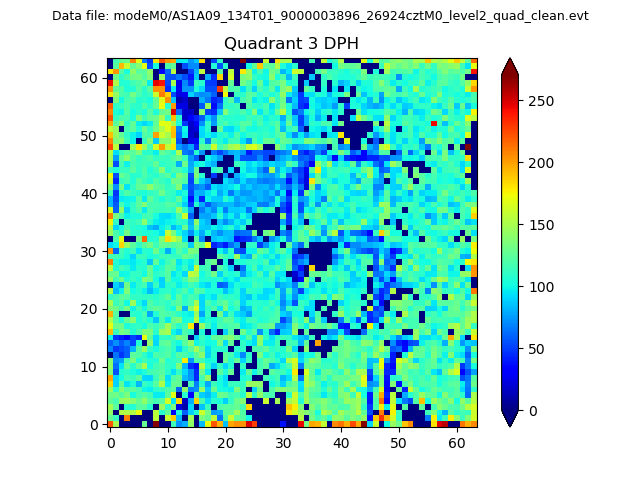 |
 |
Quadrant C |
| Plot type | Count rate plots | Images |
|---|---|---|
| Comparison with Poisson distribution Blue bars denote a histogram of data divided into 1 sec bins. Red curve is a Poisson curve with rate = median count rate of data. |
 |
 |
| Quadrant-wise count rates Data is divided into 100 sec bins |
 |
|
| Module-wise count rates for Quadrant A Data is divided into 100 sec bins |
 |
 |
| Module-wise count rates for Quadrant B Data is divided into 100 sec bins |
 |
 |
| Module-wise count rates for Quadrant C Data is divided into 100 sec bins |
 |
 |
| Module-wise count rates for Quadrant D Data is divided into 100 sec bins |
 |
 |
| Parameter | Plot |
|---|---|
| CZT HV Monitor |  |
| D_VDD | 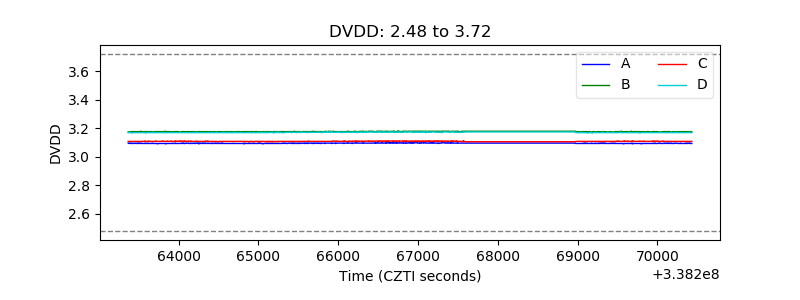 |
| Temperature 1 | 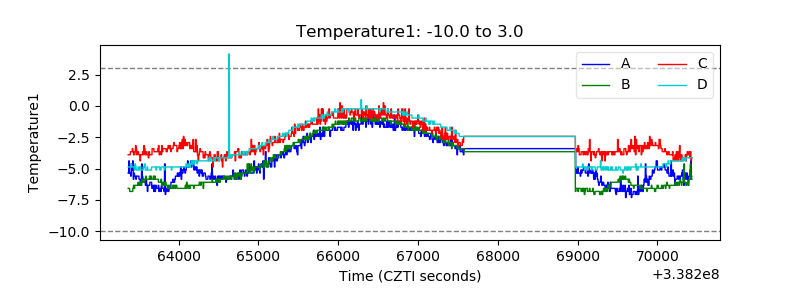 |
| Veto HV Monitor | 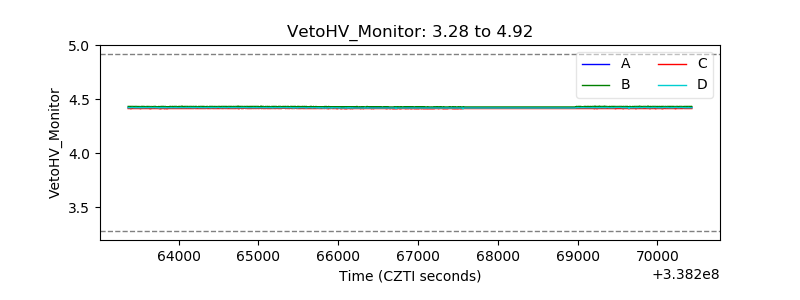 |
| Veto LLD | 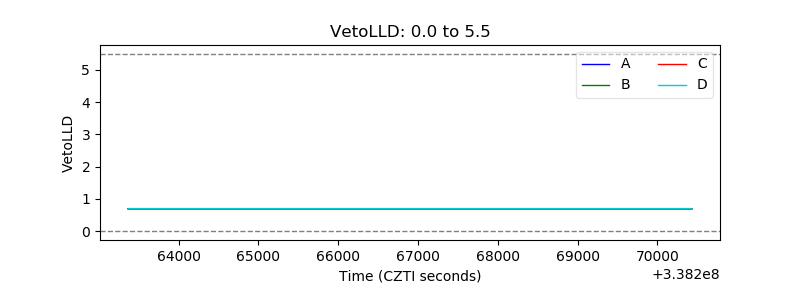 |
| Alpha Counter |  |
| _CPM_Rate |  |
| CZT Counter | 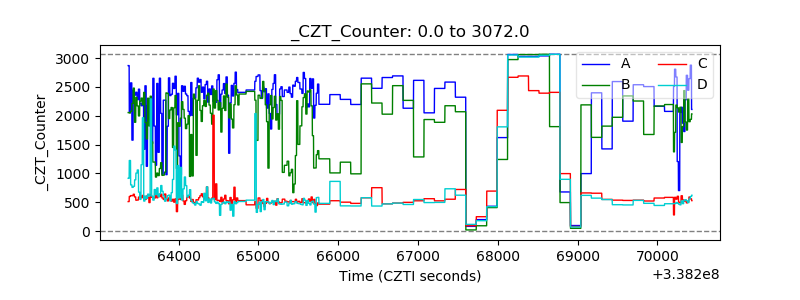 |
| +2.5 Volts monitor |  |
| +5 Volts monitor |  |
| _ROLL_ROT |  |
| _Roll_DEC | 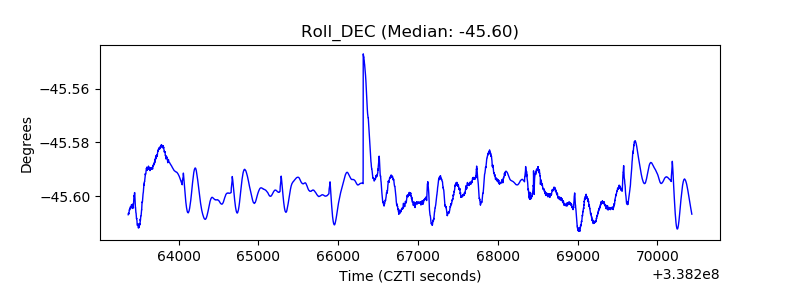 |
| _Roll_RA | 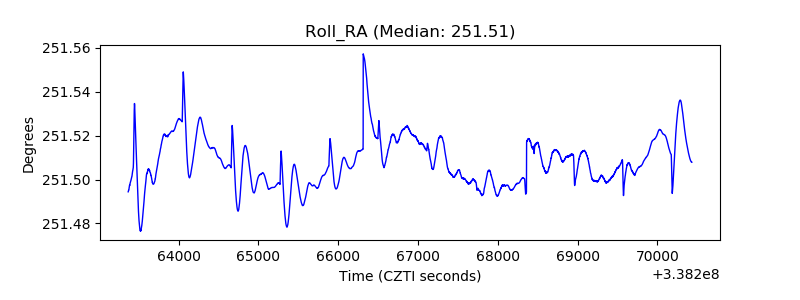 |
| Veto Counter |  |