| Param | Original file | Final file |
|---|---|---|
| Filename | modeM0/AS1A09_134T01_9000003896_26925cztM0_level2.evt | modeM0/AS1A09_134T01_9000003896_26925cztM0_level2_quad_clean.evt |
| Size (bytes) | 926,360,640 | 70,263,360 |
| Size | 883.4 MB | 67.0 MB |
| Events in quadrant A | 10,125,903 | 376,014 |
| Events in quadrant B | 9,648,815 | 382,379 |
| Events in quadrant C | 3,118,152 | 499,798 |
| Events in quadrant D | 4,765,631 | 456,200 |
| Mode M9 | |||
|---|---|---|---|
| Quadrant | BADHDUFLAG | Total packets | Discarded packets |
| A | 0 | 12 | 0 |
| B | 0 | 12 | 0 |
| C | 0 | 12 | 0 |
| D | 0 | 12 | 0 |
| Mode M0 | |||
|---|---|---|---|
| Quadrant | BADHDUFLAG | Total packets | Discarded packets |
| A | 0 | 34069 | 0 |
| B | 0 | 32511 | 0 |
| C | 0 | 12499 | 0 |
| D | 0 | 17755 | 0 |
| Quadrant | Total seconds | Saturated seconds | Saturation percentage |
|---|---|---|---|
| A | 5888 | 3257 | 55.315897% |
| B | 5888 | 3208 | 54.483696% |
| C | 5889 | 121 | 2.054678% |
| D | 5889 | 536 | 9.101715% |
Noise dominated data is calculated using 1-second bins in cleaned event files. If a bin has >2000 counts, and if more than 50% of those come from <1% of pixels, then it is considered to be noise-dominated and hence unusable.
| Quadrant | # 1 sec bins | Bins with >0 counts | Bins with >2000 counts | High rate bins dominated by noise | Noise dominated (total time) | Noise dominated (detector-on time) | Marked lightcurve |
|---|---|---|---|---|---|---|---|
| A | 7078 | 5888 | 2733 | 2733 | 38.61% | 46.42% | 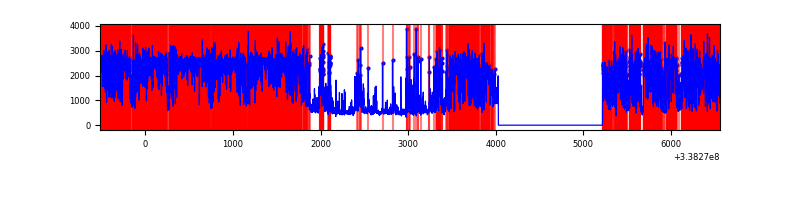 |
| B | 7078 | 5888 | 2754 | 2754 | 38.91% | 46.77% | 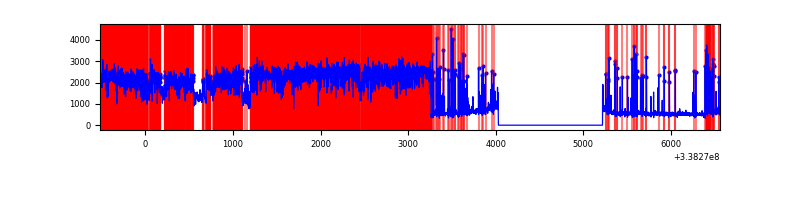 |
| C | 7079 | 5889 | 1 | 1 | 0.01% | 0.02% | 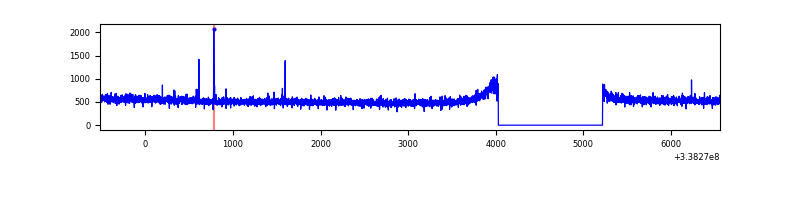 |
| D | 7079 | 5889 | 418 | 418 | 5.90% | 7.10% | 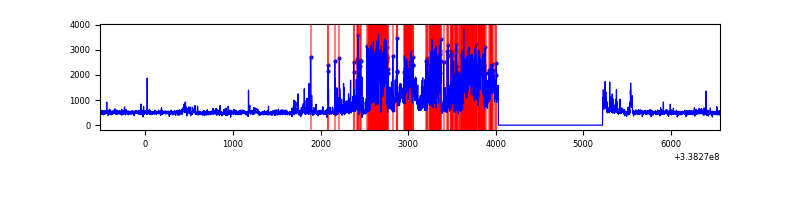 |
Top three noisy pixels from each quadrant. If the there are fewer than three noisy pixels in the level2.evt file, extra rows are filled as -1
| Pixel properties | Quadrant properties | ||||||
|---|---|---|---|---|---|---|---|
| Quadrant | DetID | PixID | Counts | Sigma | Mean | Median | Sigma |
| A | 14 | 235 | 7891226 | 71101.1 | 560 | 549 | 111.0 |
| A | 5 | 168 | 29332 | 259.36 | 560 | 549 | 111.0 |
| A | 6 | 16 | 24245 | 213.52 | 560 | 549 | 111.0 |
| B | 0 | 189 | 6734634 | 53684.73 | 670 | 655 | 125.4 |
| B | 3 | 64 | 191223 | 1519.25 | 670 | 655 | 125.4 |
| B | 10 | 245 | 57192 | 450.73 | 670 | 655 | 125.4 |
| C | 14 | 238 | 122176 | 689.7 | 763 | 769 | 176.0 |
| C | 15 | 208 | 17009 | 92.26 | 763 | 769 | 176.0 |
| C | 2 | 16 | 9574 | 50.02 | 763 | 769 | 176.0 |
| D | 7 | 80 | 1041381 | 5927.75 | 741 | 725 | 175.6 |
| D | 2 | 250 | 843599 | 4801.15 | 741 | 725 | 175.6 |
| D | 11 | 176 | 39553 | 221.17 | 741 | 725 | 175.6 |
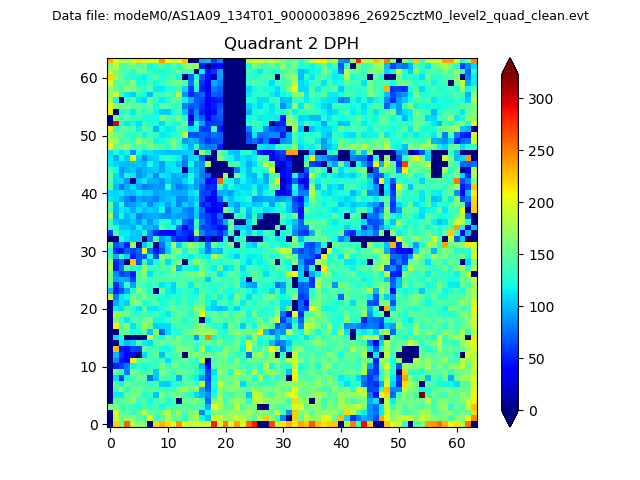
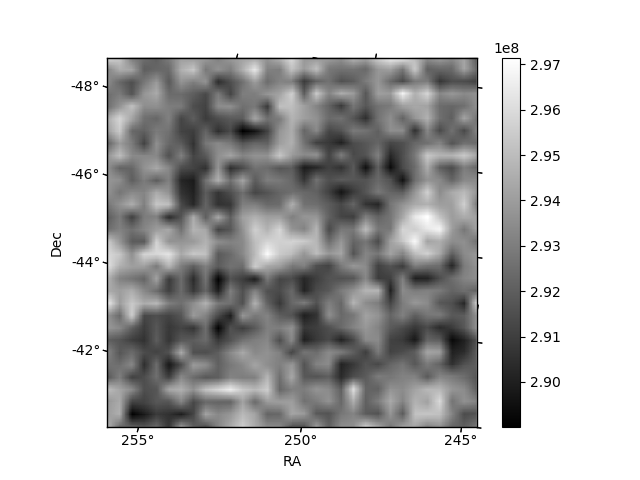
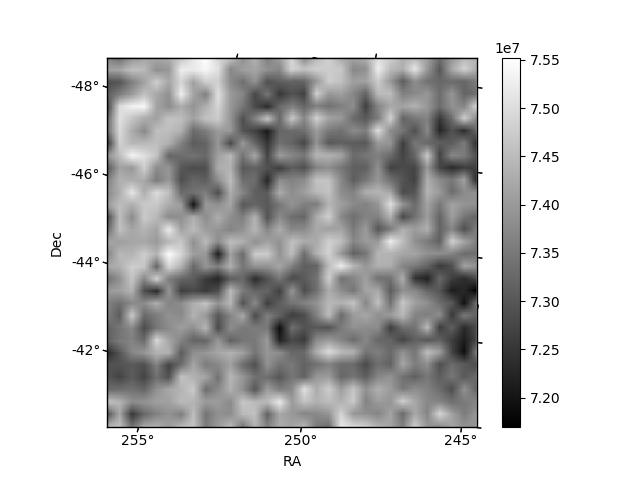
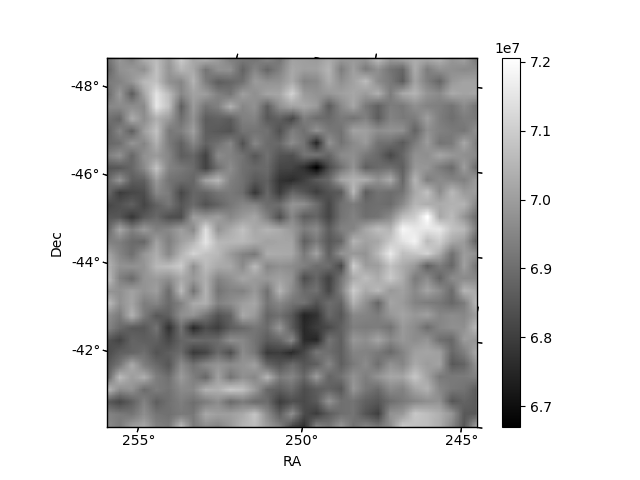
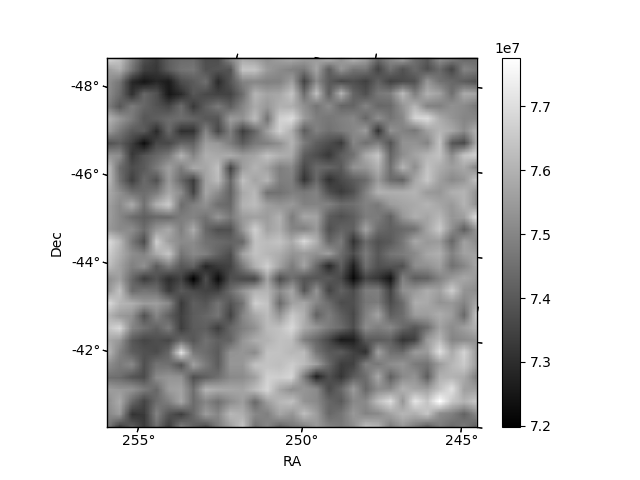
Histogram calculated using DETX and DETY for each event in the final _common_clean file
| Quadrant A | 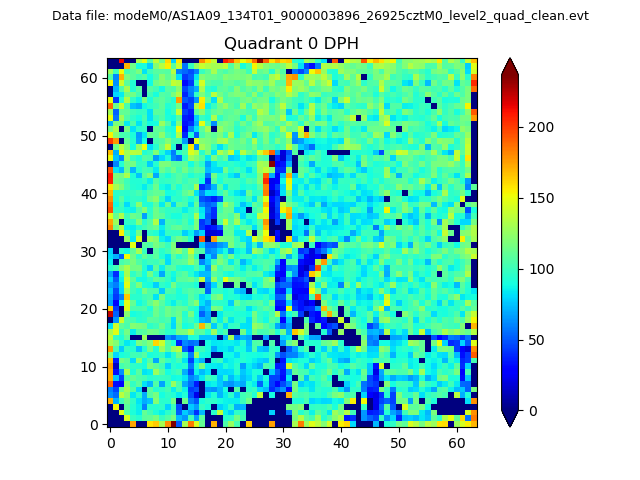 |
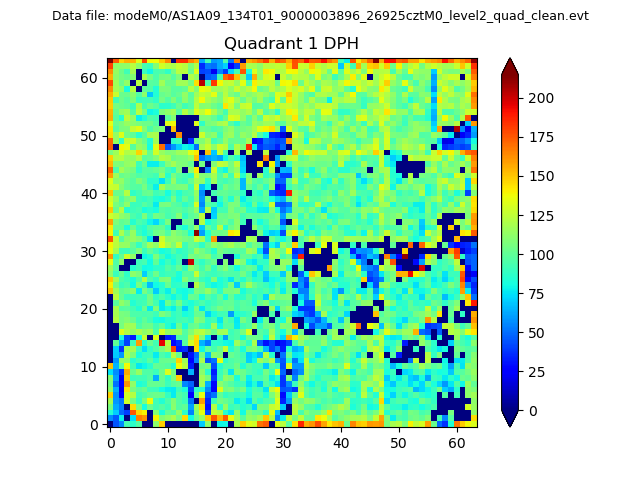 |
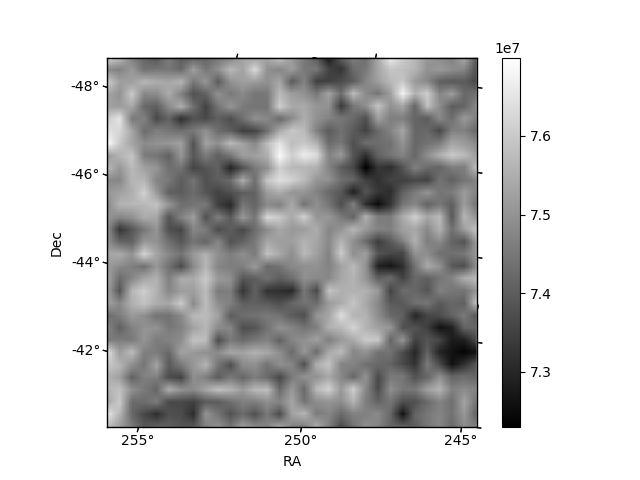
Quadrant B |
|---|---|---|---|
| Quadrant D | 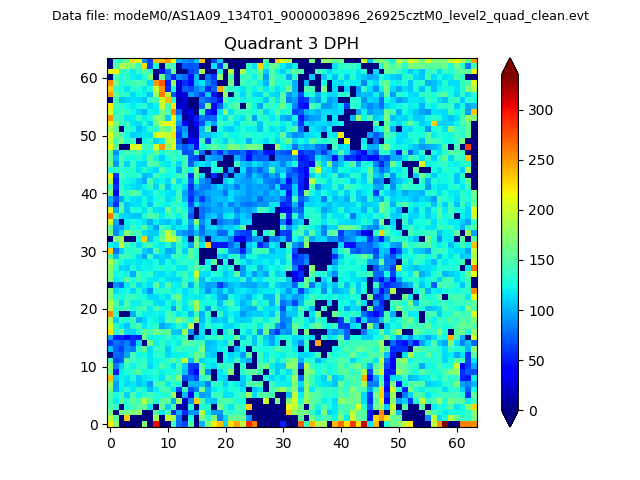 |
 |
Quadrant C |
| Plot type | Count rate plots | Images |
|---|---|---|
| Comparison with Poisson distribution Blue bars denote a histogram of data divided into 1 sec bins. Red curve is a Poisson curve with rate = median count rate of data. |
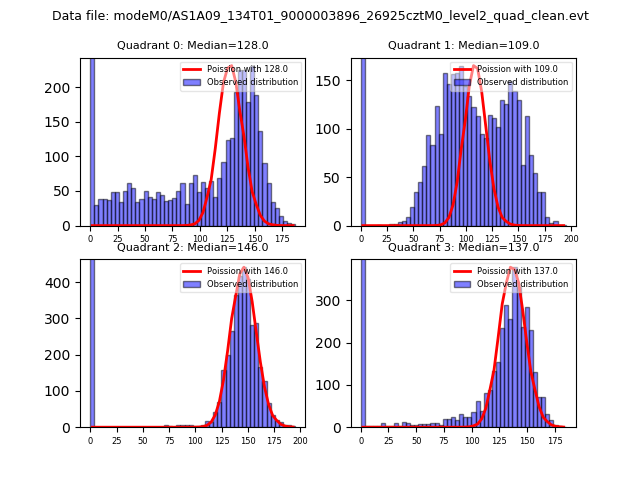 |
 |
| Quadrant-wise count rates Data is divided into 100 sec bins |
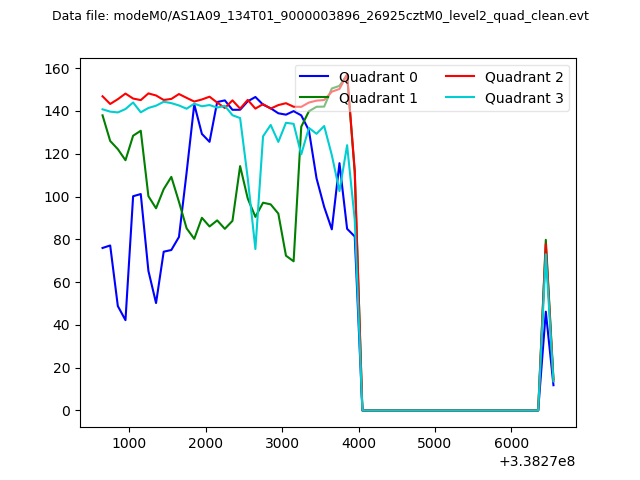 |
|
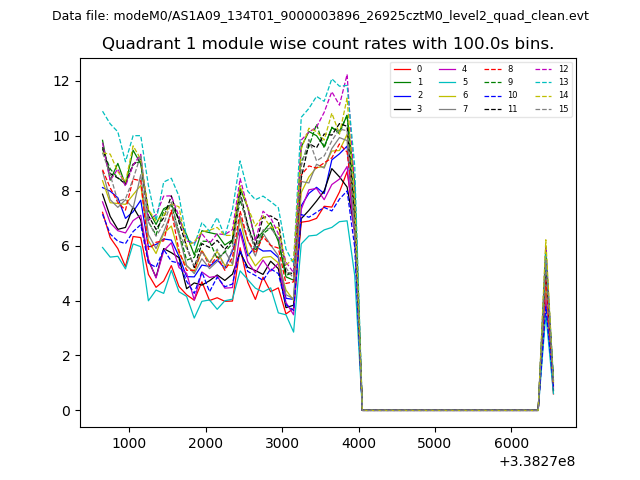
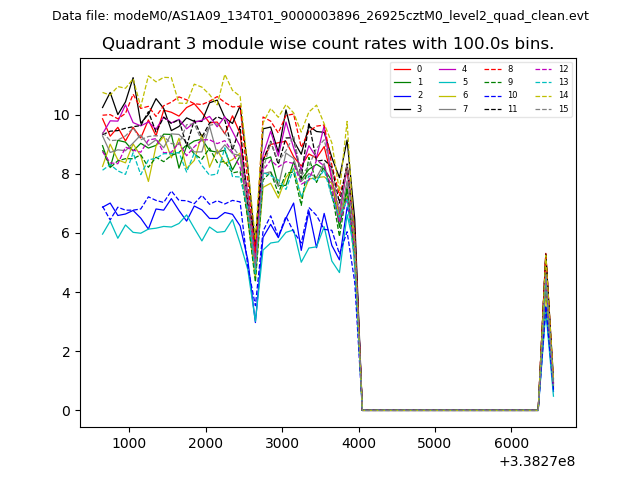
| Module-wise count rates for Quadrant A Data is divided into 100 sec bins |
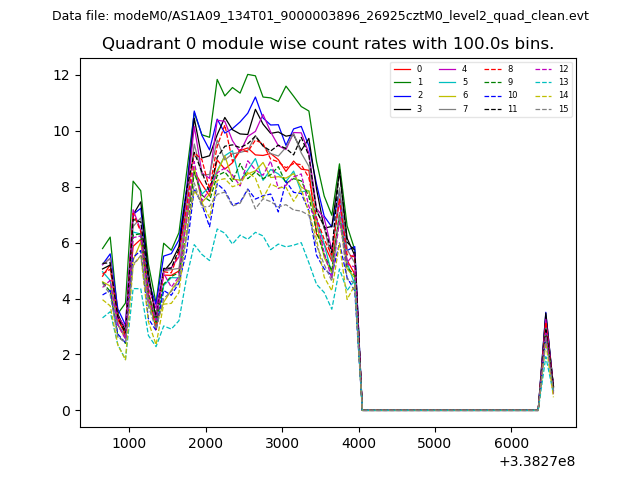 |
 |
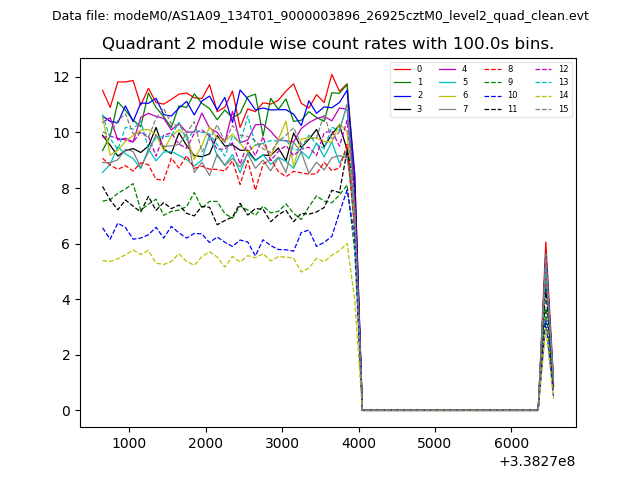
| Module-wise count rates for Quadrant B Data is divided into 100 sec bins |
 |
 |
| Module-wise count rates for Quadrant C Data is divided into 100 sec bins |
 |
 |
| Module-wise count rates for Quadrant D Data is divided into 100 sec bins |
 |
 |
| Parameter | Plot |
|---|---|
| CZT HV Monitor | 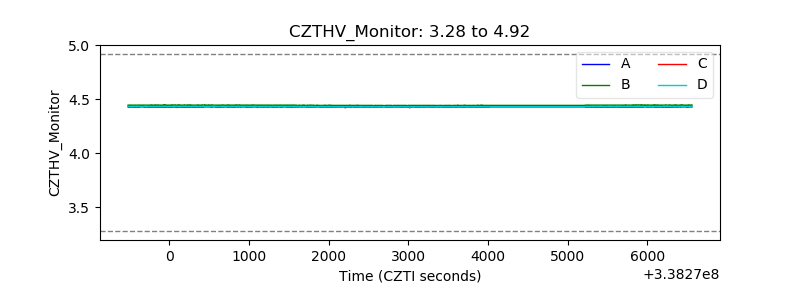 |
| D_VDD | 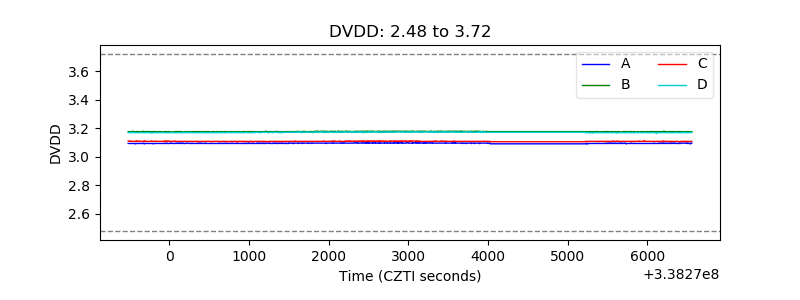 |
| Temperature 1 | 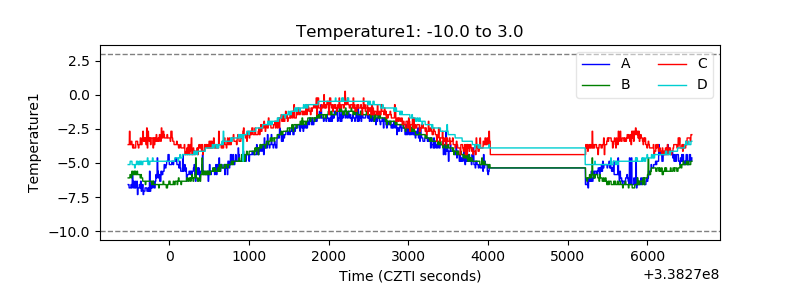 |
| Veto HV Monitor | 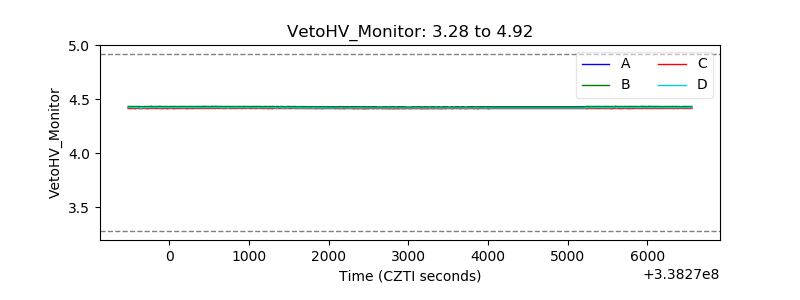 |
| Veto LLD |  |
| Alpha Counter | 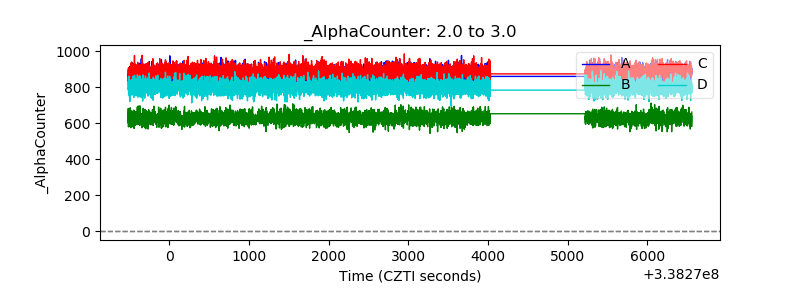 |
| _CPM_Rate | 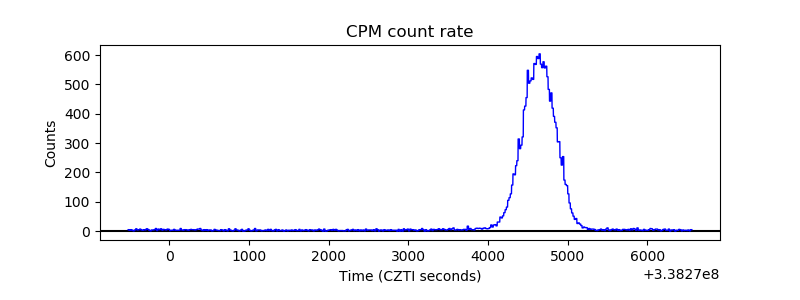 |
| CZT Counter | 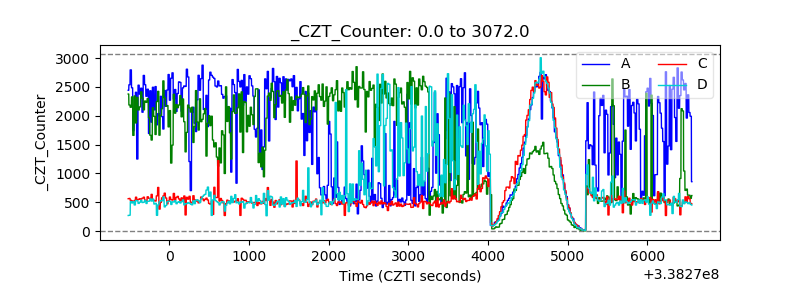 |
| +2.5 Volts monitor |  |
| +5 Volts monitor |  |
| _ROLL_ROT | 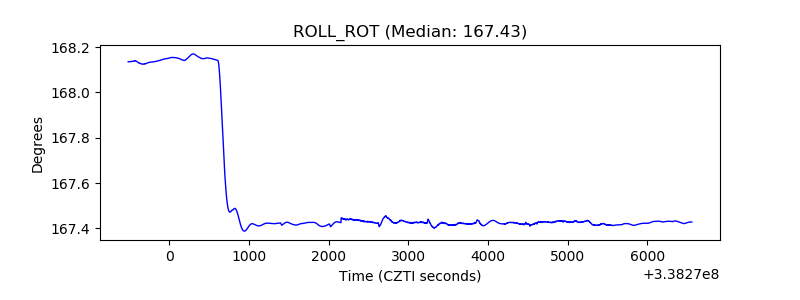 |
| _Roll_DEC | 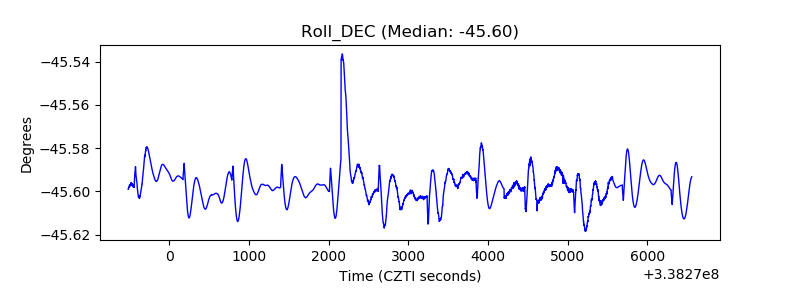 |
| _Roll_RA | 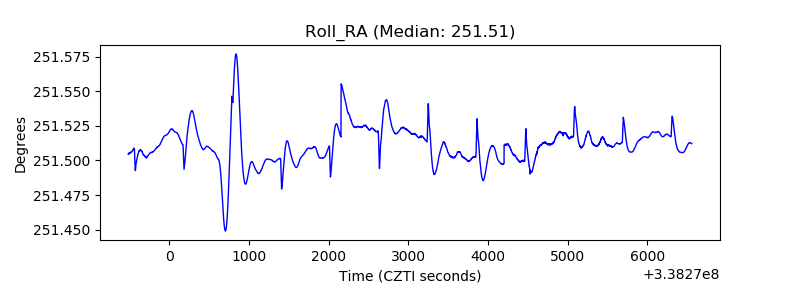 |
| Veto Counter | 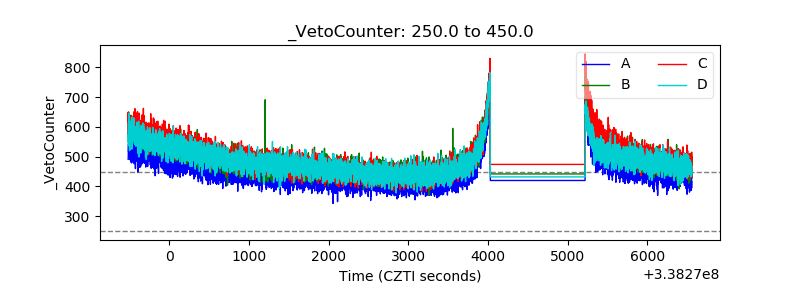 |