| Param | Original file | Final file |
|---|---|---|
| Filename | modeM0/AS1A09_134T01_9000003896_26926cztM0_level2.evt | modeM0/AS1A09_134T01_9000003896_26926cztM0_level2_quad_clean.evt |
| Size (bytes) | 977,515,200 | 79,424,640 |
| Size | 932.2 MB | 75.7 MB |
| Events in quadrant A | 14,269,543 | 255,407 |
| Events in quadrant B | 4,394,583 | 587,658 |
| Events in quadrant C | 3,490,568 | 581,296 |
| Events in quadrant D | 6,988,173 | 502,328 |
| Mode M9 | |||
|---|---|---|---|
| Quadrant | BADHDUFLAG | Total packets | Discarded packets |
| A | 0 | 14 | 0 |
| B | 0 | 15 | 0 |
| C | 0 | 15 | 0 |
| D | 0 | 15 | 0 |
| Mode M0 | |||
|---|---|---|---|
| Quadrant | BADHDUFLAG | Total packets | Discarded packets |
| A | 0 | 47027 | 0 |
| B | 0 | 17251 | 0 |
| C | 0 | 14319 | 0 |
| D | 0 | 25335 | 0 |
| Quadrant | Total seconds | Saturated seconds | Saturation percentage |
|---|---|---|---|
| A | 6837 | 5422 | 79.303788% |
| B | 6837 | 377 | 5.514114% |
| C | 6837 | 189 | 2.764370% |
| D | 6837 | 1052 | 15.386866% |
Noise dominated data is calculated using 1-second bins in cleaned event files. If a bin has >2000 counts, and if more than 50% of those come from <1% of pixels, then it is considered to be noise-dominated and hence unusable.
| Quadrant | # 1 sec bins | Bins with >0 counts | Bins with >2000 counts | High rate bins dominated by noise | Noise dominated (total time) | Noise dominated (detector-on time) | Marked lightcurve |
|---|---|---|---|---|---|---|---|
| A | 7602 | 6837 | 4560 | 4560 | 59.98% | 66.70% | 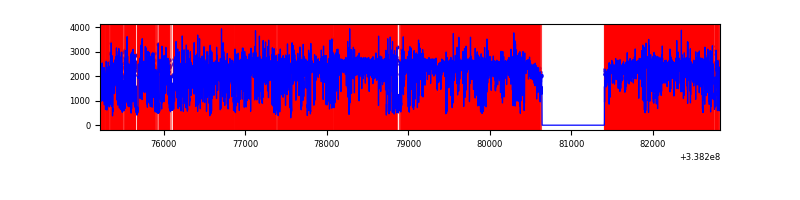 |
| B | 7602 | 6837 | 171 | 171 | 2.25% | 2.50% | 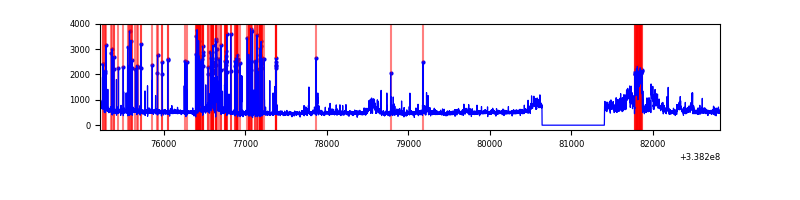 |
| C | 7602 | 6837 | 0 | 0 | 0.00% | 0.00% | 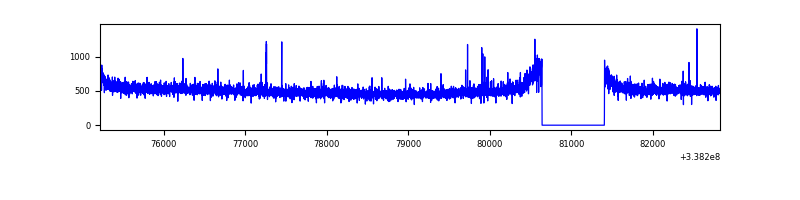 |
| D | 7602 | 6837 | 935 | 935 | 12.30% | 13.68% | 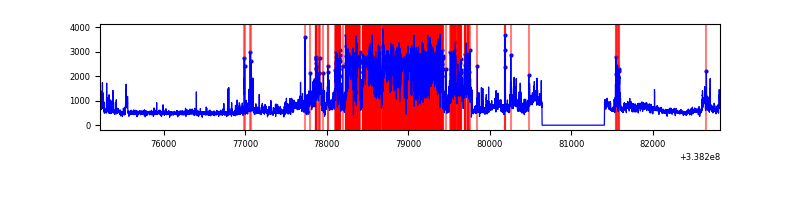 |
Top three noisy pixels from each quadrant. If the there are fewer than three noisy pixels in the level2.evt file, extra rows are filled as -1
| Pixel properties | Quadrant properties | ||||||
|---|---|---|---|---|---|---|---|
| Quadrant | DetID | PixID | Counts | Sigma | Mean | Median | Sigma |
| A | 14 | 235 | 12460861 | 141433.0 | 443 | 436 | 88.1 |
| A | 6 | 16 | 57860 | 651.8 | 443 | 436 | 88.1 |
| A | 8 | 192 | 29021 | 324.46 | 443 | 436 | 88.1 |
| B | 0 | 189 | 642530 | 3906.44 | 864 | 842 | 164.3 |
| B | 3 | 64 | 208120 | 1261.86 | 864 | 842 | 164.3 |
| B | 15 | 33 | 67389 | 405.12 | 864 | 842 | 164.3 |
| C | 14 | 238 | 135875 | 685.09 | 851 | 856 | 197.1 |
| C | 15 | 208 | 20875 | 101.58 | 851 | 856 | 197.1 |
| C | 15 | 127 | 12607 | 59.62 | 851 | 856 | 197.1 |
| D | 7 | 80 | 2177676 | 11252.97 | 809 | 790 | 193.4 |
| D | 2 | 250 | 1144187 | 5910.56 | 809 | 790 | 193.4 |
| D | 15 | 36 | 539441 | 2784.45 | 809 | 790 | 193.4 |
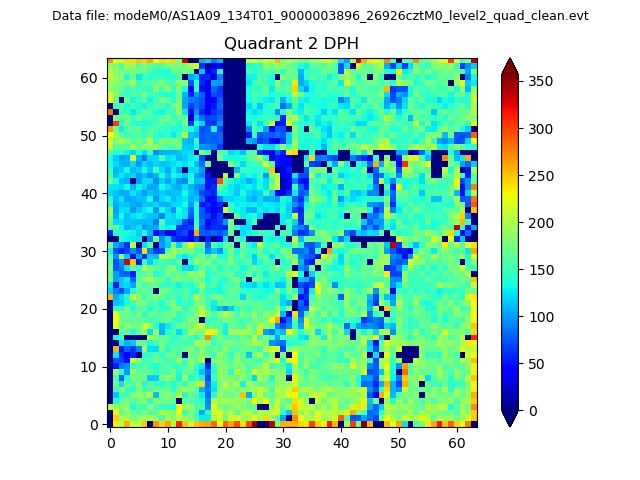
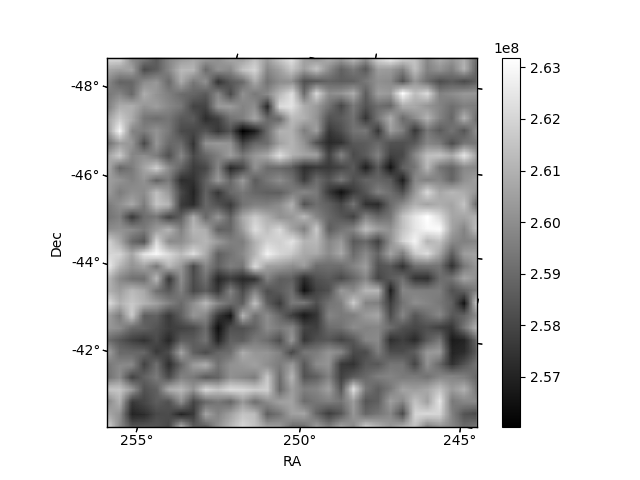
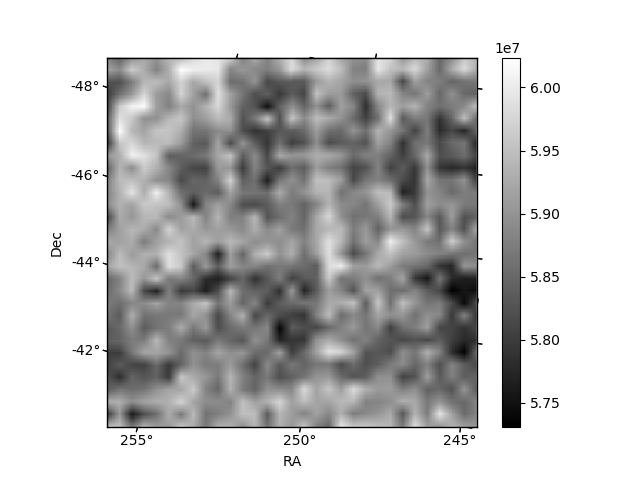
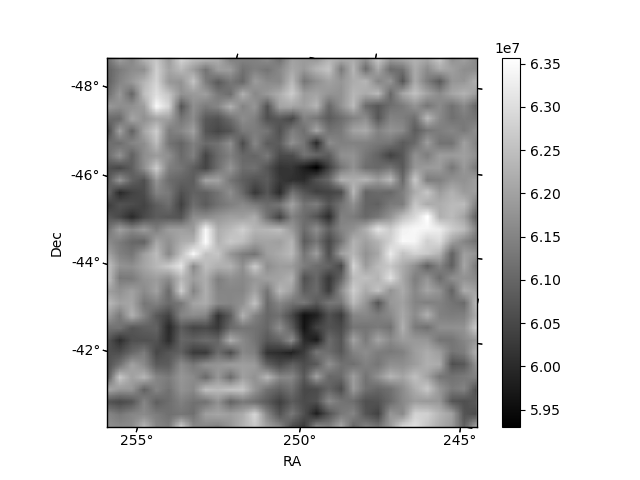
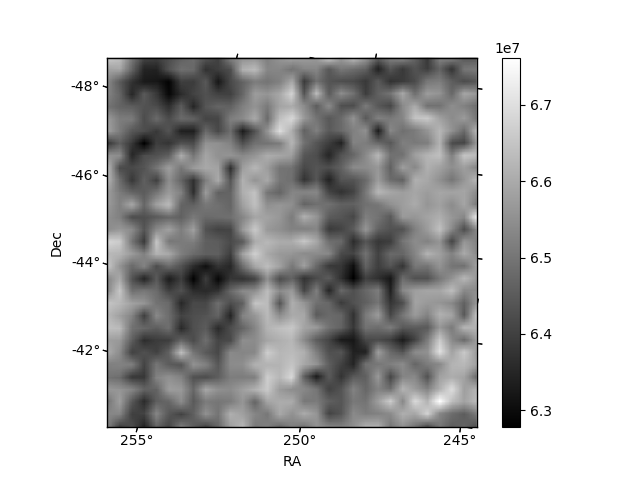
Histogram calculated using DETX and DETY for each event in the final _common_clean file
| Quadrant A | 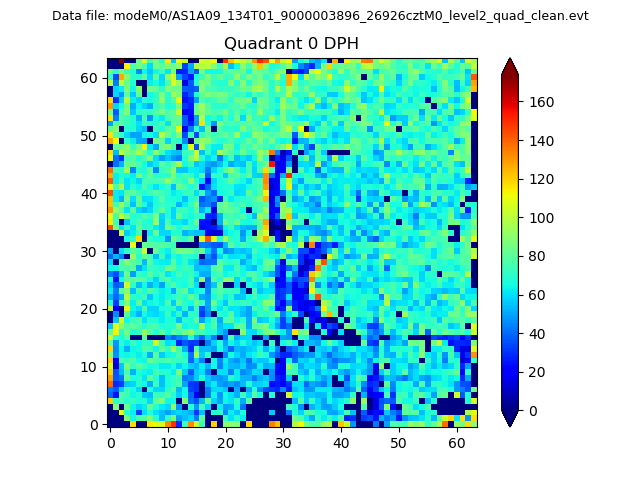 |
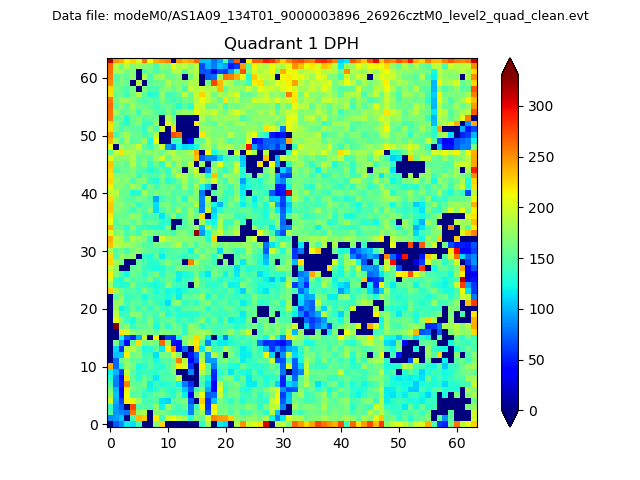 |
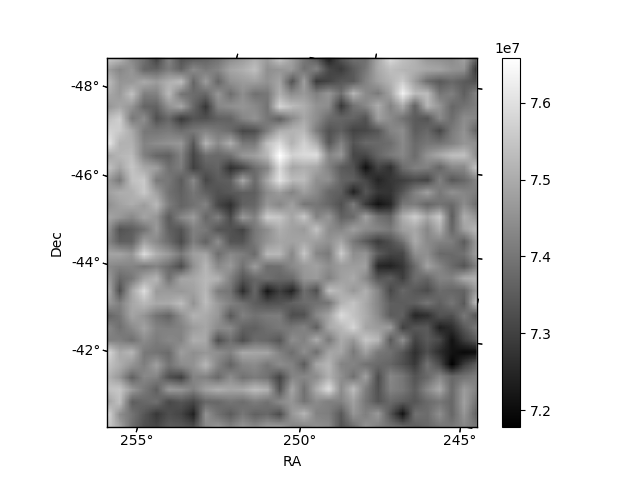
Quadrant B |
|---|---|---|---|
| Quadrant D | 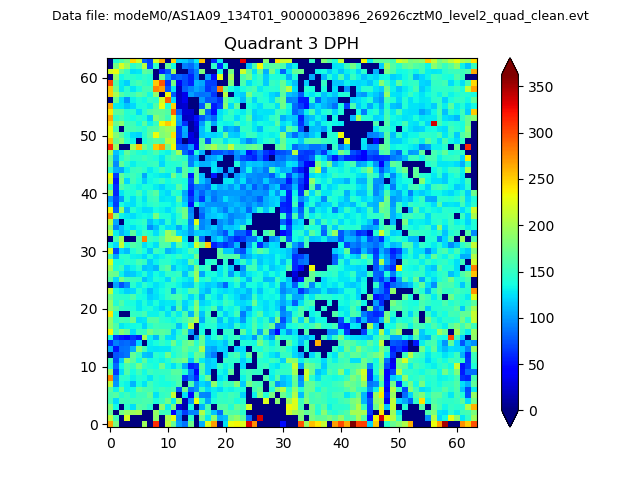 |
 |
Quadrant C |
| Plot type | Count rate plots | Images |
|---|---|---|
| Comparison with Poisson distribution Blue bars denote a histogram of data divided into 1 sec bins. Red curve is a Poisson curve with rate = median count rate of data. |
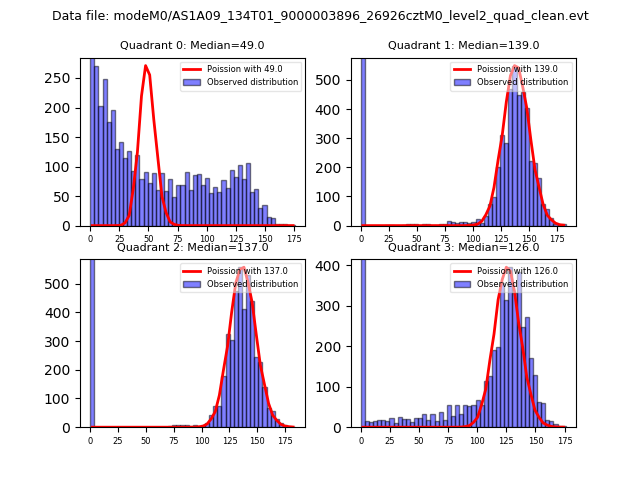 |
 |
| Quadrant-wise count rates Data is divided into 100 sec bins |
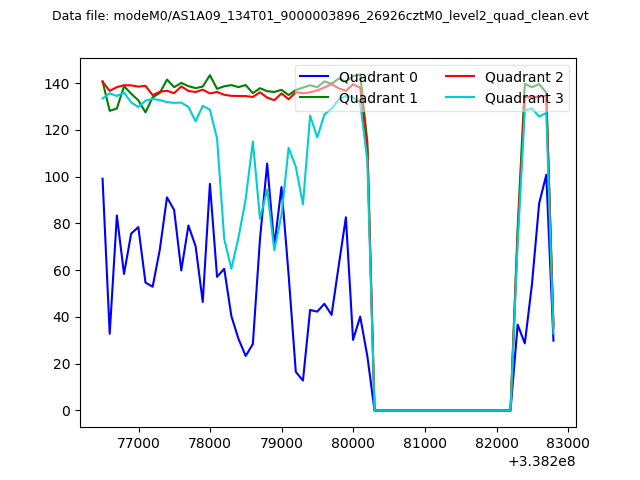 |
|
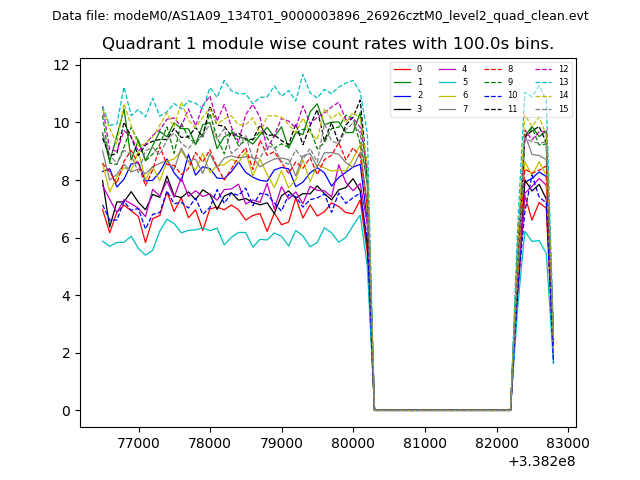
| Module-wise count rates for Quadrant A Data is divided into 100 sec bins |
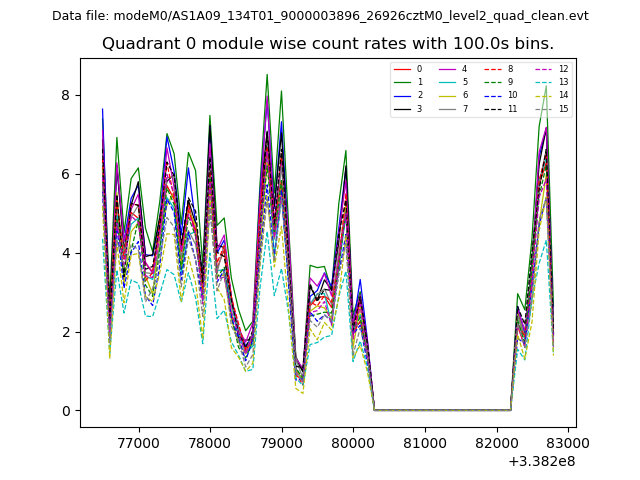 |
 |
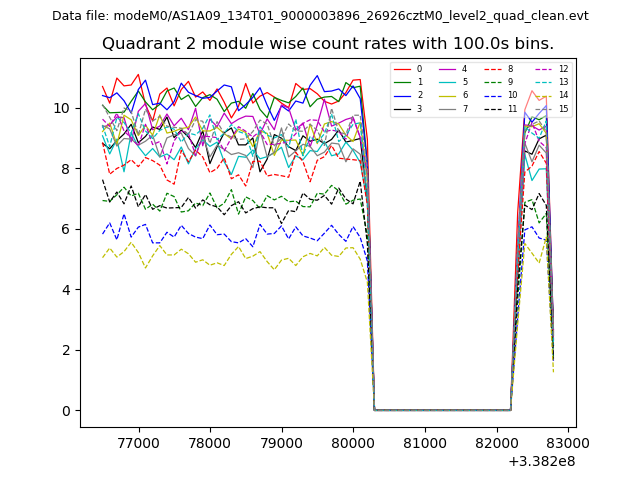
| Module-wise count rates for Quadrant B Data is divided into 100 sec bins |
 |
 |
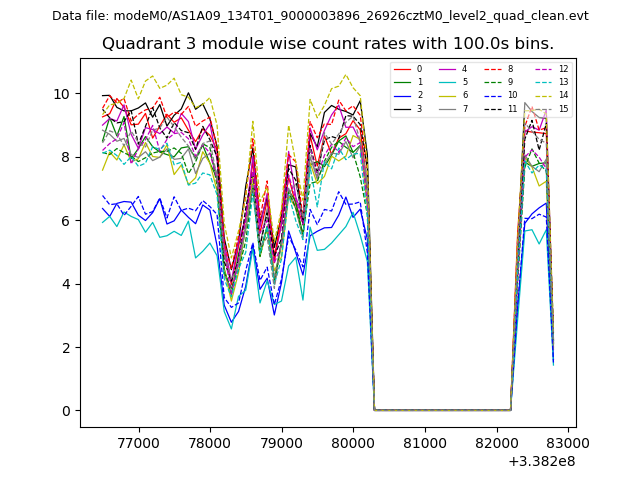
| Module-wise count rates for Quadrant C Data is divided into 100 sec bins |
 |
 |
| Module-wise count rates for Quadrant D Data is divided into 100 sec bins |
 |
 |
| Parameter | Plot |
|---|---|
| CZT HV Monitor | 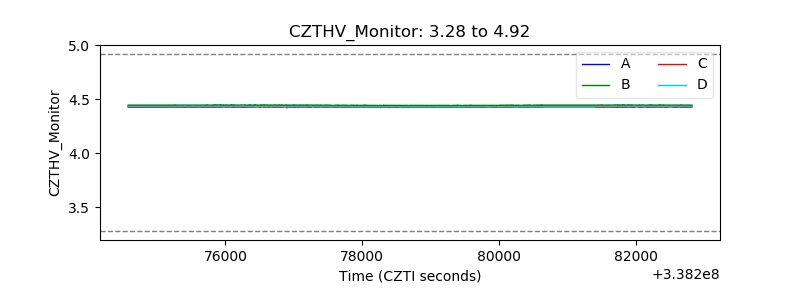 |
| D_VDD | 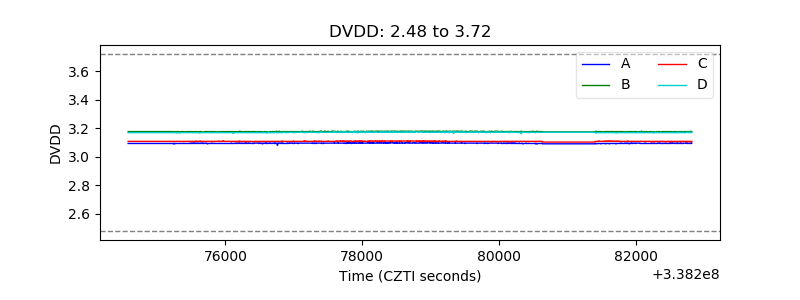 |
| Temperature 1 | 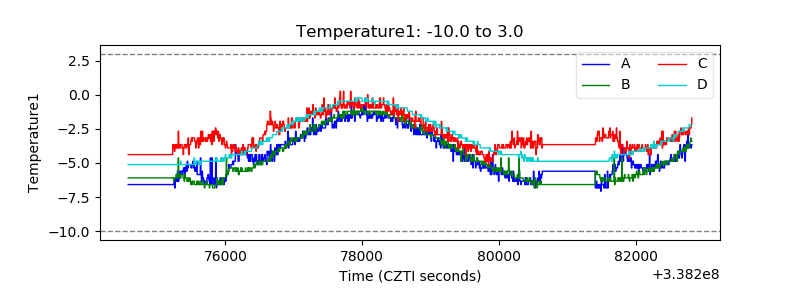 |
| Veto HV Monitor | 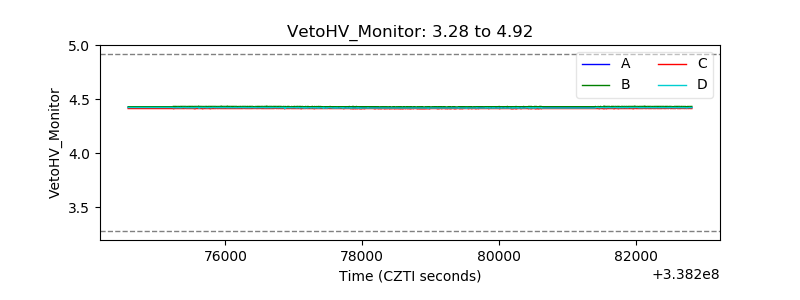 |
| Veto LLD | 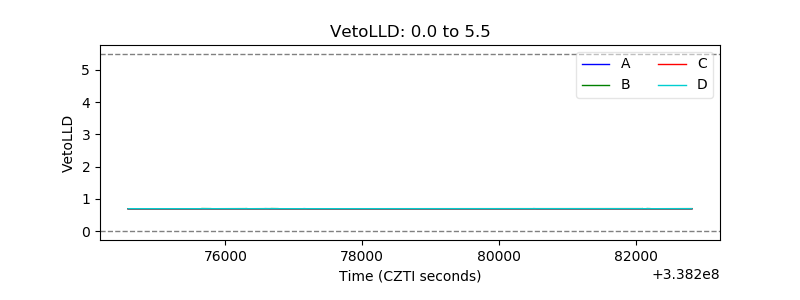 |
| Alpha Counter | 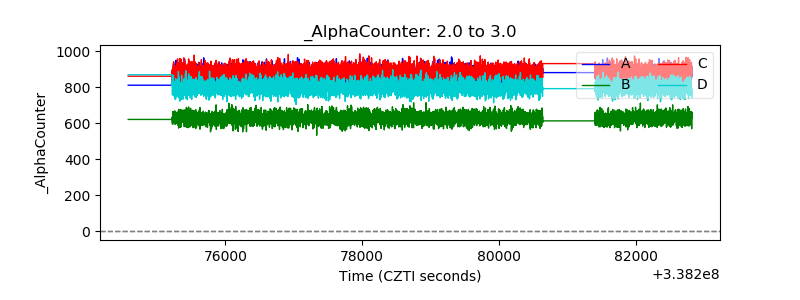 |
| _CPM_Rate | 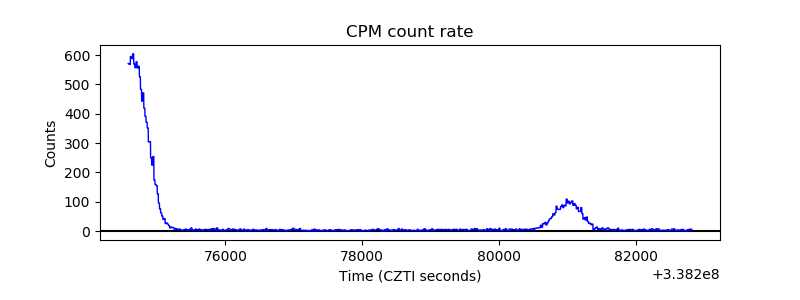 |
| CZT Counter | 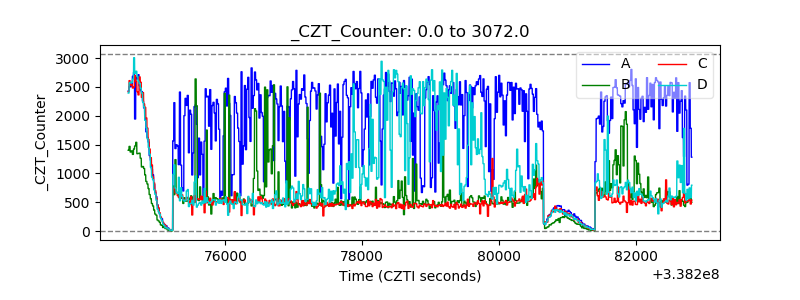 |
| +2.5 Volts monitor |  |
| +5 Volts monitor |  |
| _ROLL_ROT | 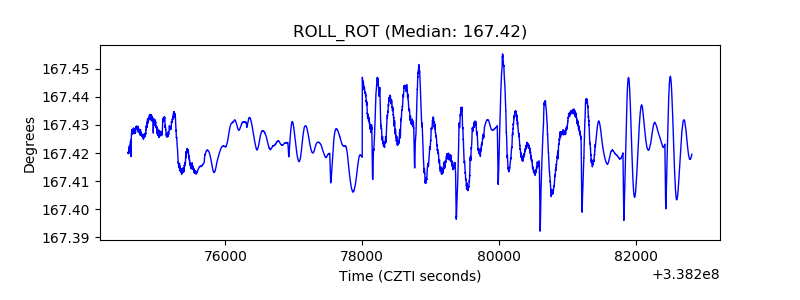 |
| _Roll_DEC | 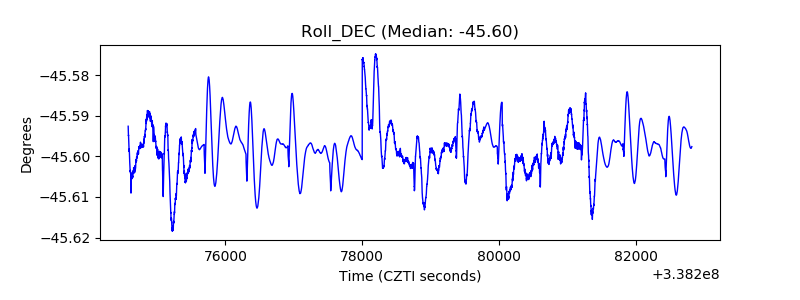 |
| _Roll_RA | 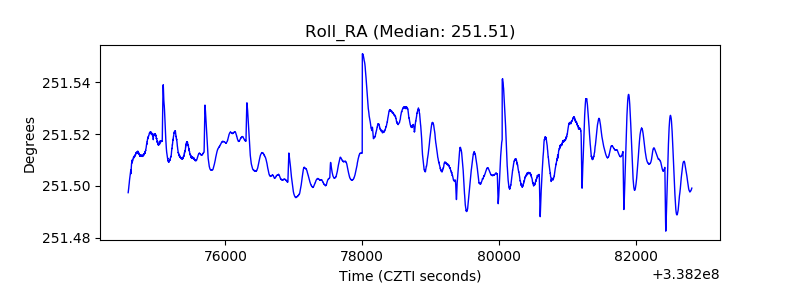 |
| Veto Counter |  |