| Param | Original file | Final file |
|---|---|---|
| Filename | modeM0/AS1A09_134T01_9000003896_26927cztM0_level2.evt | modeM0/AS1A09_134T01_9000003896_26927cztM0_level2_quad_clean.evt |
| Size (bytes) | 1,139,829,120 | 86,840,640 |
| Size | 1.1 GB | 82.8 MB |
| Events in quadrant A | 15,644,725 | 328,355 |
| Events in quadrant B | 4,462,790 | 628,593 |
| Events in quadrant C | 3,752,644 | 620,139 |
| Events in quadrant D | 10,159,152 | 532,826 |
| Mode M9 | |||
|---|---|---|---|
| Quadrant | BADHDUFLAG | Total packets | Discarded packets |
| A | 0 | 5 | 0 |
| B | 0 | 6 | 0 |
| C | 0 | 6 | 0 |
| D | 0 | 6 | 0 |
| Mode M0 | |||
|---|---|---|---|
| Quadrant | BADHDUFLAG | Total packets | Discarded packets |
| A | 0 | 51479 | 0 |
| B | 0 | 17852 | 0 |
| C | 0 | 15676 | 0 |
| D | 0 | 35485 | 0 |
| Quadrant | Total seconds | Saturated seconds | Saturation percentage |
|---|---|---|---|
| A | 7445 | 5973 | 80.228341% |
| B | 7445 | 396 | 5.319006% |
| C | 7445 | 268 | 3.599731% |
| D | 7445 | 1656 | 22.243116% |
Noise dominated data is calculated using 1-second bins in cleaned event files. If a bin has >2000 counts, and if more than 50% of those come from <1% of pixels, then it is considered to be noise-dominated and hence unusable.
| Quadrant | # 1 sec bins | Bins with >0 counts | Bins with >2000 counts | High rate bins dominated by noise | Noise dominated (total time) | Noise dominated (detector-on time) | Marked lightcurve |
|---|---|---|---|---|---|---|---|
| A | 7759 | 7444 | 5057 | 5057 | 65.18% | 67.93% | 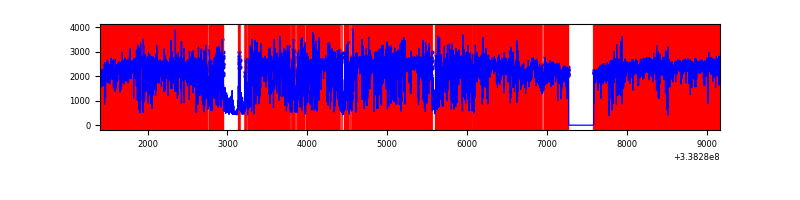 |
| B | 7760 | 7445 | 152 | 152 | 1.96% | 2.04% | 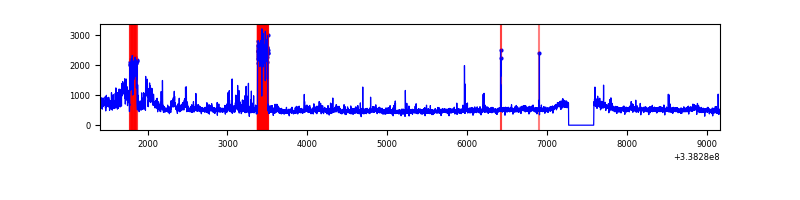 |
| C | 7760 | 7446 | 8 | 8 | 0.10% | 0.11% | 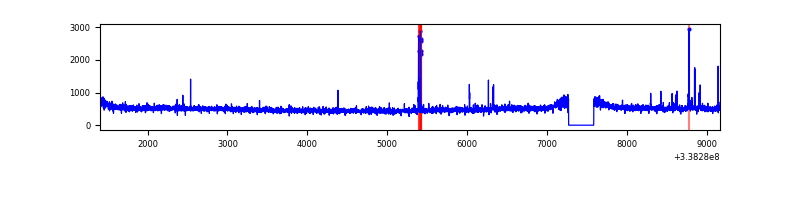 |
| D | 7760 | 7445 | 1609 | 1609 | 20.73% | 21.61% | 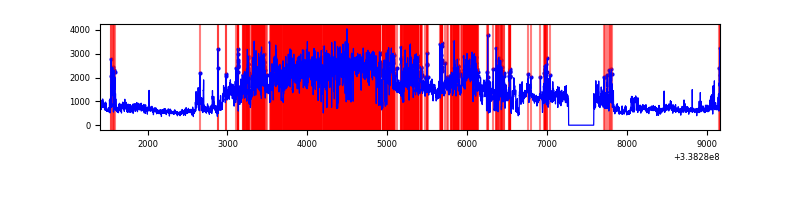 |
Top three noisy pixels from each quadrant. If the there are fewer than three noisy pixels in the level2.evt file, extra rows are filled as -1
| Pixel properties | Quadrant properties | ||||||
|---|---|---|---|---|---|---|---|
| Quadrant | DetID | PixID | Counts | Sigma | Mean | Median | Sigma |
| A | 14 | 235 | 13936864 | 159133.37 | 431 | 423 | 87.6 |
| A | 8 | 192 | 28323 | 318.58 | 431 | 423 | 87.6 |
| A | 5 | 168 | 12623 | 139.31 | 431 | 423 | 87.6 |
| B | 0 | 189 | 660954 | 3725.56 | 925 | 901 | 177.2 |
| B | 10 | 245 | 45449 | 251.44 | 925 | 901 | 177.2 |
| B | 0 | 219 | 44610 | 246.71 | 925 | 901 | 177.2 |
| C | 14 | 238 | 147753 | 698.11 | 904 | 911 | 210.3 |
| C | 15 | 208 | 73379 | 344.52 | 904 | 911 | 210.3 |
| C | 13 | 61 | 6204 | 25.16 | 904 | 911 | 210.3 |
| D | 7 | 80 | 6330413 | 30821.89 | 862 | 842 | 205.4 |
| D | 2 | 250 | 505442 | 2457.15 | 862 | 842 | 205.4 |
| D | 2 | 234 | 34347 | 163.15 | 862 | 842 | 205.4 |
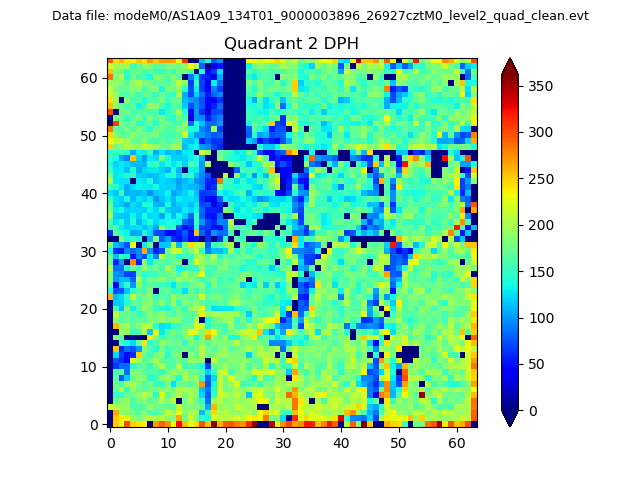
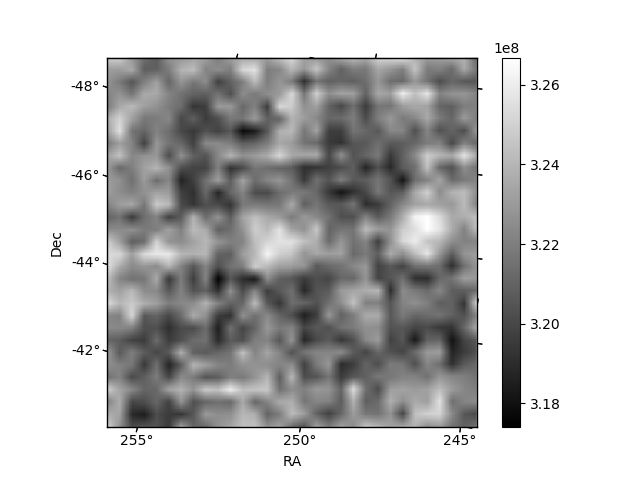
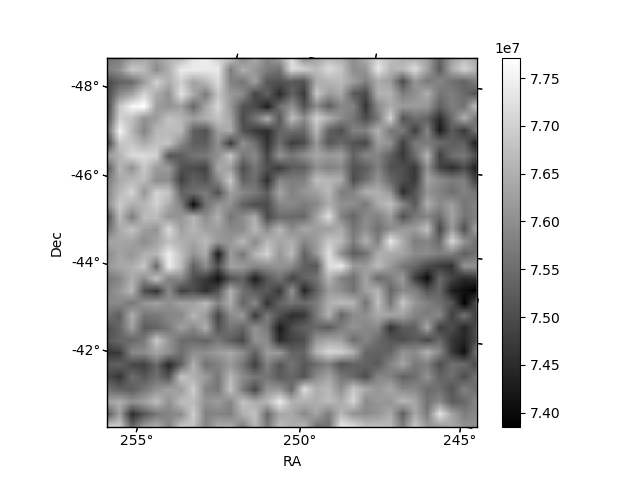
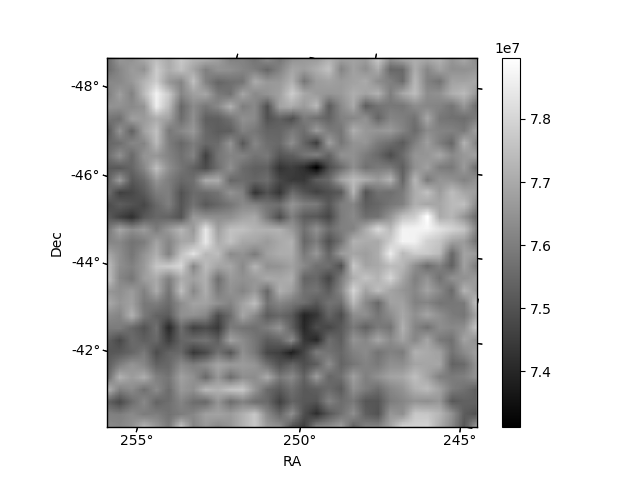
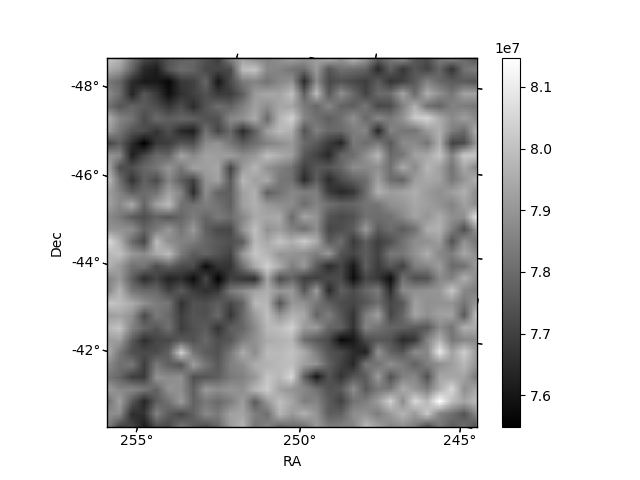
Histogram calculated using DETX and DETY for each event in the final _common_clean file
| Quadrant A | 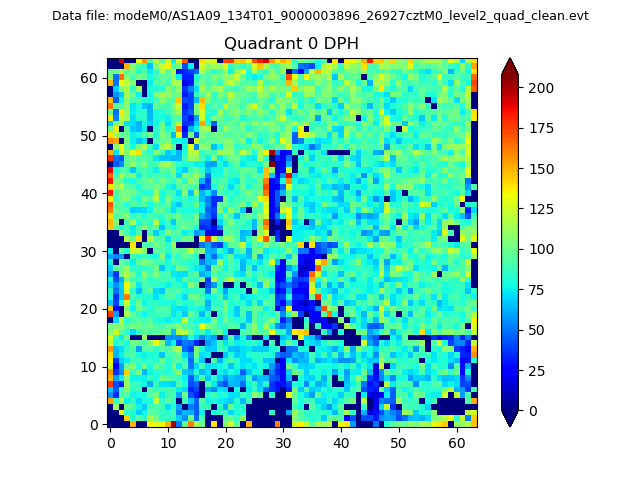 |
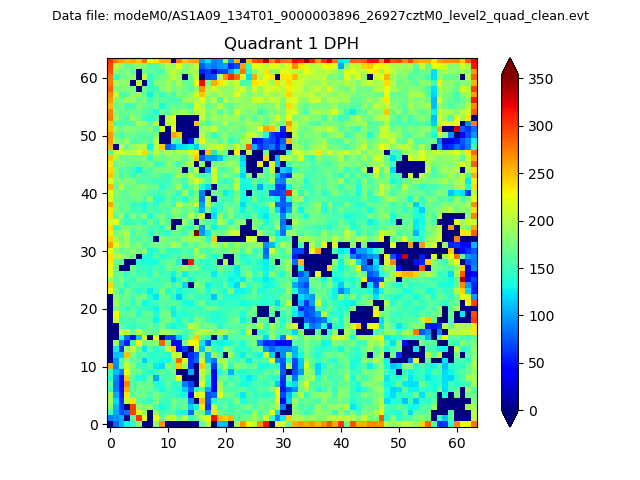 |
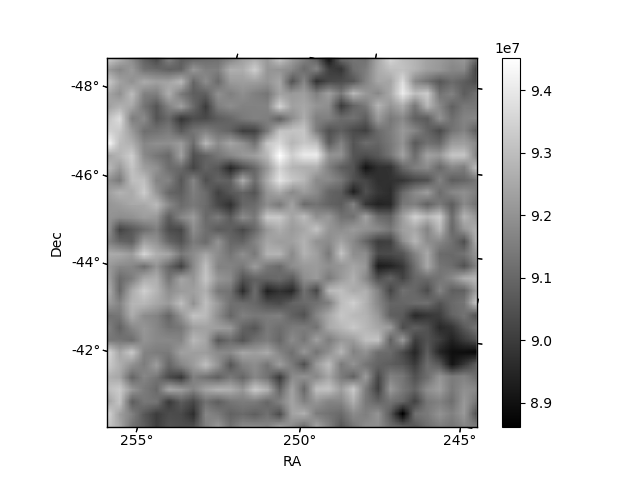
Quadrant B |
|---|---|---|---|
| Quadrant D | 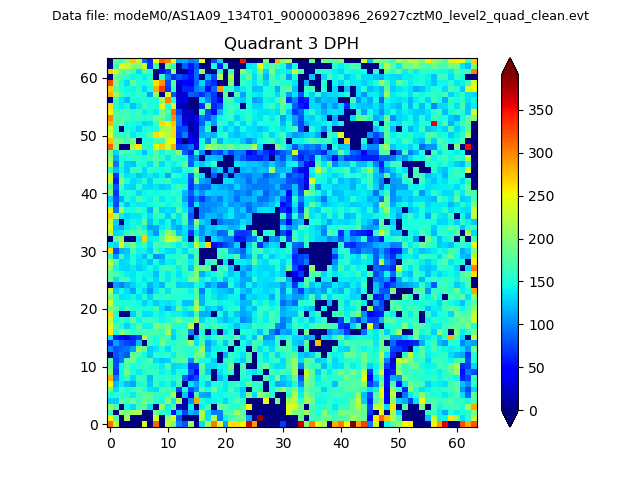 |
 |
Quadrant C |
| Plot type | Count rate plots | Images |
|---|---|---|
| Comparison with Poisson distribution Blue bars denote a histogram of data divided into 1 sec bins. Red curve is a Poisson curve with rate = median count rate of data. |
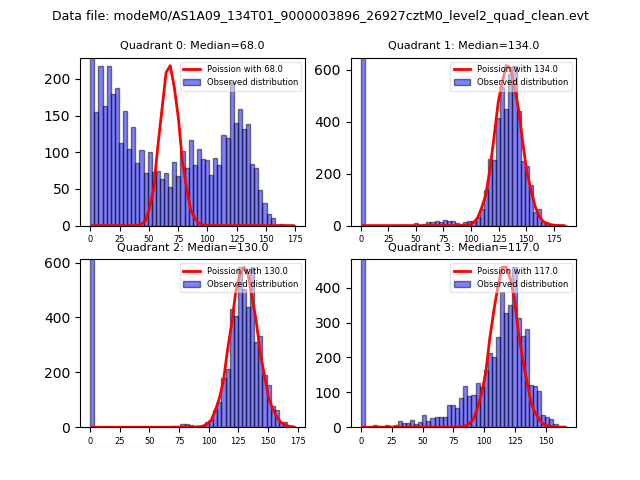 |
 |
| Quadrant-wise count rates Data is divided into 100 sec bins |
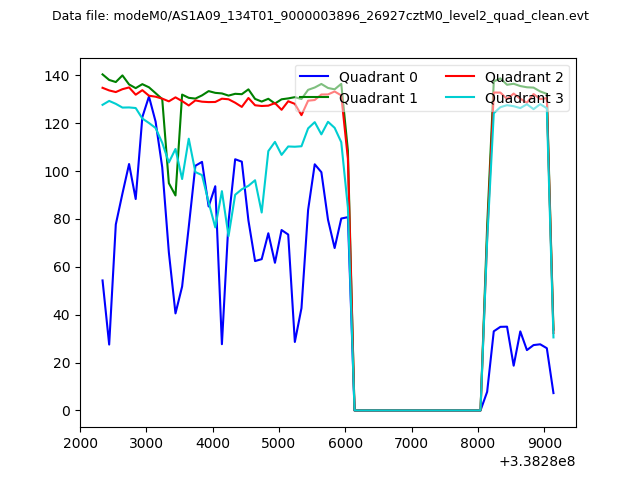 |
|
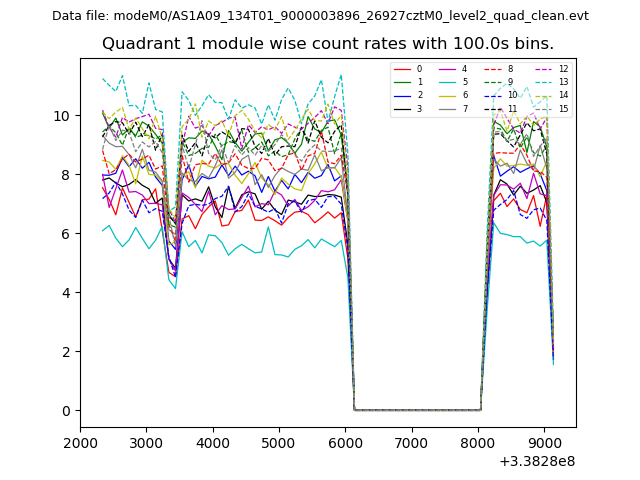
| Module-wise count rates for Quadrant A Data is divided into 100 sec bins |
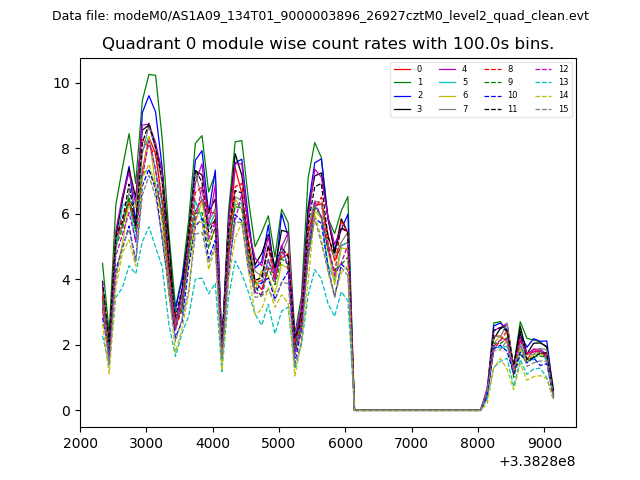 |
 |
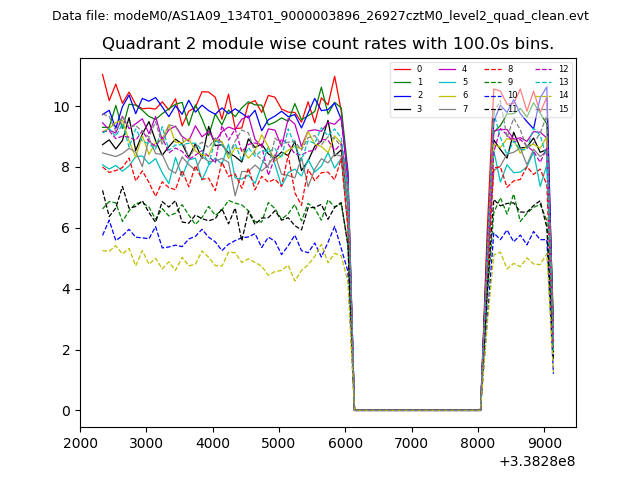
| Module-wise count rates for Quadrant B Data is divided into 100 sec bins |
 |
 |
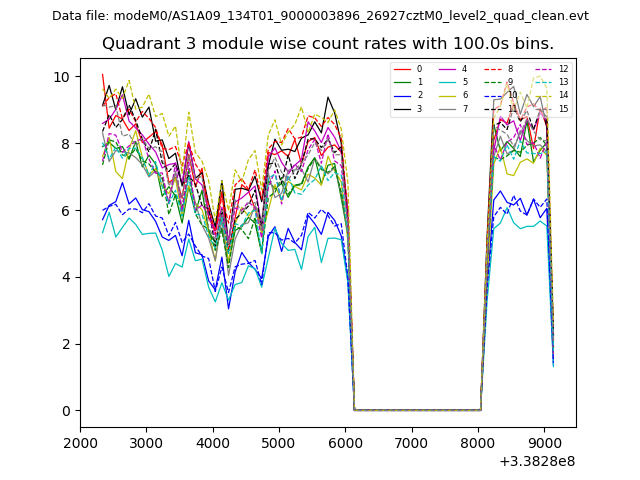
| Module-wise count rates for Quadrant C Data is divided into 100 sec bins |
 |
 |
| Module-wise count rates for Quadrant D Data is divided into 100 sec bins |
 |
 |
| Parameter | Plot |
|---|---|
| CZT HV Monitor | 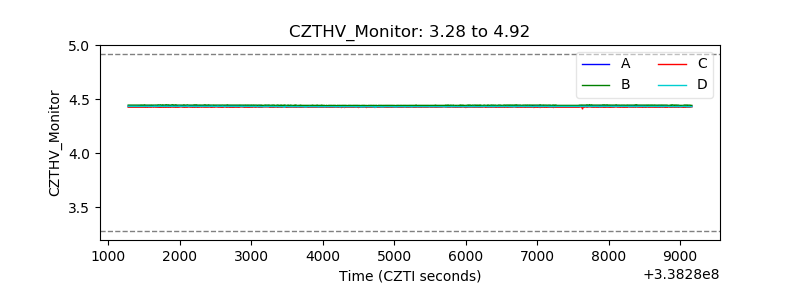 |
| D_VDD | 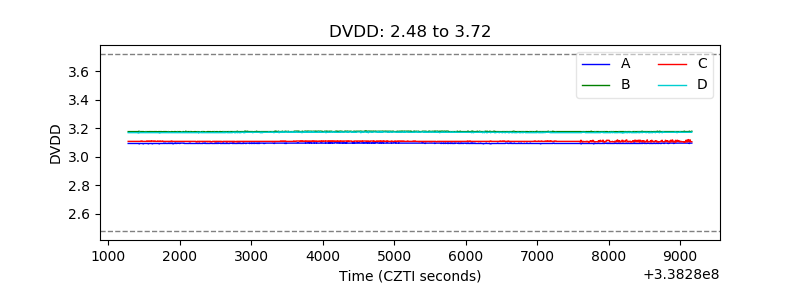 |
| Temperature 1 | 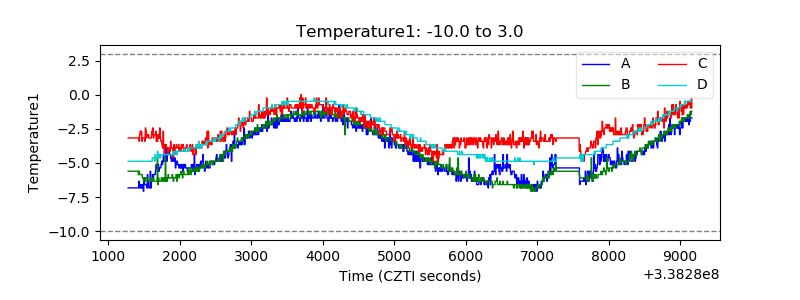 |
| Veto HV Monitor | 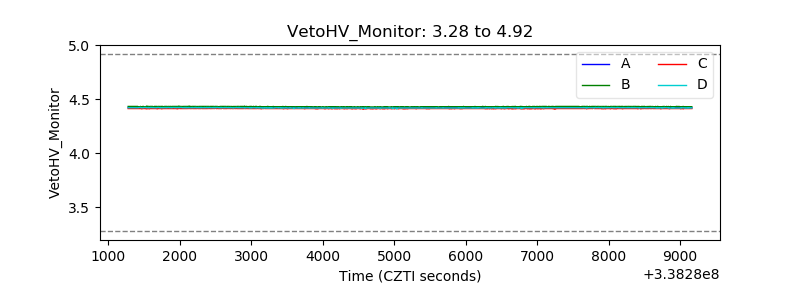 |
| Veto LLD | 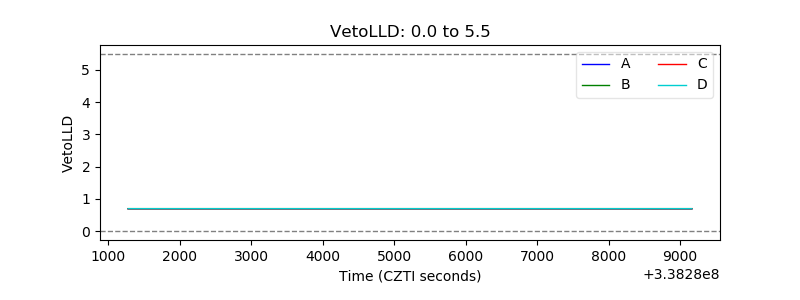 |
| Alpha Counter | 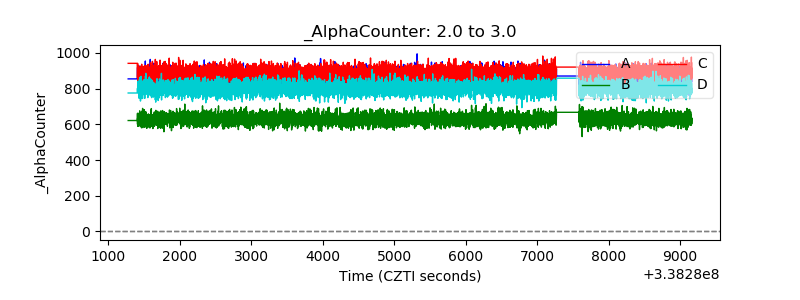 |
| _CPM_Rate | 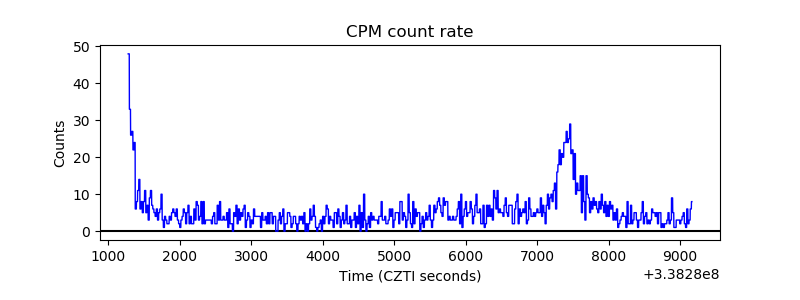 |
| CZT Counter | 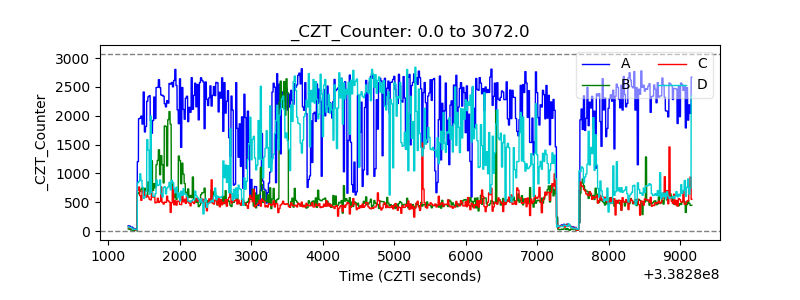 |
| +2.5 Volts monitor | 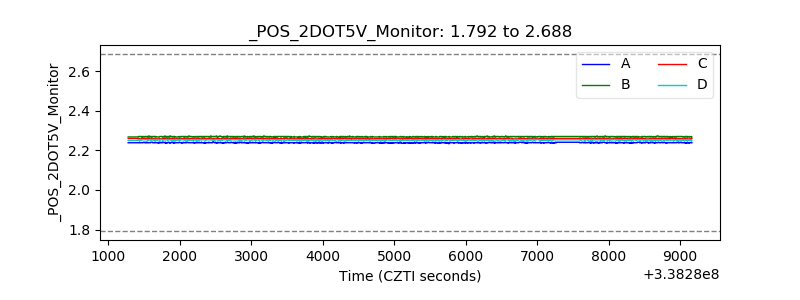 |
| +5 Volts monitor |  |
| _ROLL_ROT | 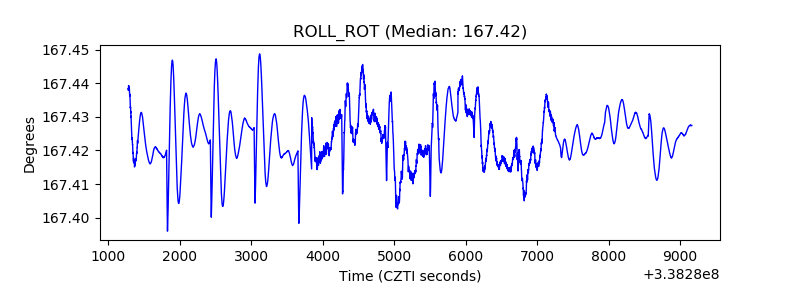 |
| _Roll_DEC | 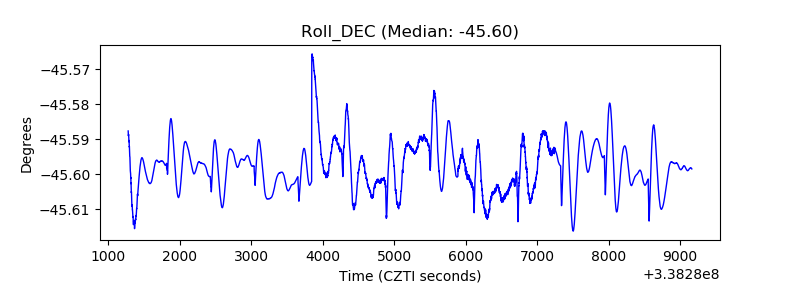 |
| _Roll_RA | 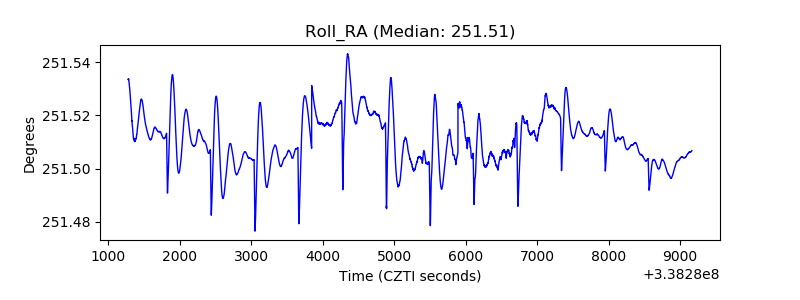 |
| Veto Counter | 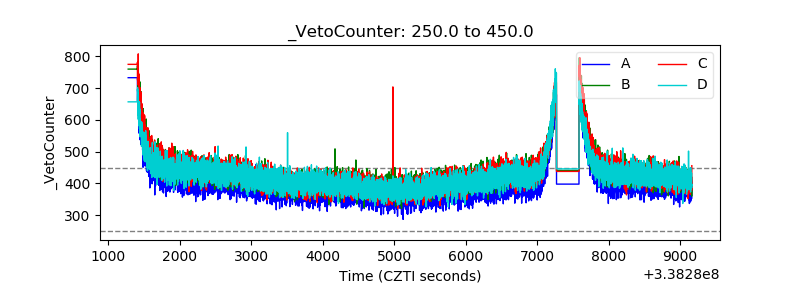 |