| Param | Original file | Final file |
|---|---|---|
| Filename | modeM0/AS1A09_134T01_9000003896_26928cztM0_level2.evt | modeM0/AS1A09_134T01_9000003896_26928cztM0_level2_quad_clean.evt |
| Size (bytes) | 1,061,752,320 | 82,189,440 |
| Size | 1012.6 MB | 78.4 MB |
| Events in quadrant A | 15,897,108 | 101,750 |
| Events in quadrant B | 4,404,156 | 665,597 |
| Events in quadrant C | 3,444,935 | 652,182 |
| Events in quadrant D | 7,938,273 | 580,490 |
| Mode M9 | |||
|---|---|---|---|
| Quadrant | BADHDUFLAG | Total packets | Discarded packets |
| A | 0 | 1 | 0 |
| B | 0 | 1 | 0 |
| C | 0 | 1 | 0 |
| D | 0 | 1 | 0 |
| Mode M0 | |||
|---|---|---|---|
| Quadrant | BADHDUFLAG | Total packets | Discarded packets |
| A | 0 | 51889 | 0 |
| B | 0 | 17401 | 0 |
| C | 0 | 14610 | 0 |
| D | 0 | 28457 | 0 |
| Quadrant | Total seconds | Saturated seconds | Saturation percentage |
|---|---|---|---|
| A | 6969 | 6907 | 99.110346% |
| B | 6969 | 374 | 5.366624% |
| C | 6970 | 164 | 2.352941% |
| D | 6969 | 989 | 14.191419% |
Noise dominated data is calculated using 1-second bins in cleaned event files. If a bin has >2000 counts, and if more than 50% of those come from <1% of pixels, then it is considered to be noise-dominated and hence unusable.
| Quadrant | # 1 sec bins | Bins with >0 counts | Bins with >2000 counts | High rate bins dominated by noise | Noise dominated (total time) | Noise dominated (detector-on time) | Marked lightcurve |
|---|---|---|---|---|---|---|---|
| A | 7153 | 6968 | 5798 | 5798 | 81.06% | 83.21% | 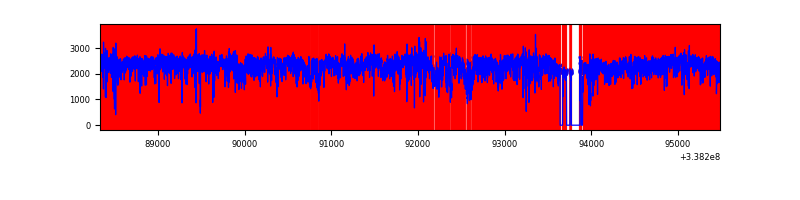 |
| B | 7154 | 6971 | 131 | 131 | 1.83% | 1.88% | 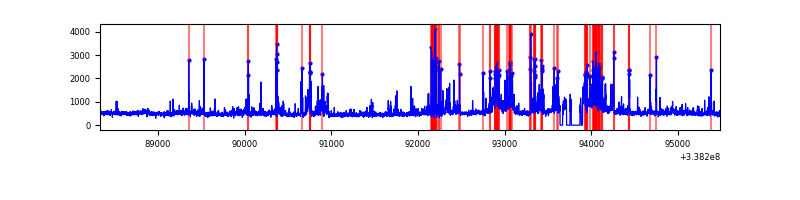 |
| C | 7155 | 6973 | 4 | 4 | 0.06% | 0.06% | 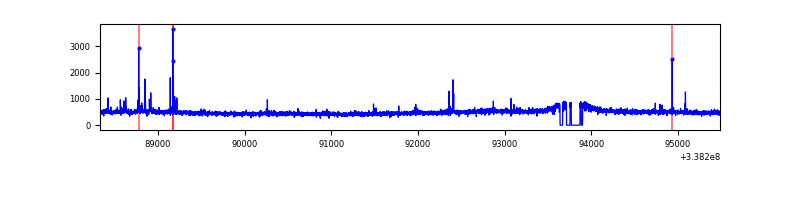 |
| D | 7153 | 6972 | 945 | 945 | 13.21% | 13.55% | 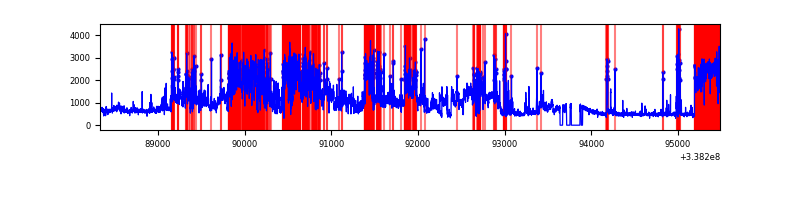 |
Top three noisy pixels from each quadrant. If the there are fewer than three noisy pixels in the level2.evt file, extra rows are filled as -1
| Pixel properties | Quadrant properties | ||||||
|---|---|---|---|---|---|---|---|
| Quadrant | DetID | PixID | Counts | Sigma | Mean | Median | Sigma |
| A | 14 | 235 | 15135725 | 382412.57 | 186 | 182 | 39.6 |
| A | 0 | 13 | 25022 | 627.6 | 186 | 182 | 39.6 |
| A | 8 | 192 | 12611 | 314.03 | 186 | 182 | 39.6 |
| B | 3 | 64 | 544973 | 3364.22 | 844 | 824 | 161.7 |
| B | 0 | 189 | 345664 | 2131.99 | 844 | 824 | 161.7 |
| B | 0 | 190 | 61266 | 373.69 | 844 | 824 | 161.7 |
| C | 14 | 238 | 131599 | 669.76 | 829 | 833 | 195.2 |
| C | 15 | 208 | 66000 | 333.78 | 829 | 833 | 195.2 |
| C | 8 | 128 | 9032 | 41.99 | 829 | 833 | 195.2 |
| D | 7 | 80 | 3801668 | 19183.62 | 801 | 780 | 198.1 |
| D | 2 | 250 | 732709 | 3694.15 | 801 | 780 | 198.1 |
| D | 12 | 233 | 233625 | 1175.2 | 801 | 780 | 198.1 |
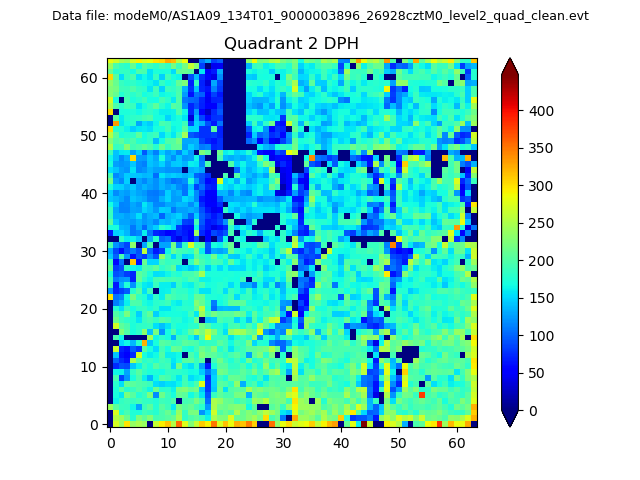
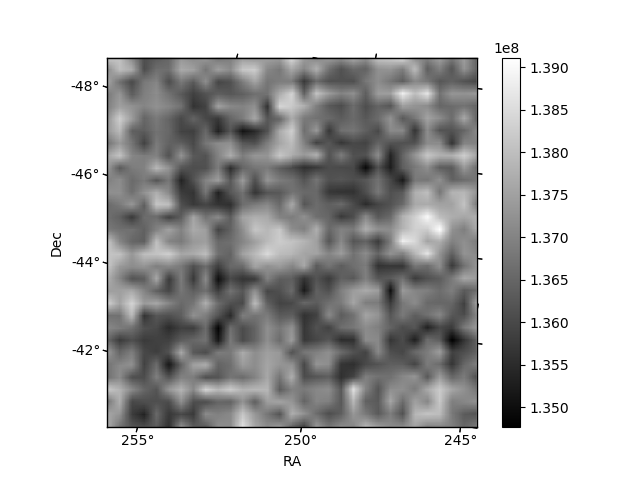
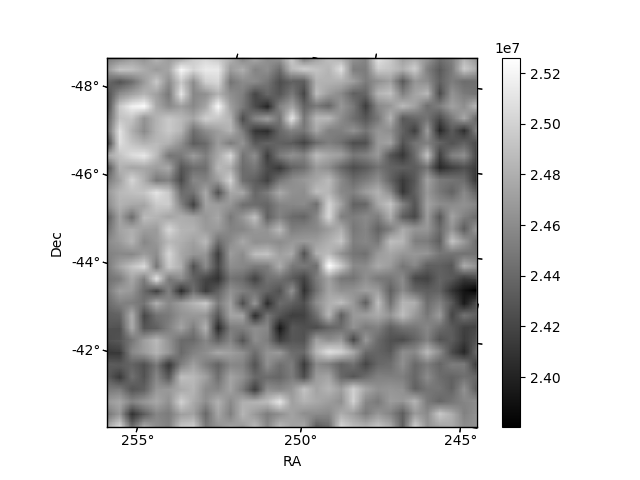
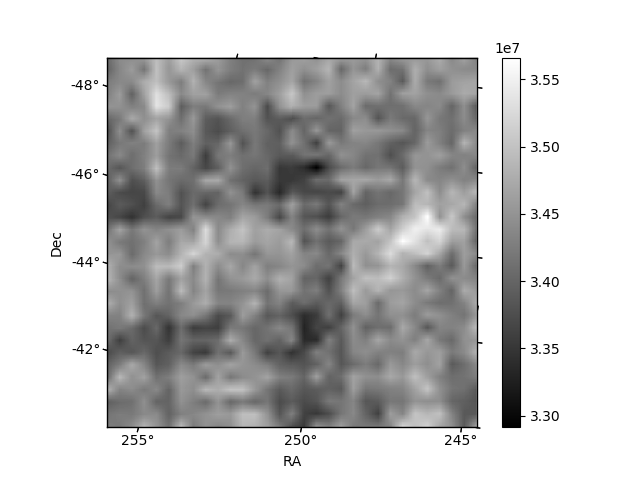
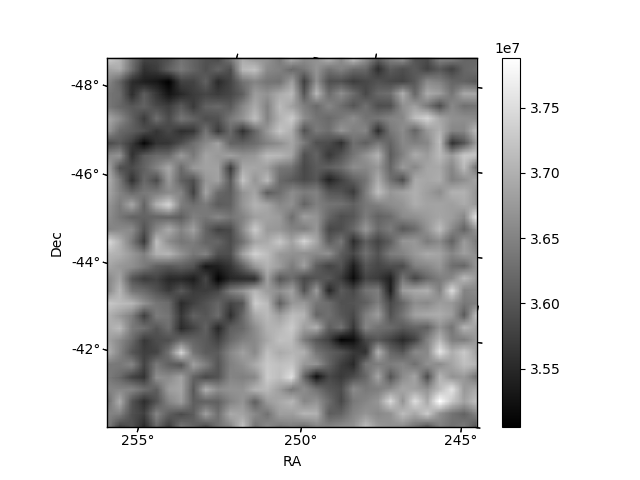
Histogram calculated using DETX and DETY for each event in the final _common_clean file
| Quadrant A | 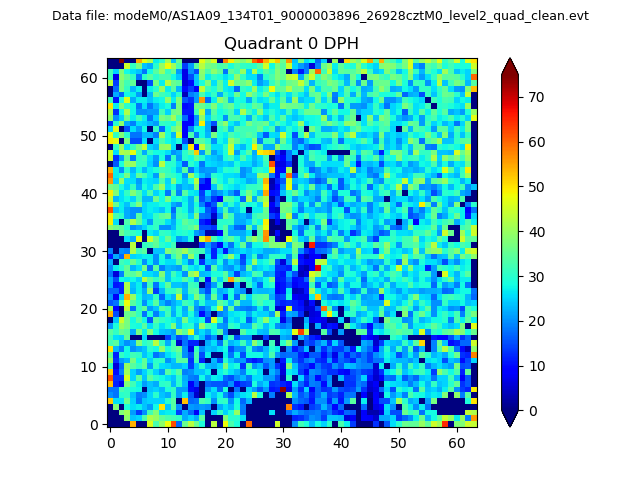 |
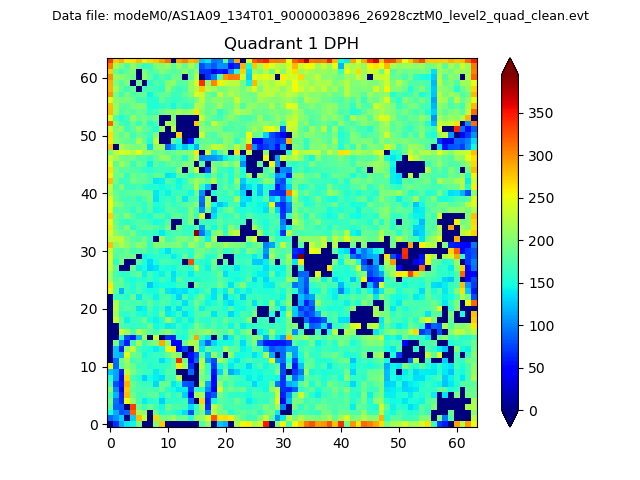 |
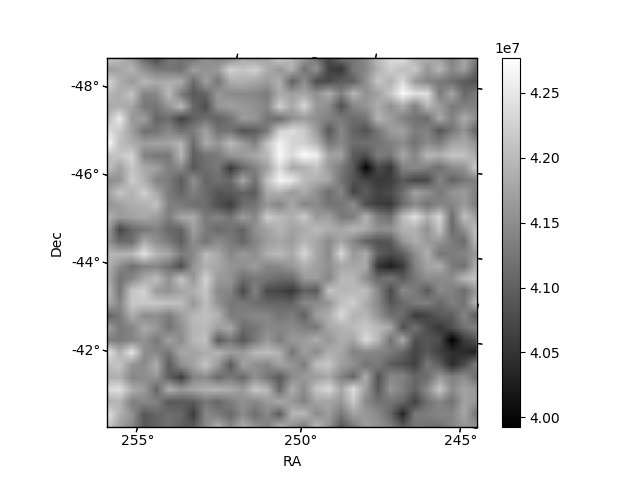
Quadrant B |
|---|---|---|---|
| Quadrant D | 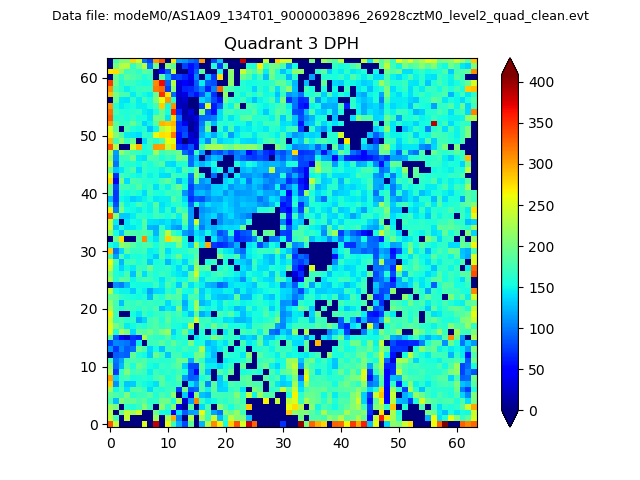 |
 |
Quadrant C |
| Plot type | Count rate plots | Images |
|---|---|---|
| Comparison with Poisson distribution Blue bars denote a histogram of data divided into 1 sec bins. Red curve is a Poisson curve with rate = median count rate of data. |
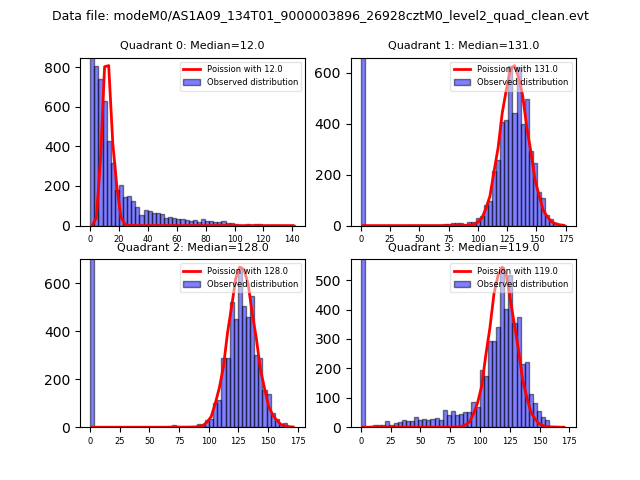 |
 |
| Quadrant-wise count rates Data is divided into 100 sec bins |
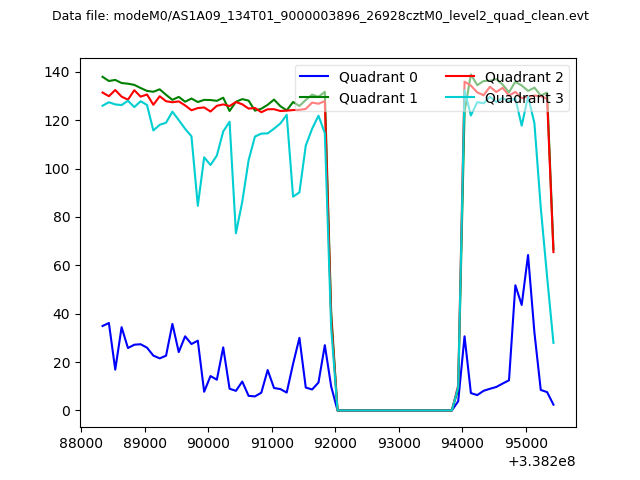 |
|
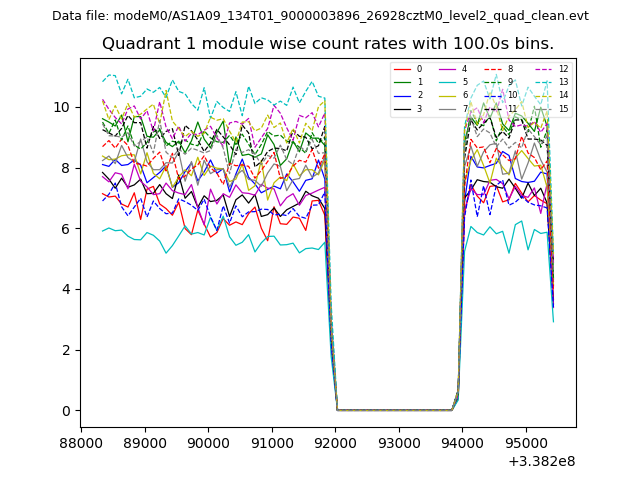
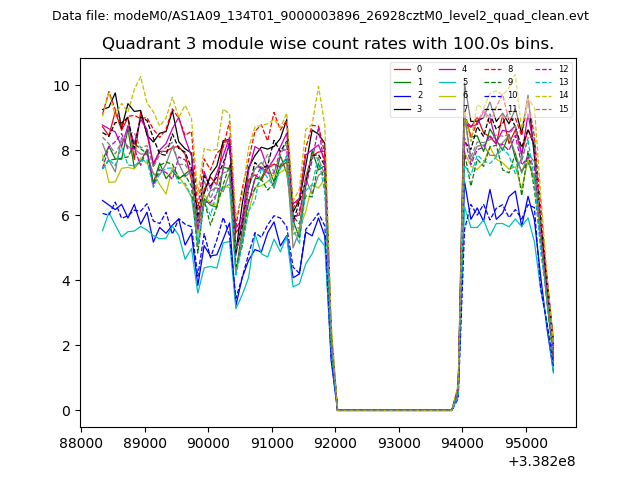
| Module-wise count rates for Quadrant A Data is divided into 100 sec bins |
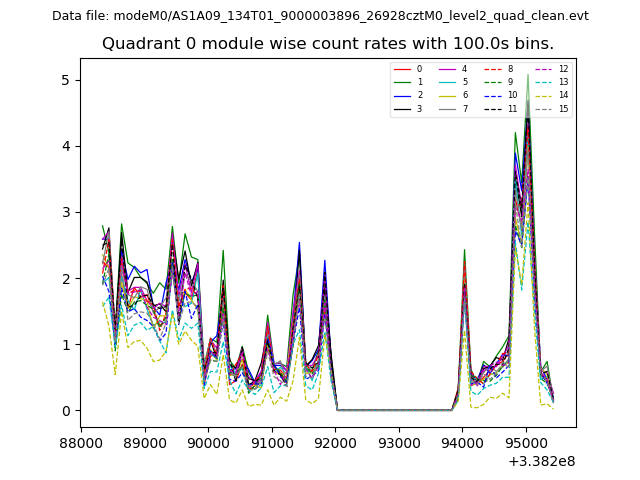 |
 |
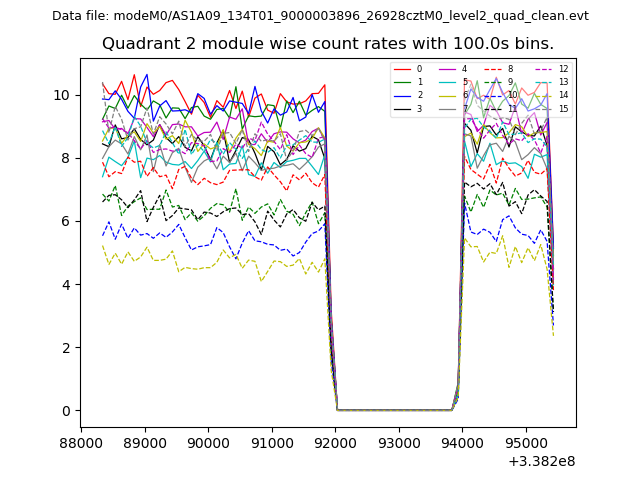
| Module-wise count rates for Quadrant B Data is divided into 100 sec bins |
 |
 |
| Module-wise count rates for Quadrant C Data is divided into 100 sec bins |
 |
 |
| Module-wise count rates for Quadrant D Data is divided into 100 sec bins |
 |
 |
| Parameter | Plot |
|---|---|
| CZT HV Monitor | 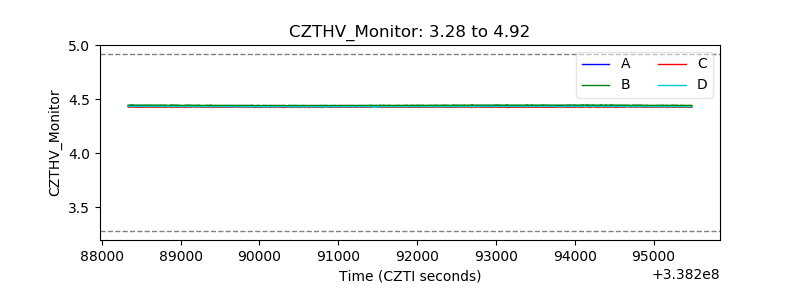 |
| D_VDD | 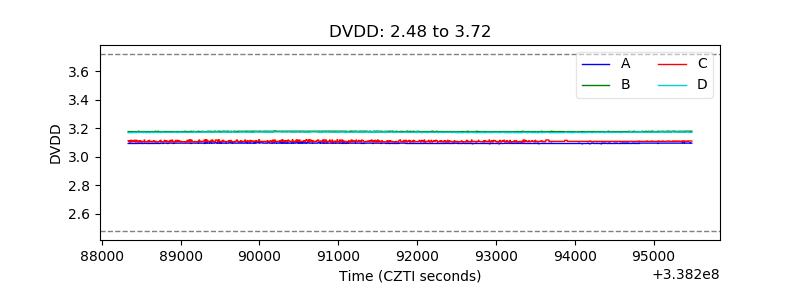 |
| Temperature 1 | 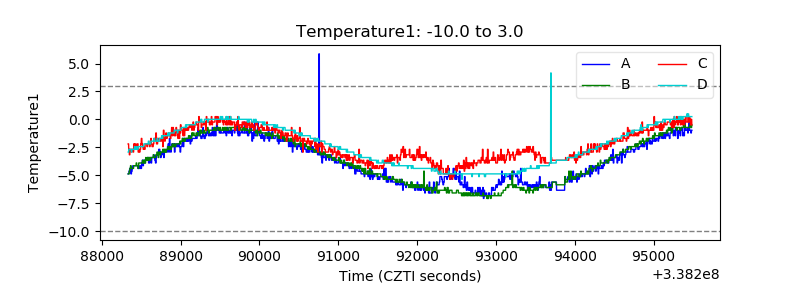 |
| Veto HV Monitor | 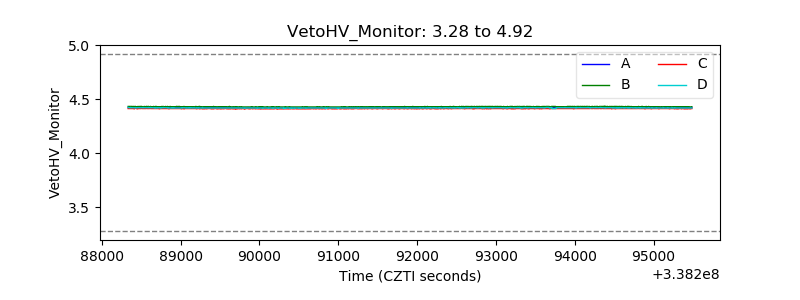 |
| Veto LLD | 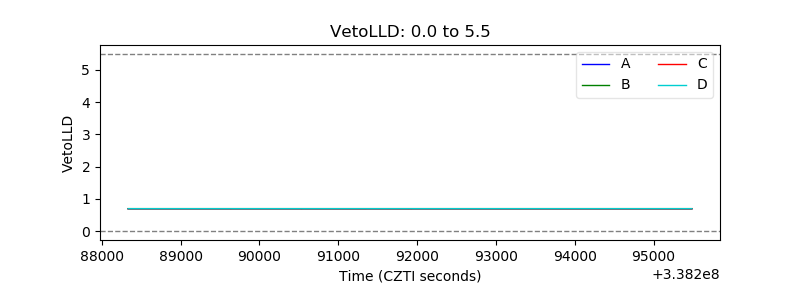 |
| Alpha Counter | 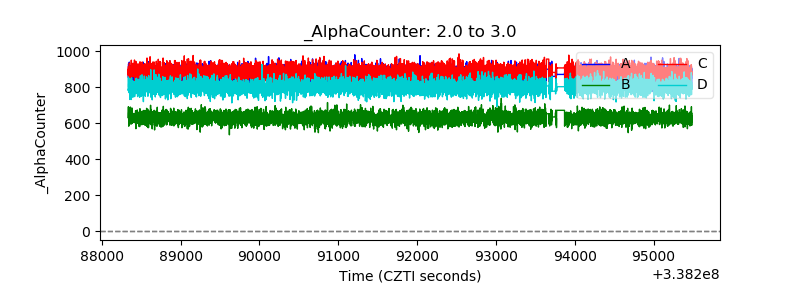 |
| _CPM_Rate | 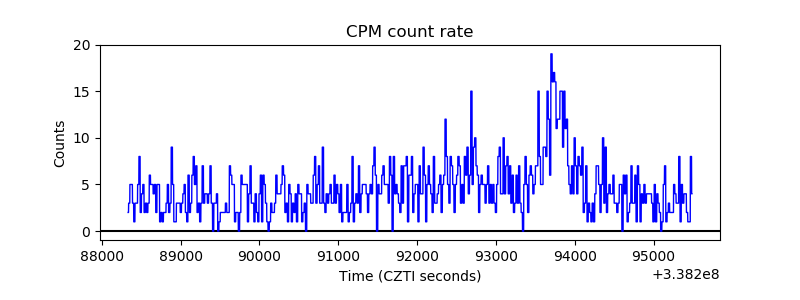 |
| CZT Counter | 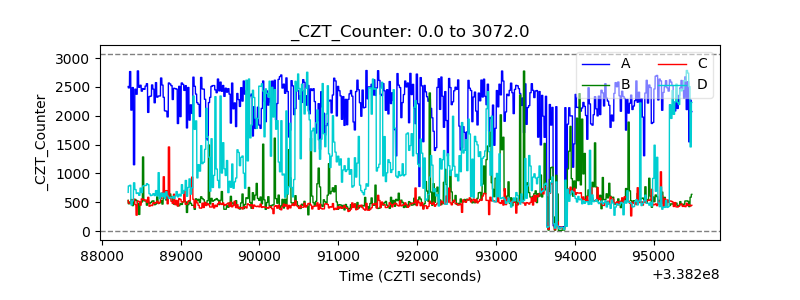 |
| +2.5 Volts monitor |  |
| +5 Volts monitor |  |
| _ROLL_ROT | 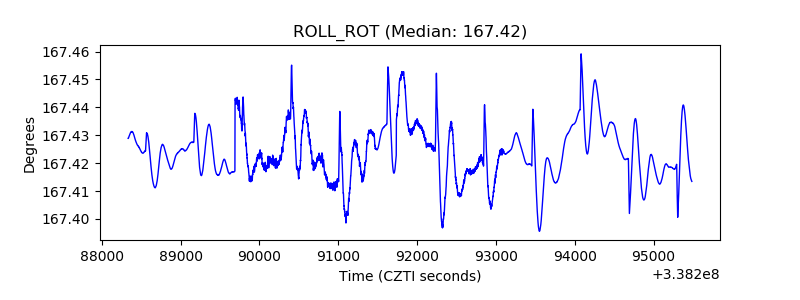 |
| _Roll_DEC | 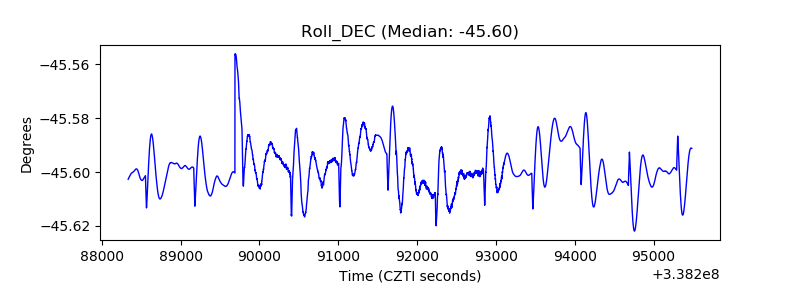 |
| _Roll_RA | 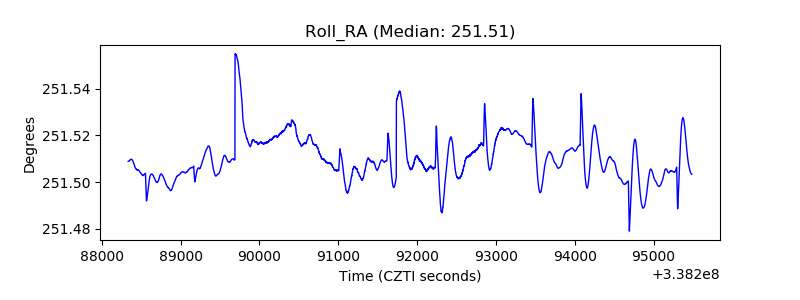 |
| Veto Counter | 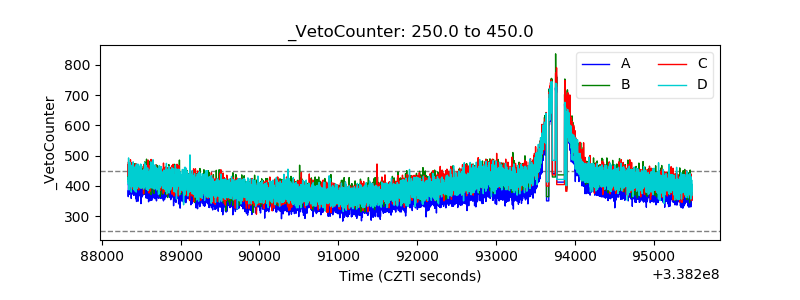 |