| Param | Original file | Final file |
|---|---|---|
| Filename | modeM0/AS1A09_134T01_9000003896_26929cztM0_level2.evt | modeM0/AS1A09_134T01_9000003896_26929cztM0_level2_quad_clean.evt |
| Size (bytes) | 1,091,888,640 | 79,079,040 |
| Size | 1.0 GB | 75.4 MB |
| Events in quadrant A | 16,079,452 | 94,559 |
| Events in quadrant B | 5,341,255 | 637,263 |
| Events in quadrant C | 3,420,041 | 633,391 |
| Events in quadrant D | 7,751,599 | 534,999 |
| Mode M9 | |||
|---|---|---|---|
| Quadrant | BADHDUFLAG | Total packets | Discarded packets |
| A | 0 | 3 | 0 |
| B | 0 | 3 | 0 |
| C | 0 | 3 | 0 |
| D | 0 | 3 | 0 |
| Mode M0 | |||
|---|---|---|---|
| Quadrant | BADHDUFLAG | Total packets | Discarded packets |
| A | 0 | 52515 | 0 |
| B | 0 | 20501 | 0 |
| C | 0 | 14640 | 0 |
| D | 0 | 27697 | 0 |
| Quadrant | Total seconds | Saturated seconds | Saturation percentage |
|---|---|---|---|
| A | 7051 | 7002 | 99.305063% |
| B | 7051 | 627 | 8.892356% |
| C | 7052 | 90 | 1.276234% |
| D | 7052 | 1449 | 20.547362% |
Noise dominated data is calculated using 1-second bins in cleaned event files. If a bin has >2000 counts, and if more than 50% of those come from <1% of pixels, then it is considered to be noise-dominated and hence unusable.
| Quadrant | # 1 sec bins | Bins with >0 counts | Bins with >2000 counts | High rate bins dominated by noise | Noise dominated (total time) | Noise dominated (detector-on time) | Marked lightcurve |
|---|---|---|---|---|---|---|---|
| A | 7420 | 7050 | 5828 | 5828 | 78.54% | 82.67% | 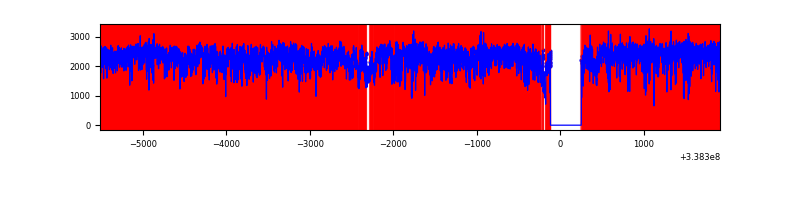 |
| B | 7421 | 7052 | 368 | 368 | 4.96% | 5.22% | 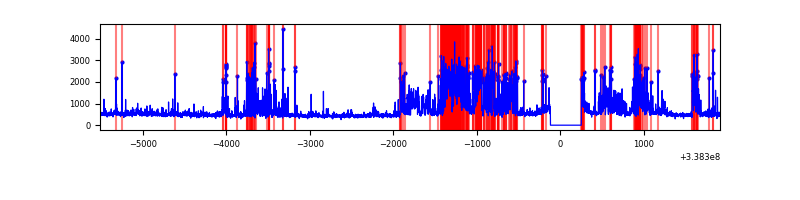 |
| C | 7422 | 7053 | 7 | 7 | 0.09% | 0.10% | 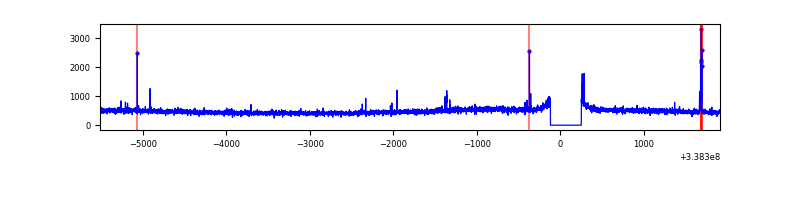 |
| D | 7422 | 7053 | 1358 | 1358 | 18.30% | 19.25% | 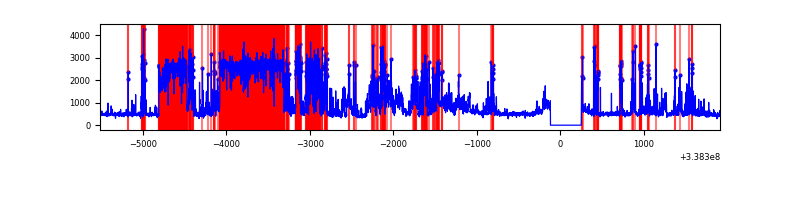 |
Top three noisy pixels from each quadrant. If the there are fewer than three noisy pixels in the level2.evt file, extra rows are filled as -1
| Pixel properties | Quadrant properties | ||||||
|---|---|---|---|---|---|---|---|
| Quadrant | DetID | PixID | Counts | Sigma | Mean | Median | Sigma |
| A | 14 | 235 | 15386434 | 431646.37 | 168 | 165 | 35.6 |
| A | 0 | 13 | 29392 | 819.93 | 168 | 165 | 35.6 |
| A | 8 | 192 | 9095 | 250.52 | 168 | 165 | 35.6 |
| B | 3 | 64 | 1135487 | 7199.96 | 827 | 808 | 157.6 |
| B | 0 | 189 | 858068 | 5439.63 | 827 | 808 | 157.6 |
| B | 0 | 219 | 29734 | 183.55 | 827 | 808 | 157.6 |
| C | 14 | 238 | 132234 | 664.67 | 828 | 832 | 197.7 |
| C | 15 | 208 | 26776 | 131.23 | 828 | 832 | 197.7 |
| C | 0 | 207 | 25563 | 125.1 | 828 | 832 | 197.7 |
| D | 7 | 80 | 3779421 | 19585.55 | 772 | 753 | 192.9 |
| D | 2 | 250 | 720862 | 3732.46 | 772 | 753 | 192.9 |
| D | 11 | 176 | 153558 | 792.02 | 772 | 753 | 192.9 |
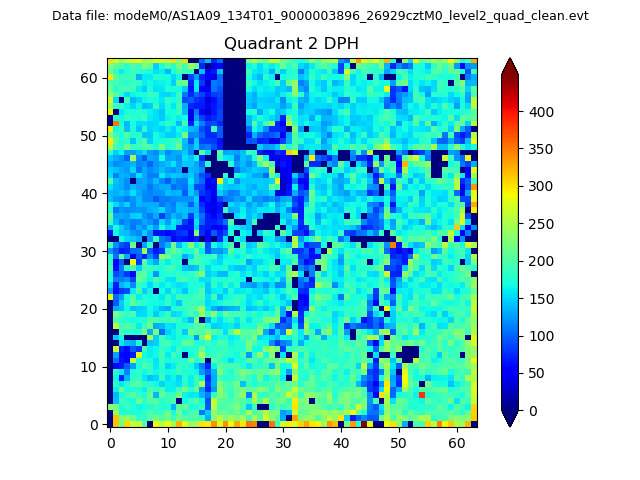
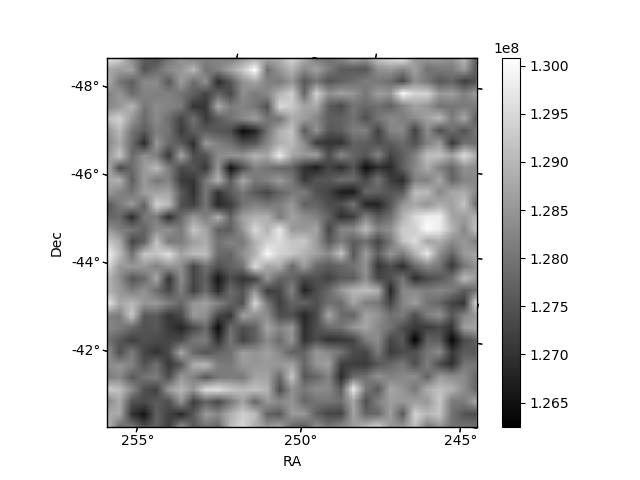
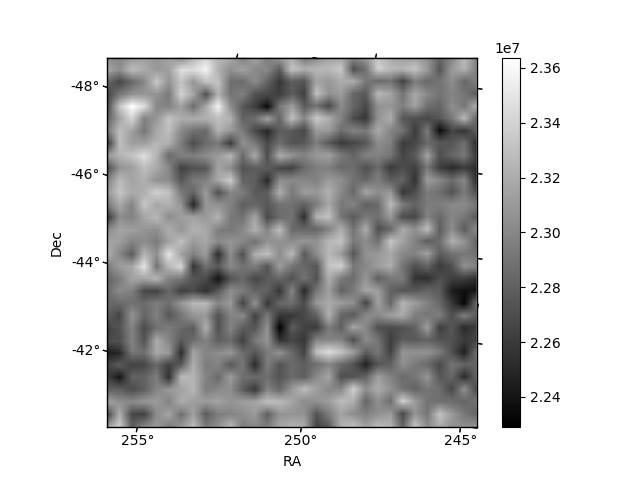
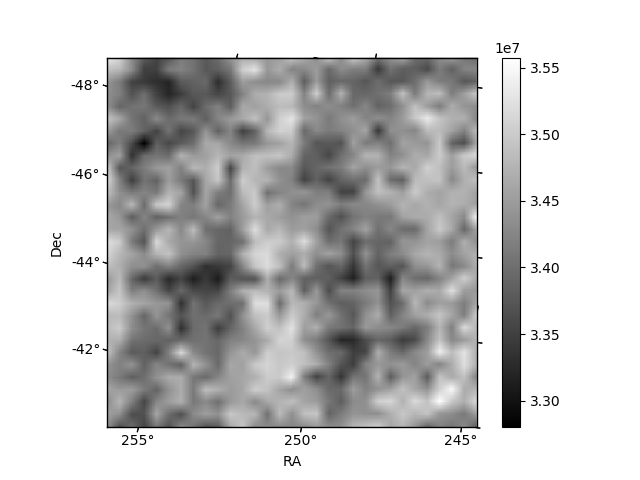
Histogram calculated using DETX and DETY for each event in the final _common_clean file
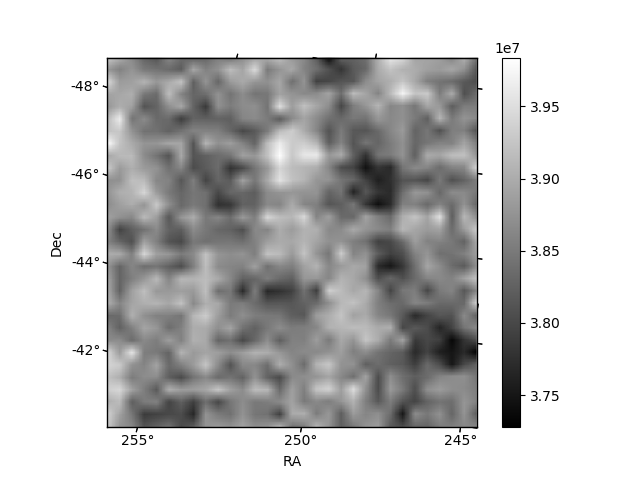
| Quadrant A | 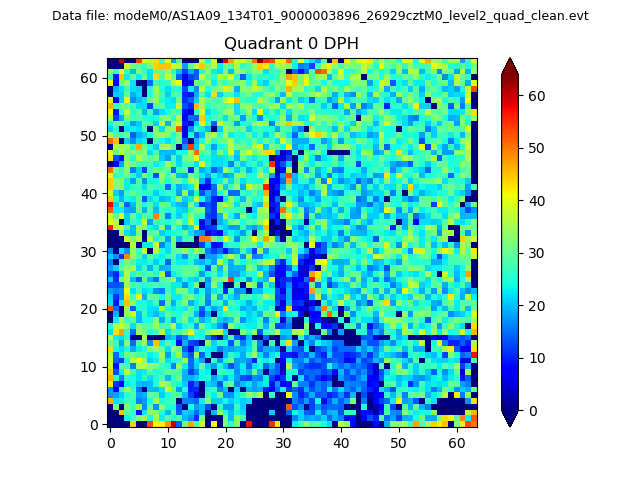 |
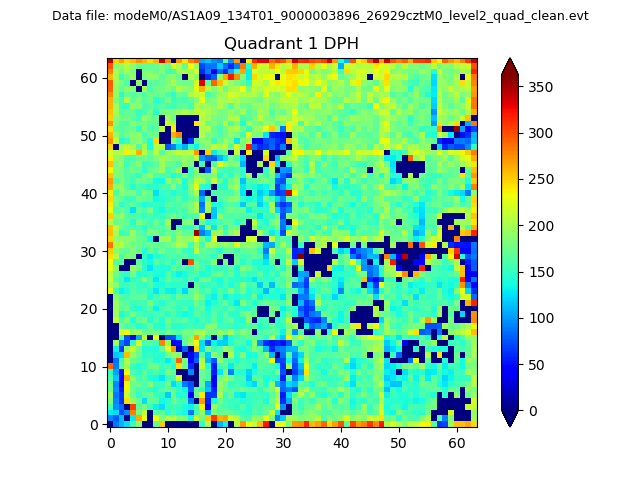 |
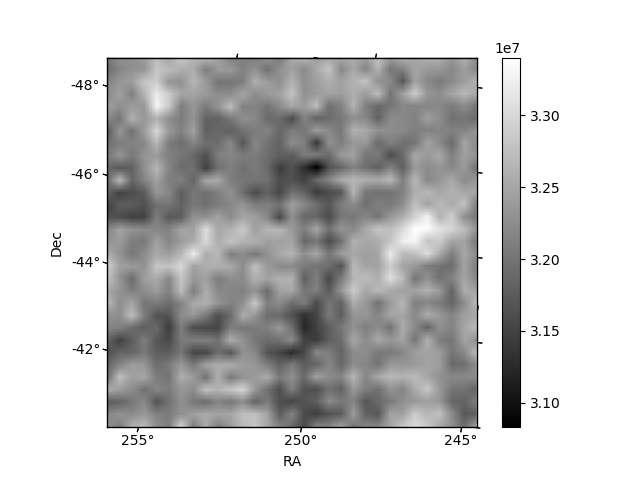
Quadrant B |
|---|---|---|---|
| Quadrant D | 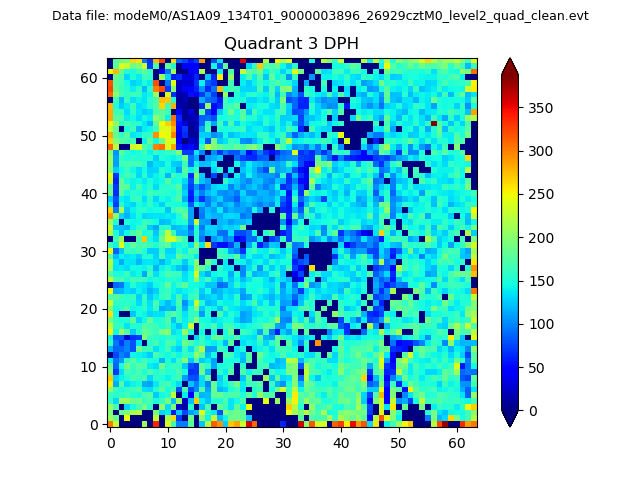 |
 |
Quadrant C |
| Plot type | Count rate plots | Images |
|---|---|---|
| Comparison with Poisson distribution Blue bars denote a histogram of data divided into 1 sec bins. Red curve is a Poisson curve with rate = median count rate of data. |
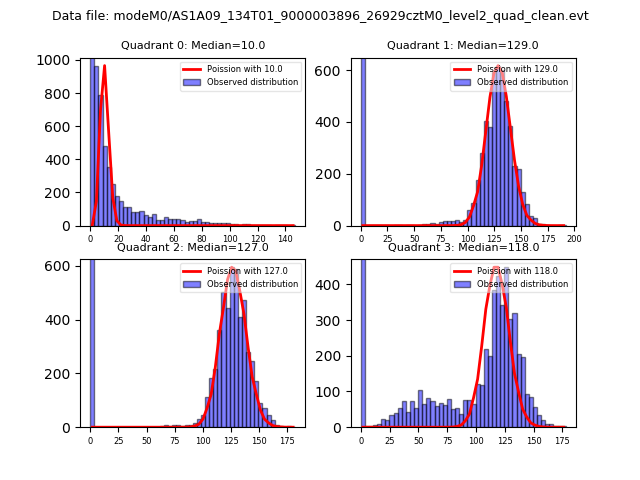 |
 |
| Quadrant-wise count rates Data is divided into 100 sec bins |
 |
|
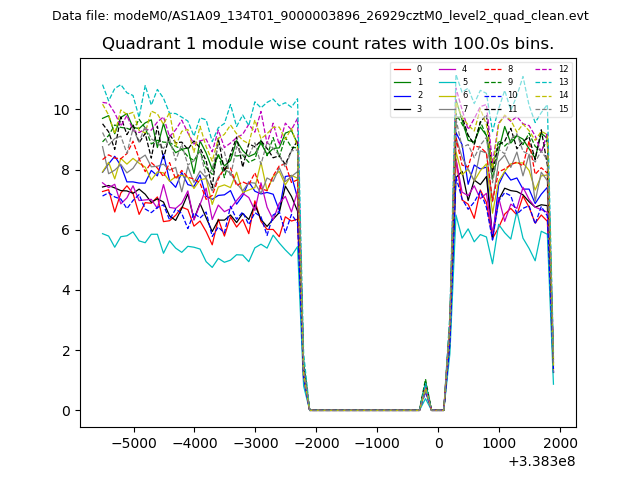
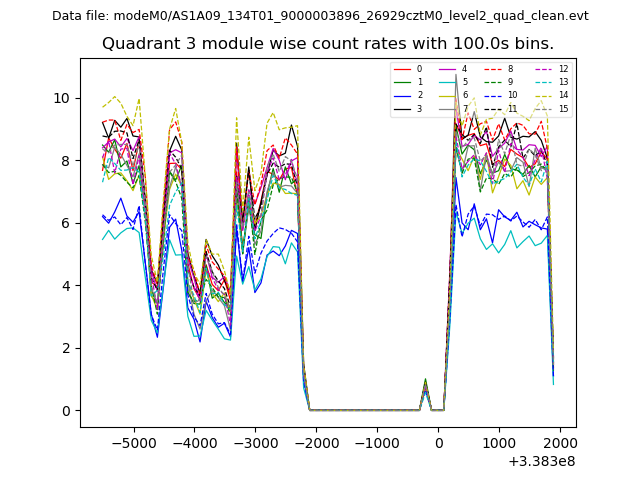
| Module-wise count rates for Quadrant A Data is divided into 100 sec bins |
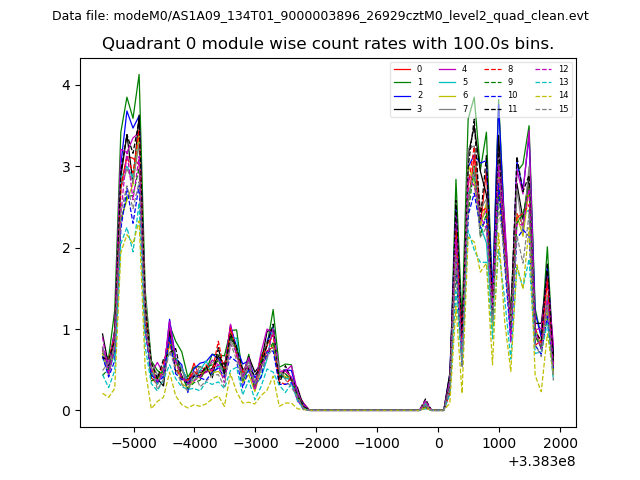 |
 |
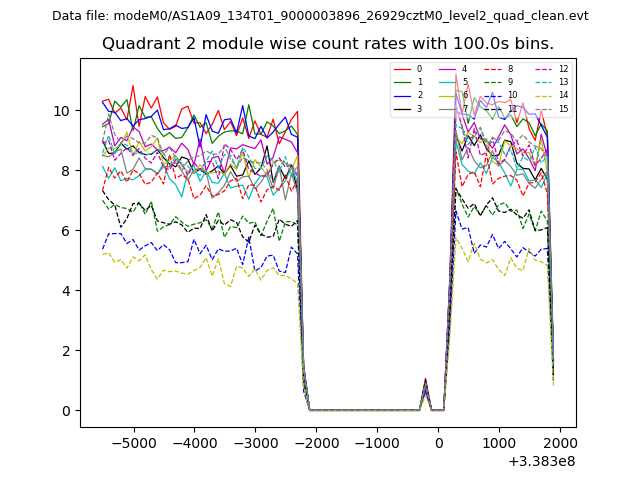
| Module-wise count rates for Quadrant B Data is divided into 100 sec bins |
 |
 |
| Module-wise count rates for Quadrant C Data is divided into 100 sec bins |
 |
 |
| Module-wise count rates for Quadrant D Data is divided into 100 sec bins |
 |
 |
| Parameter | Plot |
|---|---|
| CZT HV Monitor | 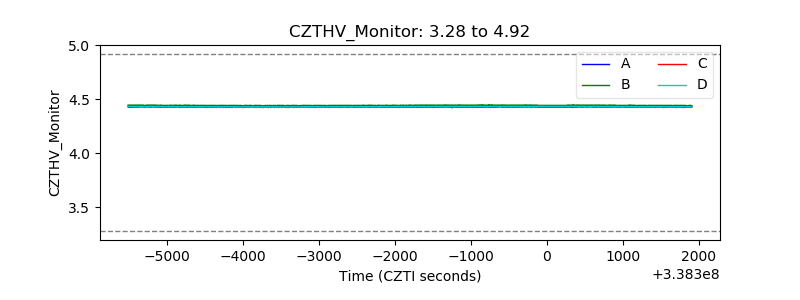 |
| D_VDD | 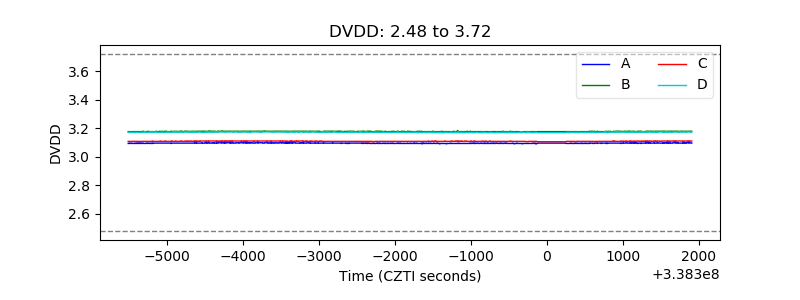 |
| Temperature 1 | 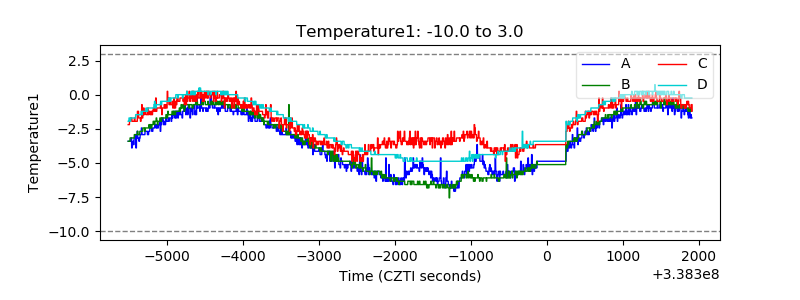 |
| Veto HV Monitor | 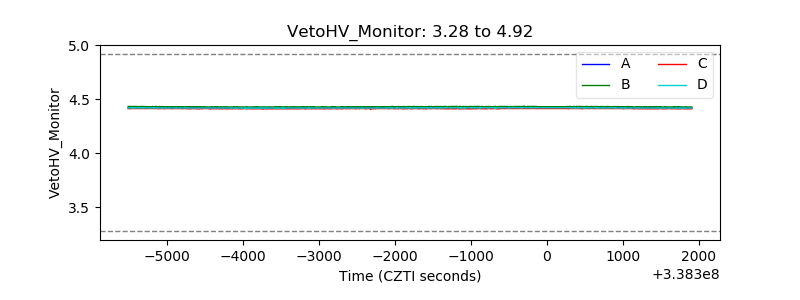 |
| Veto LLD | 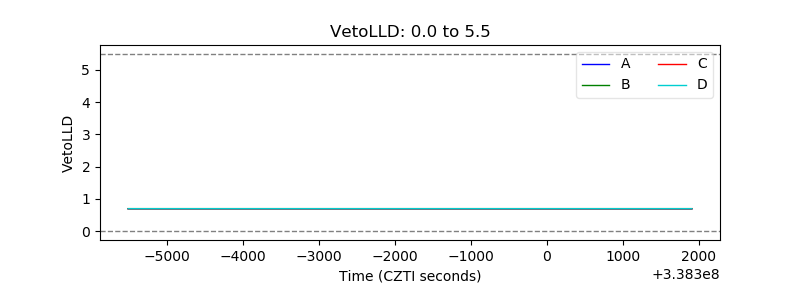 |
| Alpha Counter | 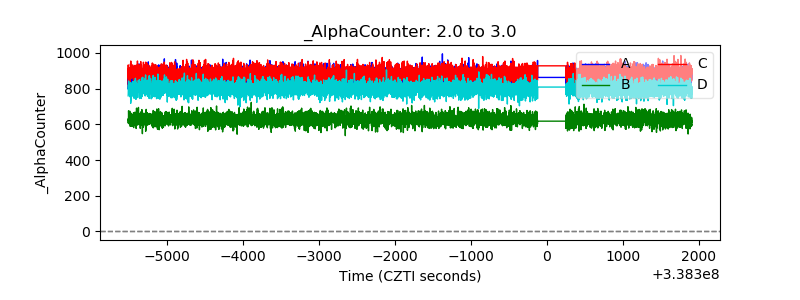 |
| _CPM_Rate |  |
| CZT Counter | 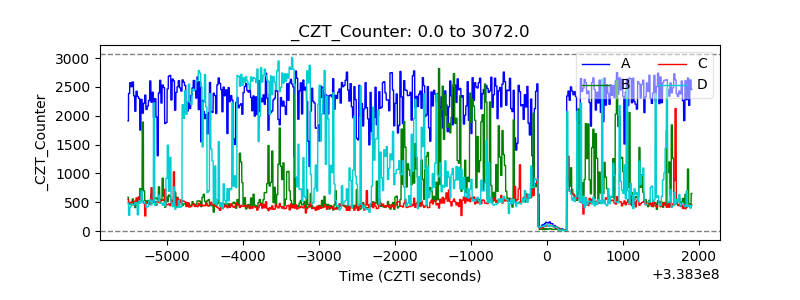 |
| +2.5 Volts monitor |  |
| +5 Volts monitor | 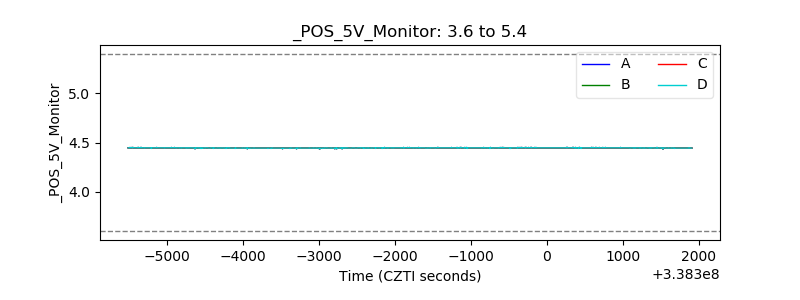 |
| _ROLL_ROT | 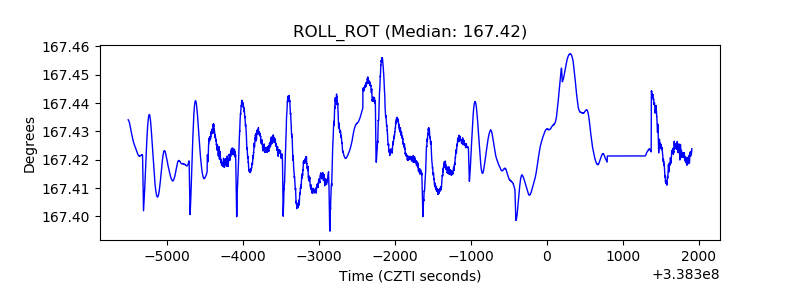 |
| _Roll_DEC | 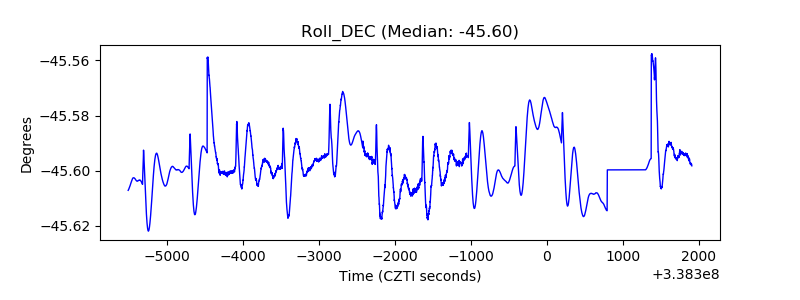 |
| _Roll_RA | 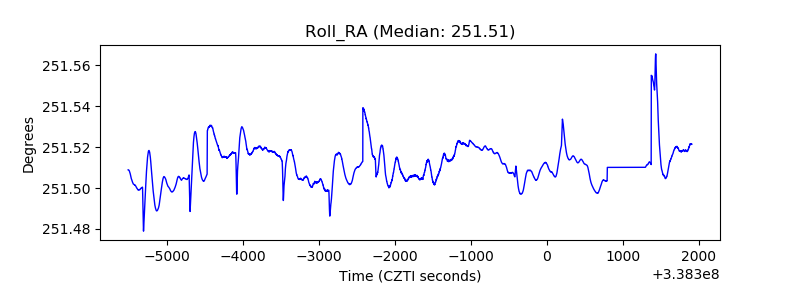 |
| Veto Counter | 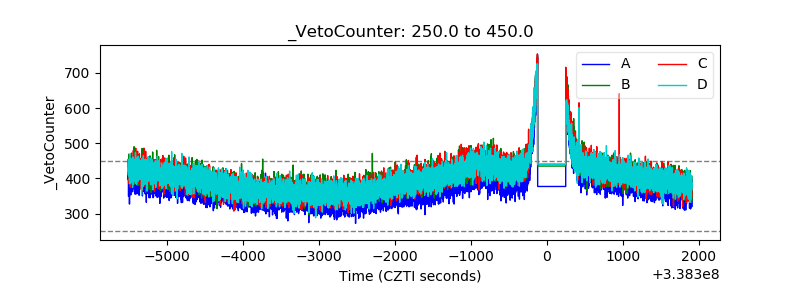 |