| Param | Original file | Final file |
|---|---|---|
| Filename | modeM0/AS1A09_134T01_9000003896_26931cztM0_level2.evt | modeM0/AS1A09_134T01_9000003896_26931cztM0_level2_quad_clean.evt |
| Size (bytes) | 1,551,450,240 | 127,681,920 |
| Size | 1.4 GB | 121.8 MB |
| Events in quadrant A | 25,699,479 | 146,964 |
| Events in quadrant B | 7,413,551 | 988,538 |
| Events in quadrant C | 5,757,687 | 972,709 |
| Events in quadrant D | 7,314,664 | 935,172 |
| Mode M9 | |||
|---|---|---|---|
| Quadrant | BADHDUFLAG | Total packets | Discarded packets |
| A | 0 | 12 | 0 |
| B | 0 | 12 | 0 |
| C | 0 | 12 | 0 |
| D | 0 | 12 | 0 |
| Mode M0 | |||
|---|---|---|---|
| Quadrant | BADHDUFLAG | Total packets | Discarded packets |
| A | 0 | 84375 | 0 |
| B | 0 | 29638 | 0 |
| C | 0 | 24847 | 0 |
| D | 0 | 29547 | 0 |
| Quadrant | Total seconds | Saturated seconds | Saturation percentage |
|---|---|---|---|
| A | 11845 | 11700 | 98.775855% |
| B | 11845 | 562 | 4.744618% |
| C | 11846 | 150 | 1.266250% |
| D | 11846 | 258 | 2.177950% |
Noise dominated data is calculated using 1-second bins in cleaned event files. If a bin has >2000 counts, and if more than 50% of those come from <1% of pixels, then it is considered to be noise-dominated and hence unusable.
| Quadrant | # 1 sec bins | Bins with >0 counts | Bins with >2000 counts | High rate bins dominated by noise | Noise dominated (total time) | Noise dominated (detector-on time) | Marked lightcurve |
|---|---|---|---|---|---|---|---|
| A | 13094 | 11844 | 8246 | 8246 | 62.98% | 69.62% | 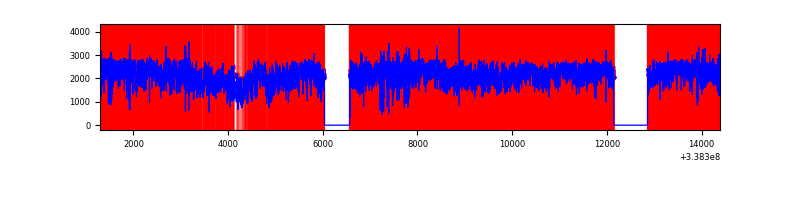 |
| B | 13095 | 11846 | 337 | 337 | 2.57% | 2.84% | 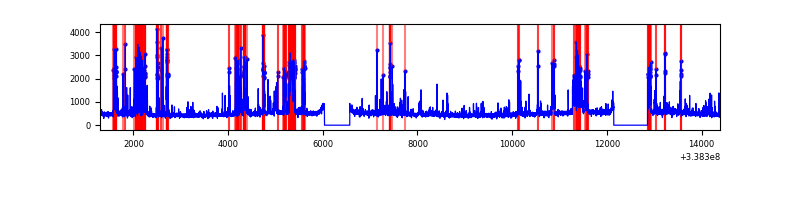 |
| C | 13096 | 11848 | 8 | 8 | 0.06% | 0.07% | 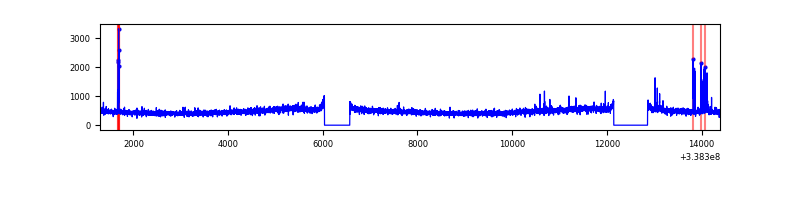 |
| D | 13096 | 11847 | 240 | 240 | 1.83% | 2.03% | 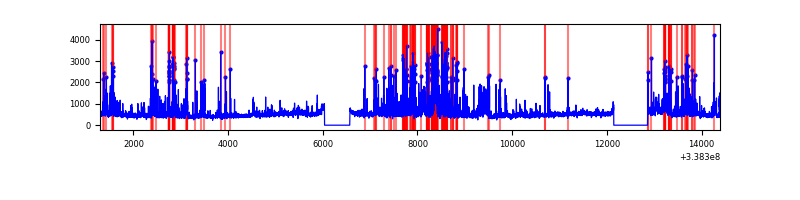 |
Top three noisy pixels from each quadrant. If the there are fewer than three noisy pixels in the level2.evt file, extra rows are filled as -1
| Pixel properties | Quadrant properties | ||||||
|---|---|---|---|---|---|---|---|
| Quadrant | DetID | PixID | Counts | Sigma | Mean | Median | Sigma |
| A | 14 | 235 | 24606241 | 493734.71 | 242 | 237 | 49.8 |
| A | 0 | 13 | 125434 | 2512.16 | 242 | 237 | 49.8 |
| A | 8 | 192 | 16801 | 332.37 | 242 | 237 | 49.8 |
| B | 0 | 189 | 1407995 | 5274.21 | 1409 | 1374 | 266.7 |
| B | 10 | 246 | 174569 | 649.41 | 1409 | 1374 | 266.7 |
| B | 3 | 64 | 133340 | 494.81 | 1409 | 1374 | 266.7 |
| C | 14 | 238 | 216287 | 669.68 | 1368 | 1380 | 320.9 |
| C | 2 | 16 | 140629 | 433.92 | 1368 | 1380 | 320.9 |
| C | 0 | 207 | 38477 | 115.6 | 1368 | 1380 | 320.9 |
| D | 2 | 250 | 874248 | 2385.15 | 1362 | 1337 | 366.0 |
| D | 7 | 80 | 526245 | 1434.26 | 1362 | 1337 | 366.0 |
| D | 1 | 52 | 290428 | 789.92 | 1362 | 1337 | 366.0 |
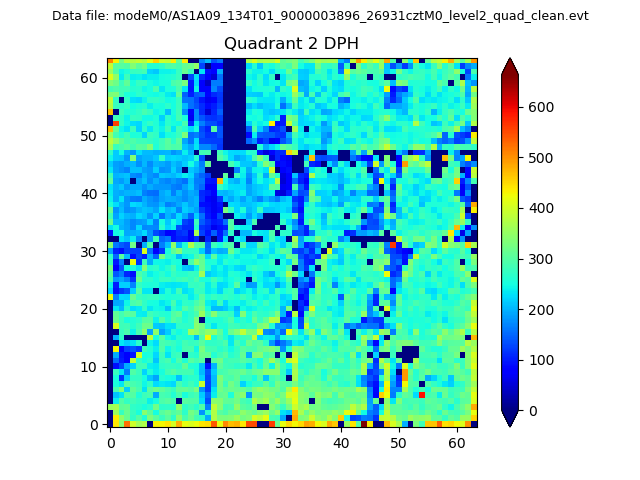
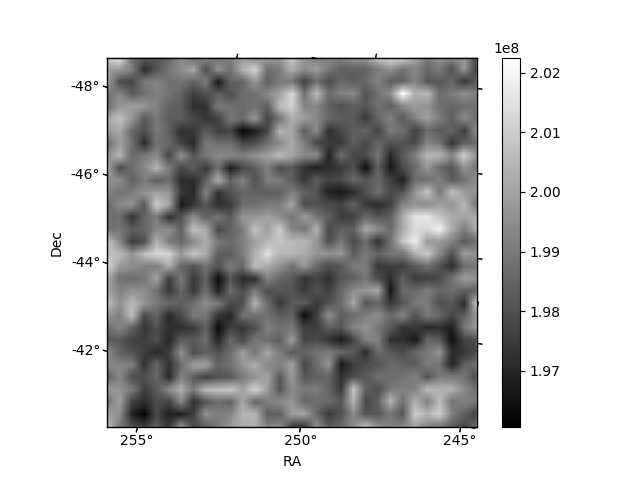
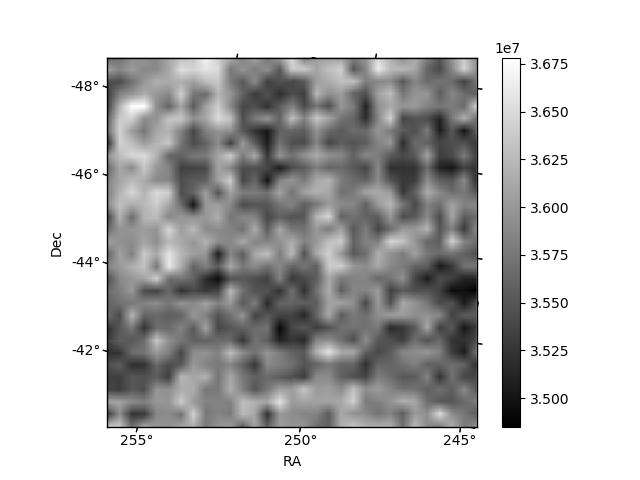
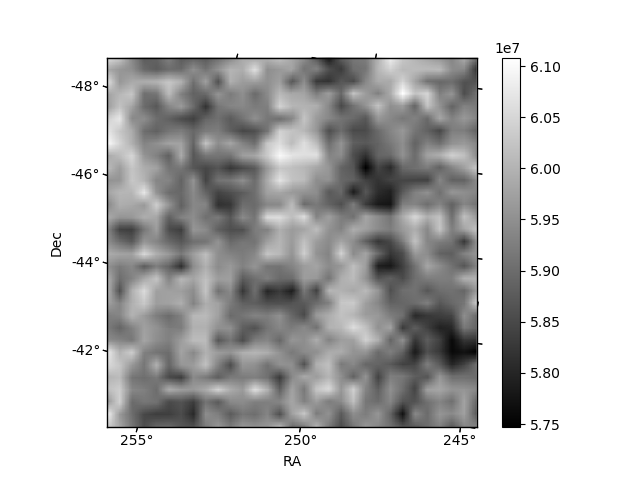
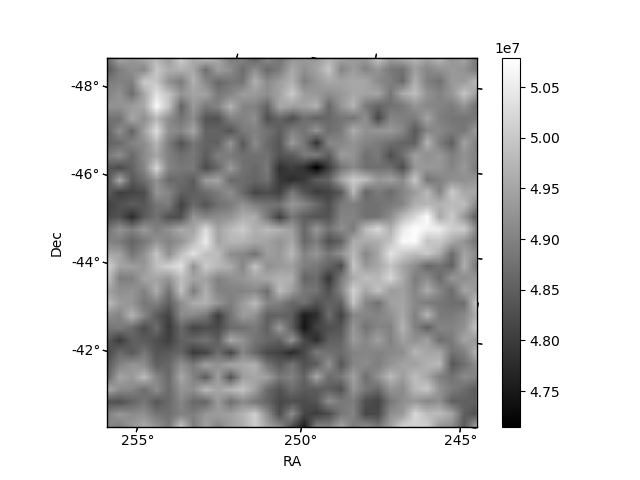
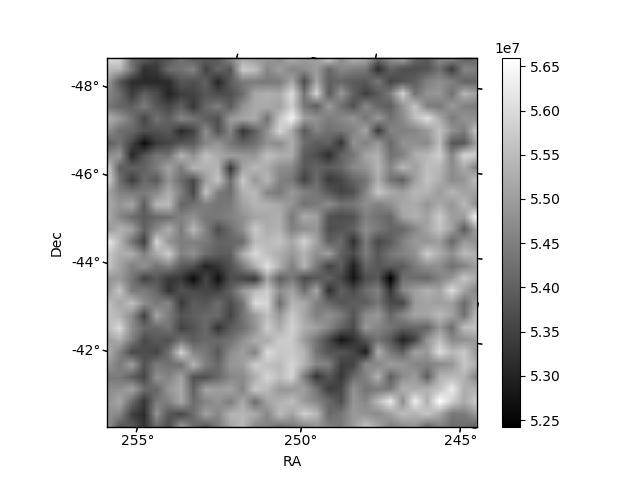
Histogram calculated using DETX and DETY for each event in the final _common_clean file
| Quadrant A | 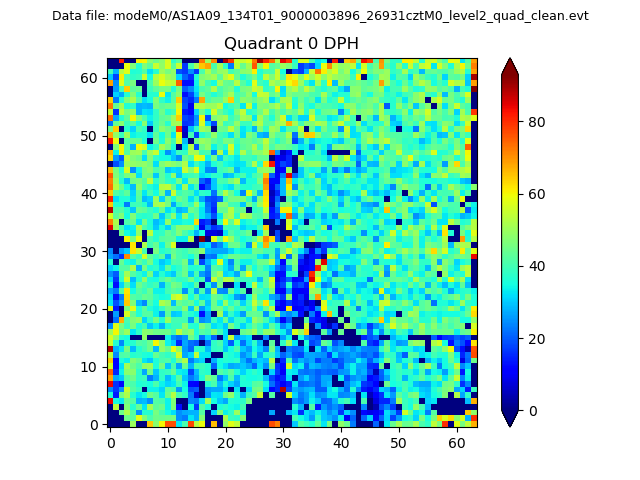 |
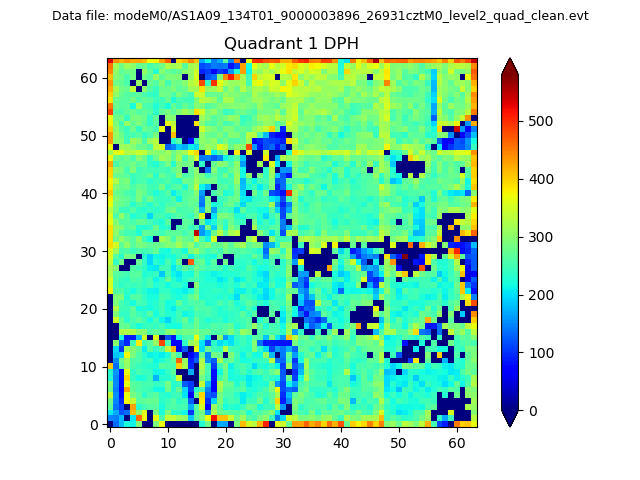 |
Quadrant B |
|---|---|---|---|
| Quadrant D | 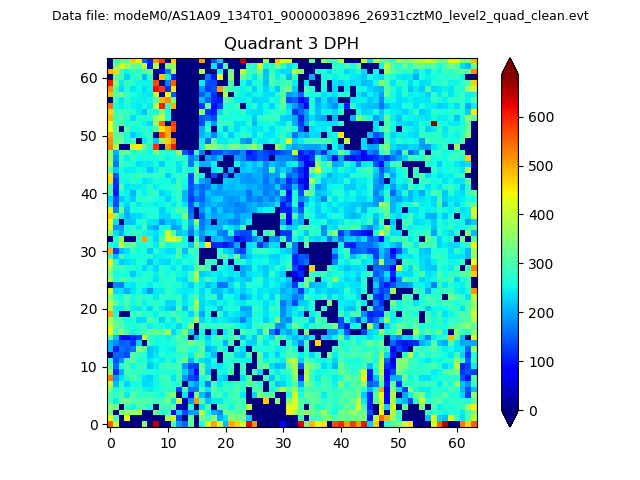 |
 |
Quadrant C |
| Plot type | Count rate plots | Images |
|---|---|---|
| Comparison with Poisson distribution Blue bars denote a histogram of data divided into 1 sec bins. Red curve is a Poisson curve with rate = median count rate of data. |
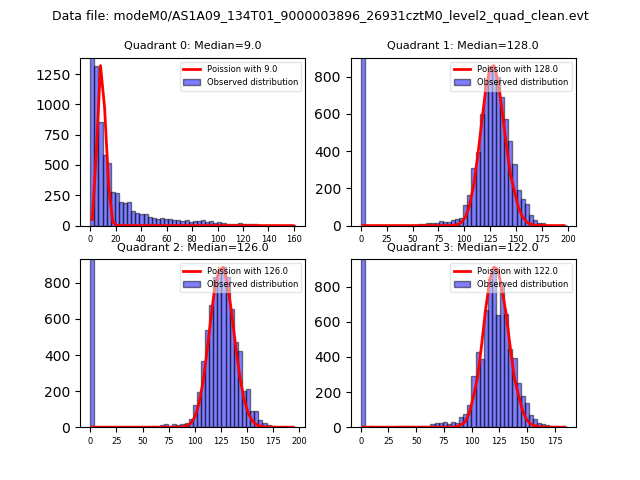 |
 |
| Quadrant-wise count rates Data is divided into 100 sec bins |
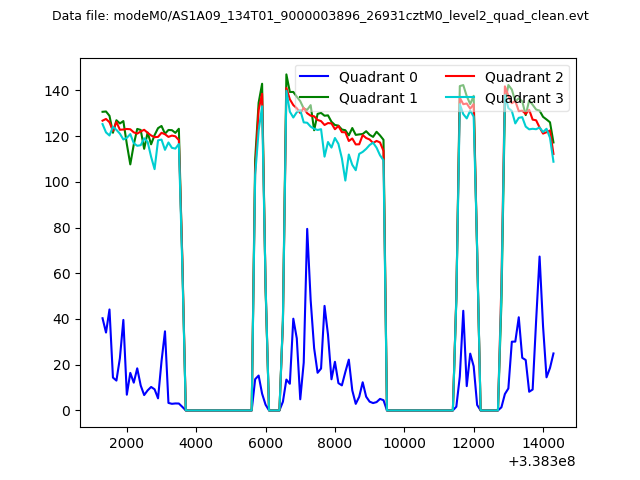 |
|
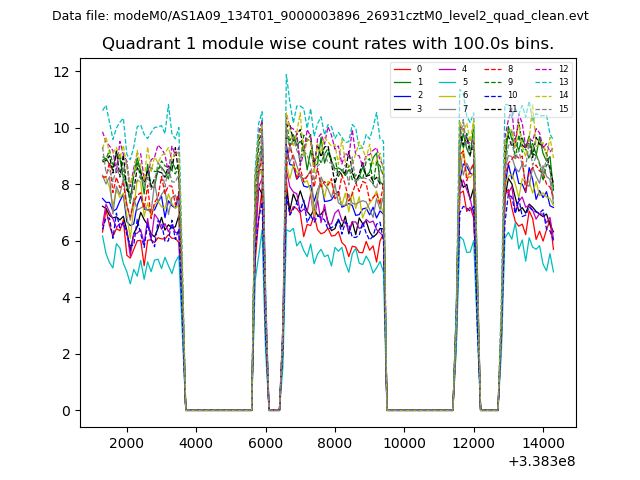
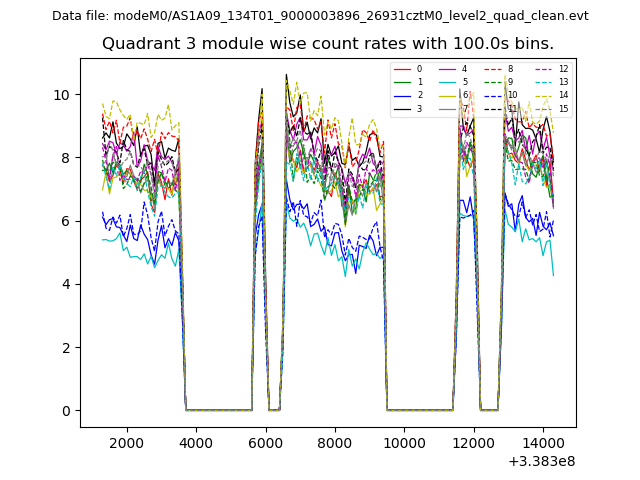
| Module-wise count rates for Quadrant A Data is divided into 100 sec bins |
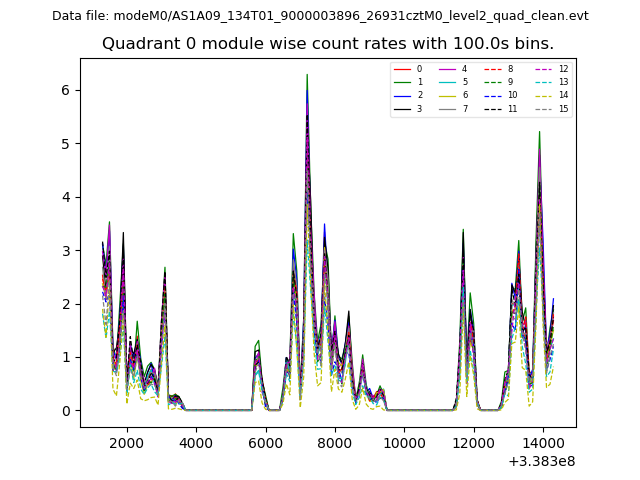 |
 |
| Module-wise count rates for Quadrant B Data is divided into 100 sec bins |
 |
 |
| Module-wise count rates for Quadrant C Data is divided into 100 sec bins |
 |
 |
| Module-wise count rates for Quadrant D Data is divided into 100 sec bins |
 |
 |
| Parameter | Plot |
|---|---|
| CZT HV Monitor | 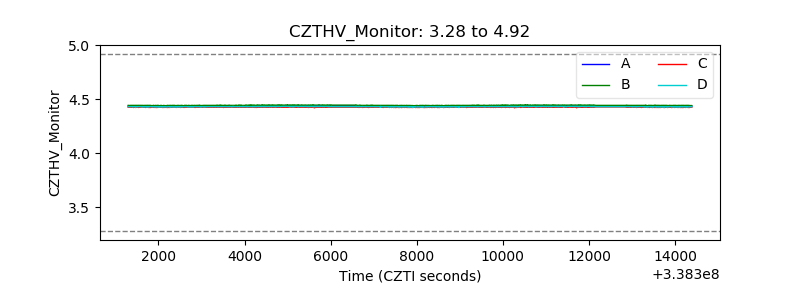 |
| D_VDD | 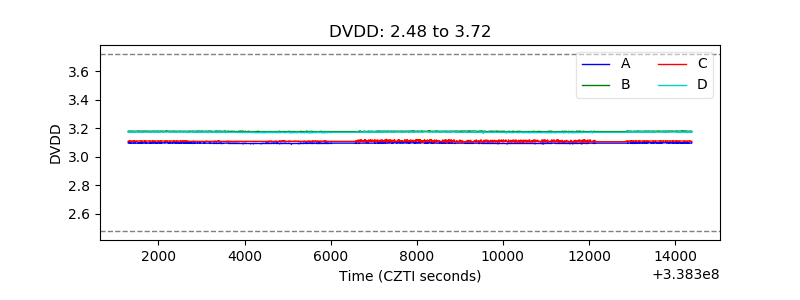 |
| Temperature 1 | 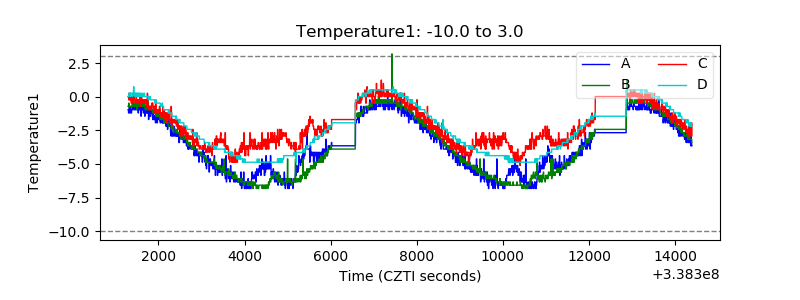 |
| Veto HV Monitor | 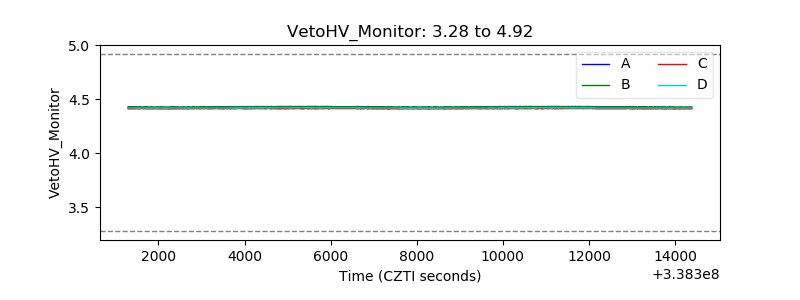 |
| Veto LLD | 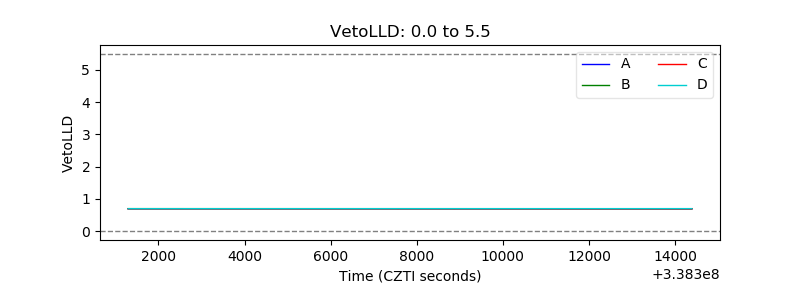 |
| Alpha Counter | 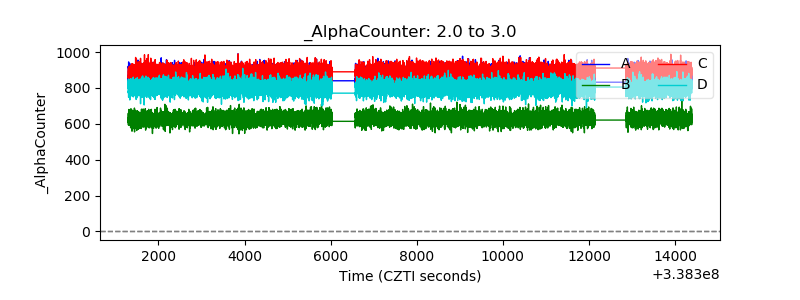 |
| _CPM_Rate | 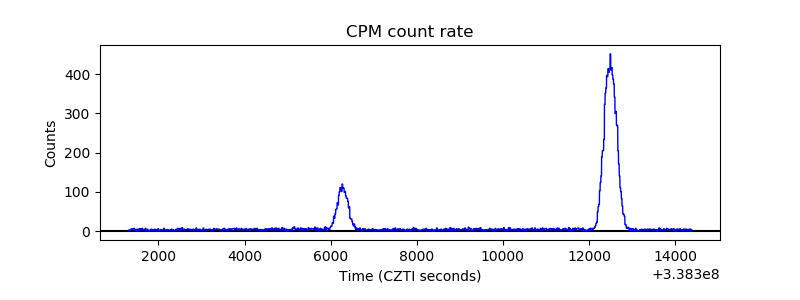 |
| CZT Counter | 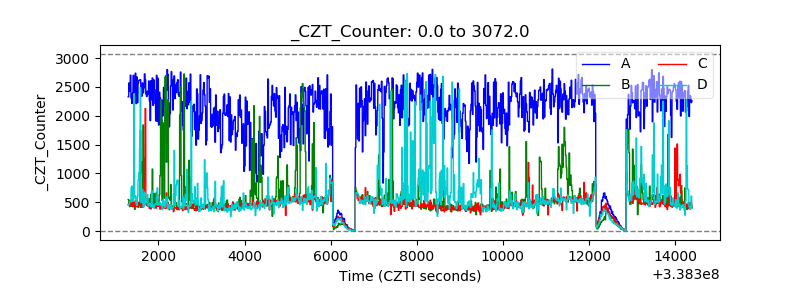 |
| +2.5 Volts monitor | 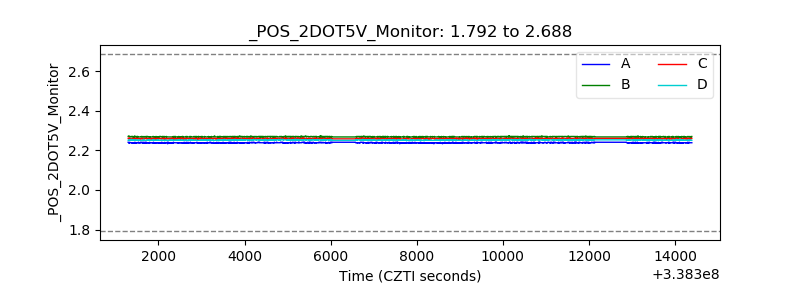 |
| +5 Volts monitor |  |
| _ROLL_ROT | 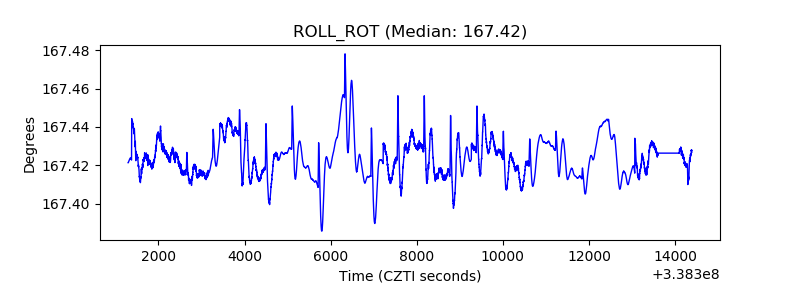 |
| _Roll_DEC | 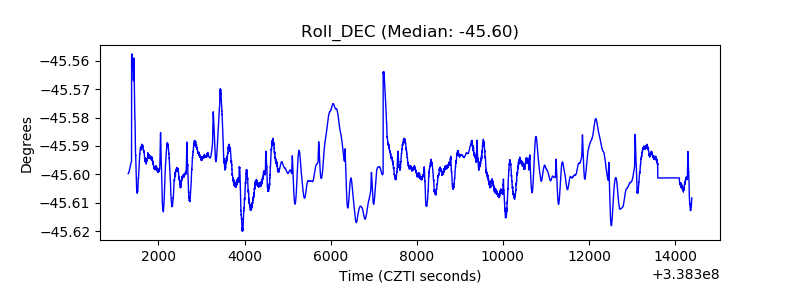 |
| _Roll_RA | 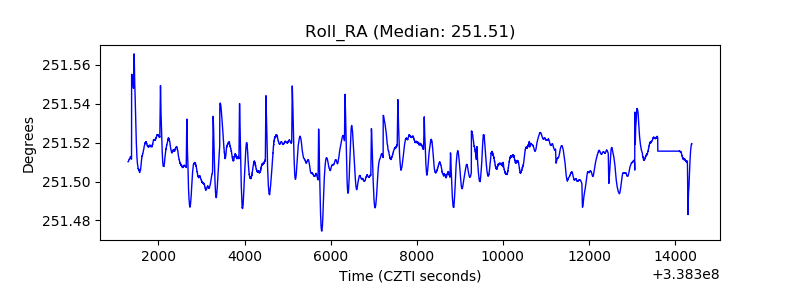 |
| Veto Counter | 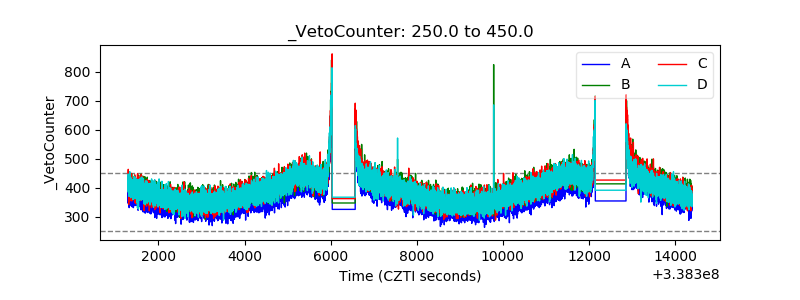 |