| Param | Original file | Final file |
|---|---|---|
| Filename | modeM0/AS1A09_134T01_9000003896_26932cztM0_level2.evt | modeM0/AS1A09_134T01_9000003896_26932cztM0_level2_quad_clean.evt |
| Size (bytes) | 587,992,320 | 82,581,120 |
| Size | 560.8 MB | 78.8 MB |
| Events in quadrant A | 7,127,568 | 420,148 |
| Events in quadrant B | 3,498,677 | 562,971 |
| Events in quadrant C | 3,078,550 | 546,609 |
| Events in quadrant D | 3,676,127 | 531,337 |
| Mode M9 | |||
|---|---|---|---|
| Quadrant | BADHDUFLAG | Total packets | Discarded packets |
| A | 0 | 9 | 0 |
| B | 0 | 9 | 0 |
| C | 0 | 9 | 0 |
| D | 0 | 9 | 0 |
| Mode M0 | |||
|---|---|---|---|
| Quadrant | BADHDUFLAG | Total packets | Discarded packets |
| A | 0 | 25309 | 0 |
| B | 0 | 14494 | 0 |
| C | 0 | 13191 | 0 |
| D | 0 | 15208 | 0 |
| Quadrant | Total seconds | Saturated seconds | Saturation percentage |
|---|---|---|---|
| A | 6286 | 1651 | 26.264715% |
| B | 6287 | 107 | 1.701925% |
| C | 6288 | 48 | 0.763359% |
| D | 6286 | 75 | 1.193128% |
Noise dominated data is calculated using 1-second bins in cleaned event files. If a bin has >2000 counts, and if more than 50% of those come from <1% of pixels, then it is considered to be noise-dominated and hence unusable.
| Quadrant | # 1 sec bins | Bins with >0 counts | Bins with >2000 counts | High rate bins dominated by noise | Noise dominated (total time) | Noise dominated (detector-on time) | Marked lightcurve |
|---|---|---|---|---|---|---|---|
| A | 7187 | 6287 | 1416 | 1416 | 19.70% | 22.52% | 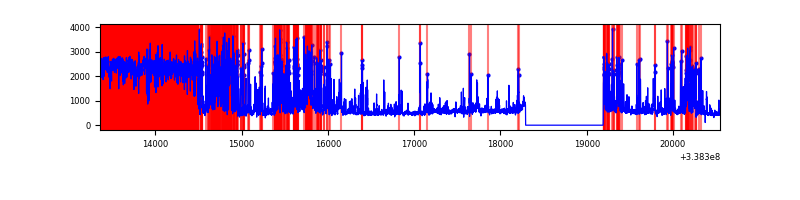 |
| B | 7187 | 6287 | 51 | 51 | 0.71% | 0.81% | 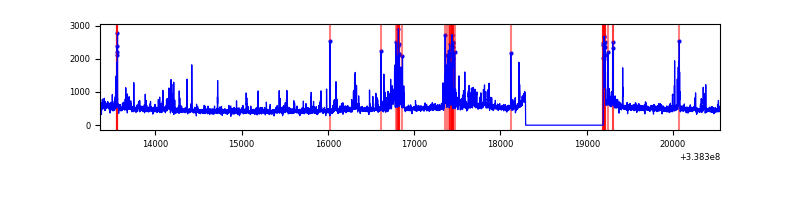 |
| C | 7188 | 6289 | 4 | 4 | 0.06% | 0.06% | 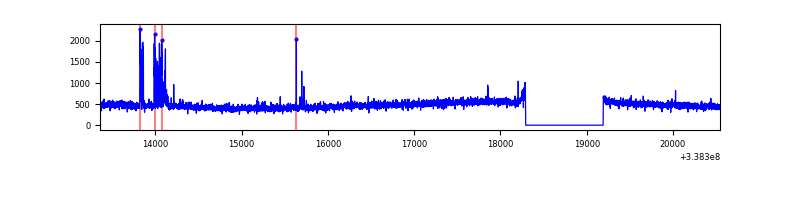 |
| D | 7187 | 6288 | 55 | 55 | 0.77% | 0.87% | 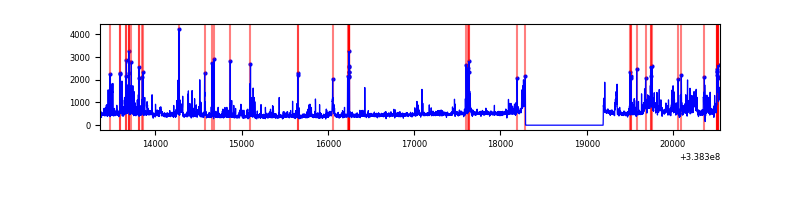 |
Top three noisy pixels from each quadrant. If the there are fewer than three noisy pixels in the level2.evt file, extra rows are filled as -1
| Pixel properties | Quadrant properties | ||||||
|---|---|---|---|---|---|---|---|
| Quadrant | DetID | PixID | Counts | Sigma | Mean | Median | Sigma |
| A | 14 | 235 | 4413984 | 33974.83 | 638 | 625 | 129.9 |
| A | 0 | 13 | 181407 | 1391.69 | 638 | 625 | 129.9 |
| A | 6 | 16 | 25924 | 194.76 | 638 | 625 | 129.9 |
| B | 0 | 189 | 268784 | 1848.05 | 755 | 736 | 145.0 |
| B | 10 | 245 | 135679 | 930.36 | 755 | 736 | 145.0 |
| B | 10 | 246 | 61012 | 415.57 | 755 | 736 | 145.0 |
| C | 2 | 16 | 126516 | 729.14 | 726 | 729 | 172.5 |
| C | 14 | 238 | 114491 | 659.44 | 726 | 729 | 172.5 |
| C | 15 | 208 | 9601 | 51.43 | 726 | 729 | 172.5 |
| D | 7 | 80 | 409447 | 2145.71 | 723 | 706 | 190.5 |
| D | 2 | 250 | 207956 | 1087.97 | 723 | 706 | 190.5 |
| D | 11 | 176 | 112647 | 587.64 | 723 | 706 | 190.5 |
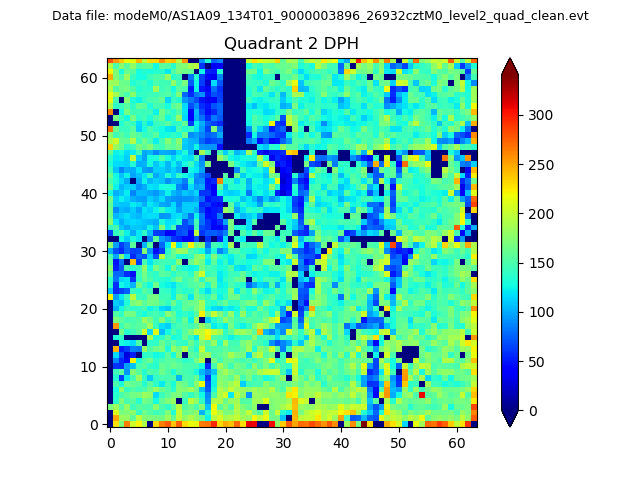
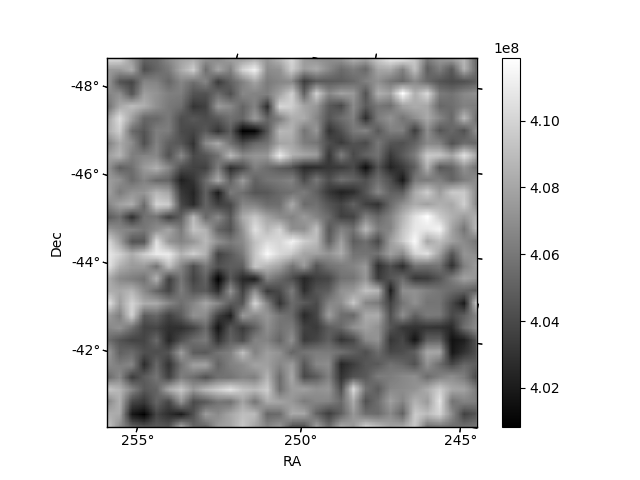
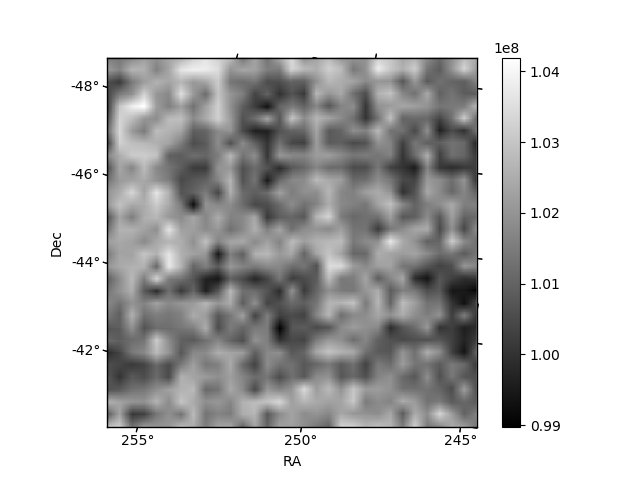
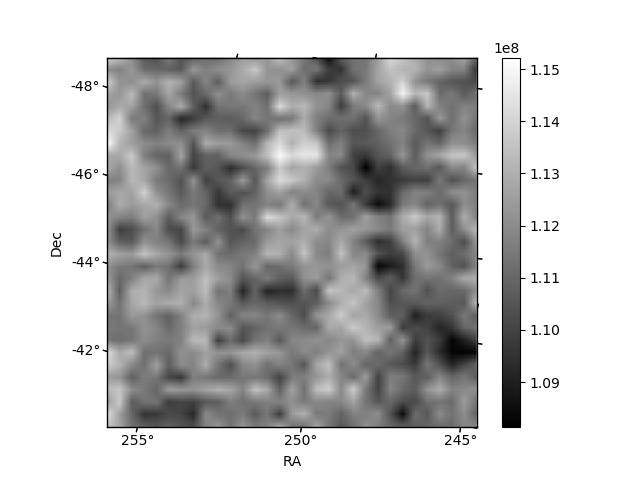
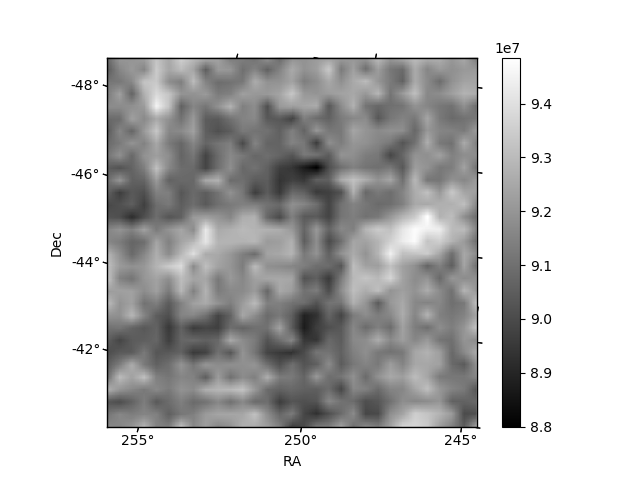
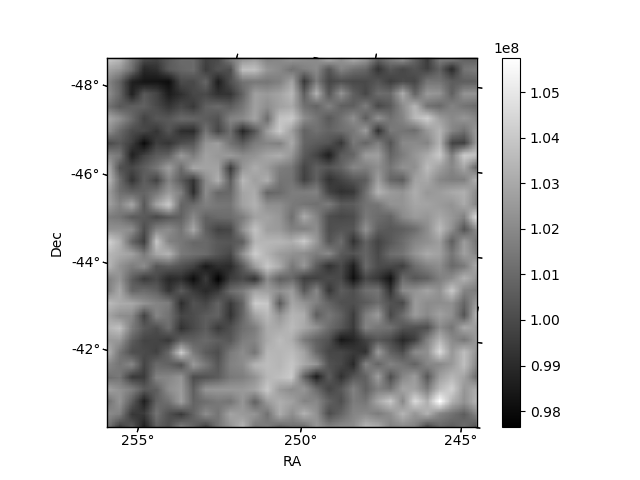
Histogram calculated using DETX and DETY for each event in the final _common_clean file
| Quadrant A | 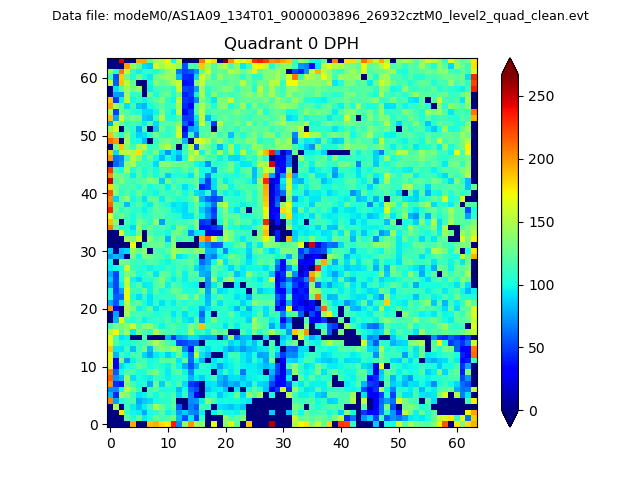 |
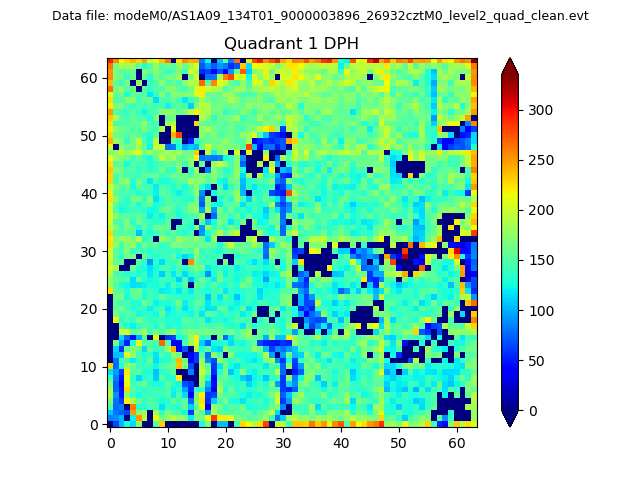 |
Quadrant B |
|---|---|---|---|
| Quadrant D | 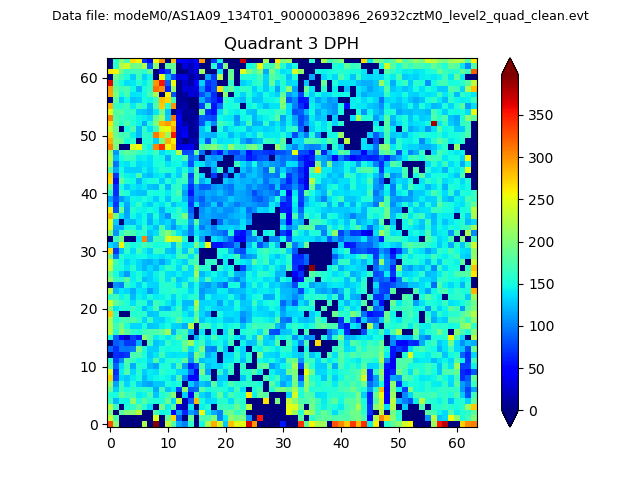 |
 |
Quadrant C |
| Plot type | Count rate plots | Images |
|---|---|---|
| Comparison with Poisson distribution Blue bars denote a histogram of data divided into 1 sec bins. Red curve is a Poisson curve with rate = median count rate of data. |
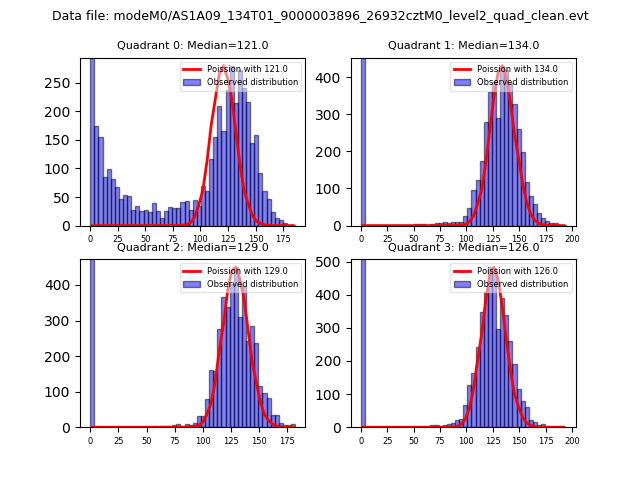 |
 |
| Quadrant-wise count rates Data is divided into 100 sec bins |
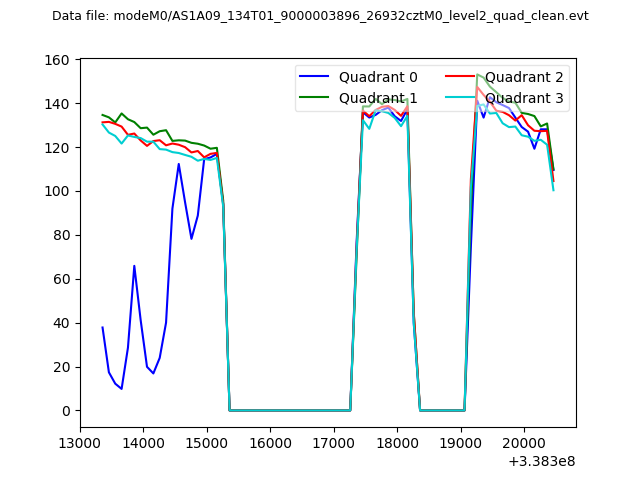 |
|
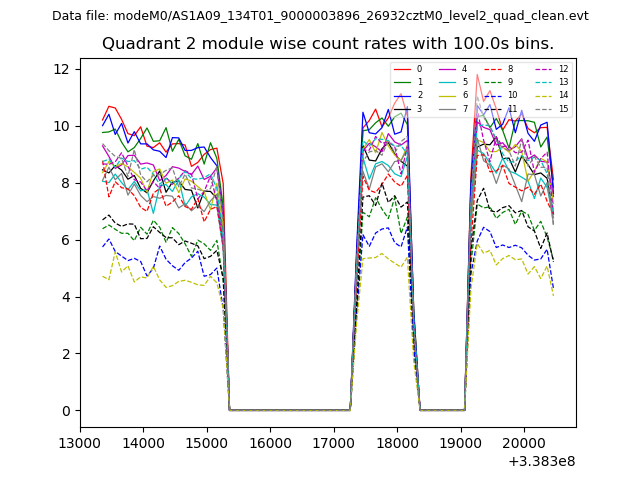
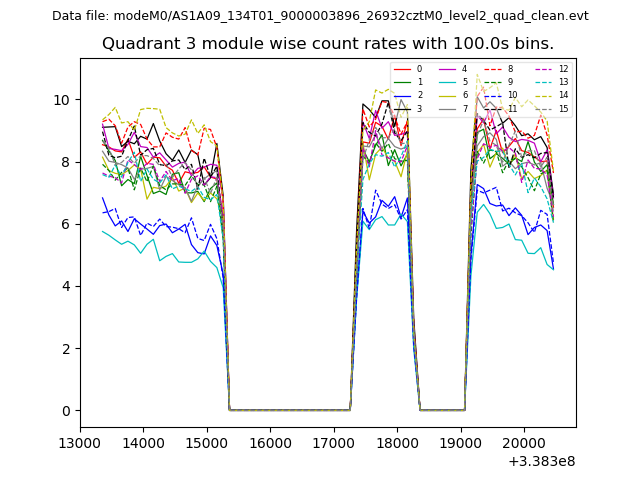
| Module-wise count rates for Quadrant A Data is divided into 100 sec bins |
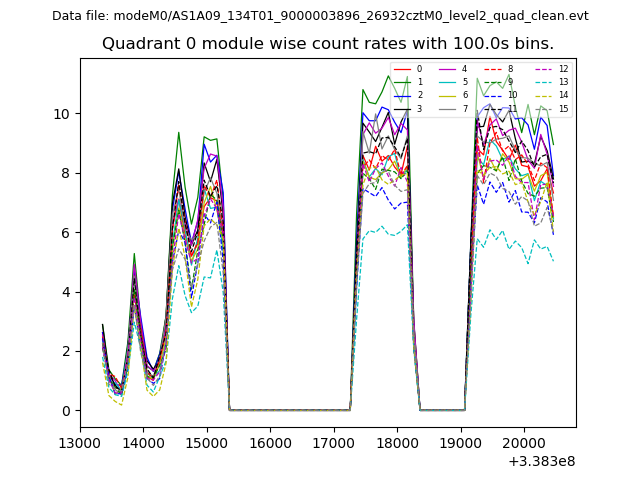 |
 |
| Module-wise count rates for Quadrant B Data is divided into 100 sec bins |
 |
 |
| Module-wise count rates for Quadrant C Data is divided into 100 sec bins |
 |
 |
| Module-wise count rates for Quadrant D Data is divided into 100 sec bins |
 |
 |
| Parameter | Plot |
|---|---|
| CZT HV Monitor | 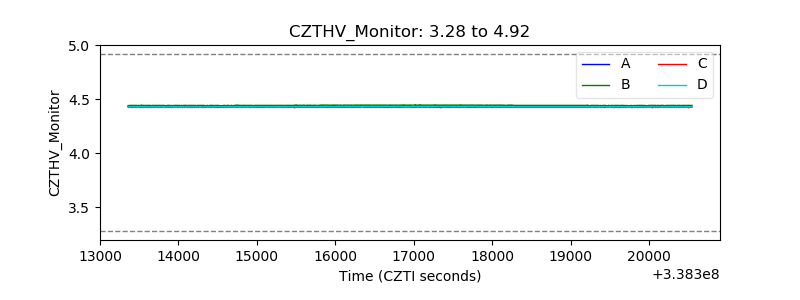 |
| D_VDD | 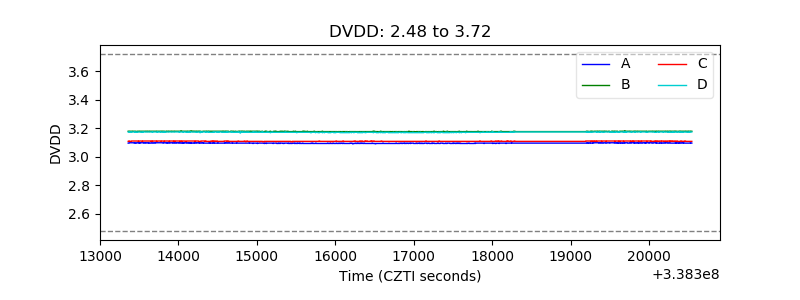 |
| Temperature 1 | 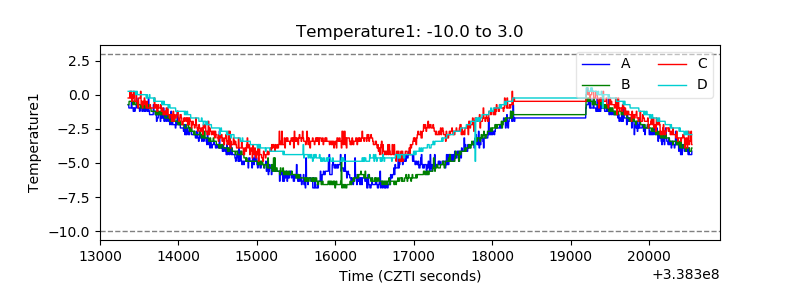 |
| Veto HV Monitor |  |
| Veto LLD | 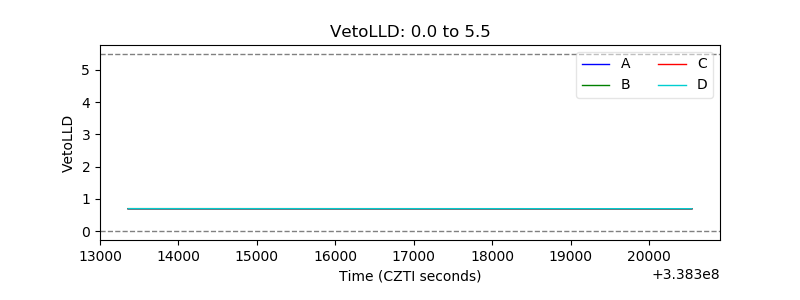 |
| Alpha Counter | 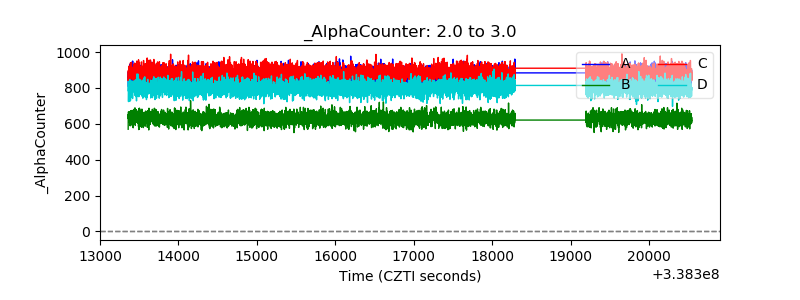 |
| _CPM_Rate | 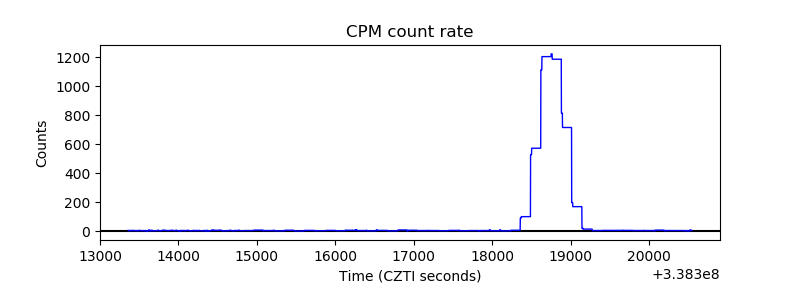 |
| CZT Counter | 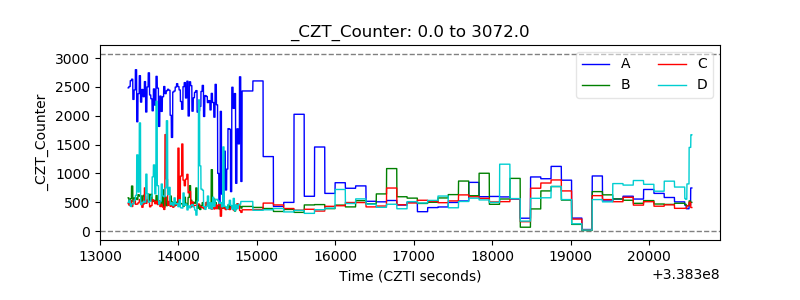 |
| +2.5 Volts monitor |  |
| +5 Volts monitor | 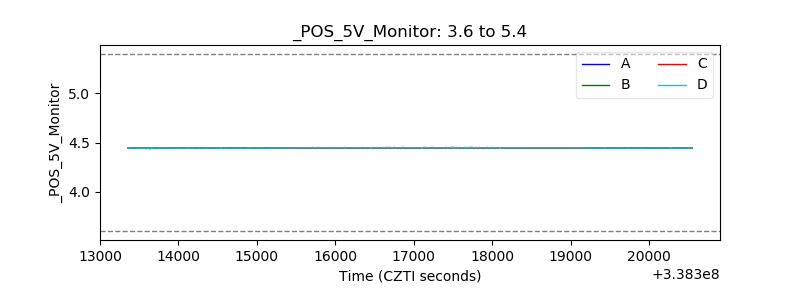 |
| _ROLL_ROT | 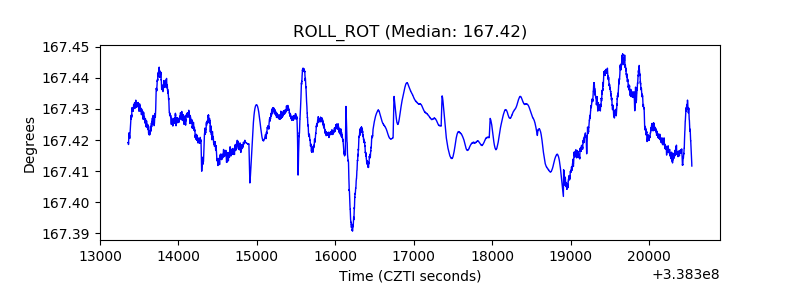 |
| _Roll_DEC | 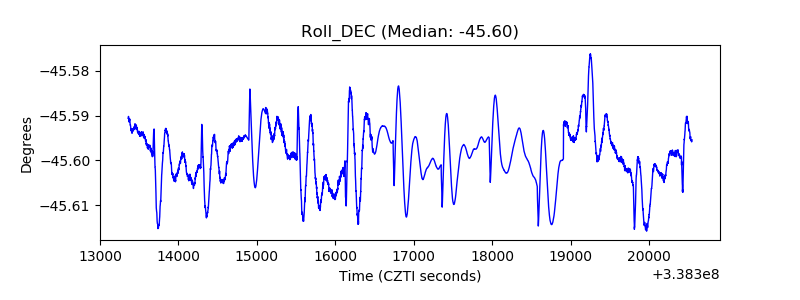 |
| _Roll_RA | 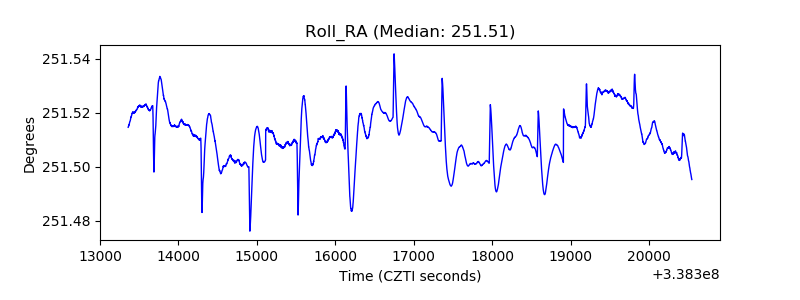 |
| Veto Counter |  |