| Param | Original file | Final file |
|---|---|---|
| Filename | modeM0/AS1A09_134T01_9000003896_26933cztM0_level2.evt | modeM0/AS1A09_134T01_9000003896_26933cztM0_level2_quad_clean.evt |
| Size (bytes) | 567,040,320 | 94,253,760 |
| Size | 540.8 MB | 89.9 MB |
| Events in quadrant A | 4,843,996 | 593,210 |
| Events in quadrant B | 3,960,595 | 620,832 |
| Events in quadrant C | 3,151,266 | 608,603 |
| Events in quadrant D | 4,773,928 | 575,301 |
| Mode M9 | |||
|---|---|---|---|
| Quadrant | BADHDUFLAG | Total packets | Discarded packets |
| A | 0 | 13 | 0 |
| B | 0 | 14 | 0 |
| C | 0 | 14 | 0 |
| D | 0 | 14 | 0 |
| Mode M0 | |||
|---|---|---|---|
| Quadrant | BADHDUFLAG | Total packets | Discarded packets |
| A | 0 | 18747 | 0 |
| B | 0 | 16051 | 0 |
| C | 0 | 13471 | 0 |
| D | 0 | 18670 | 0 |
| Quadrant | Total seconds | Saturated seconds | Saturation percentage |
|---|---|---|---|
| A | 6543 | 469 | 7.167966% |
| B | 6544 | 182 | 2.781174% |
| C | 6544 | 36 | 0.550122% |
| D | 6543 | 172 | 2.628764% |
Noise dominated data is calculated using 1-second bins in cleaned event files. If a bin has >2000 counts, and if more than 50% of those come from <1% of pixels, then it is considered to be noise-dominated and hence unusable.
| Quadrant | # 1 sec bins | Bins with >0 counts | Bins with >2000 counts | High rate bins dominated by noise | Noise dominated (total time) | Noise dominated (detector-on time) | Marked lightcurve |
|---|---|---|---|---|---|---|---|
| A | 7599 | 6545 | 312 | 312 | 4.11% | 4.77% | 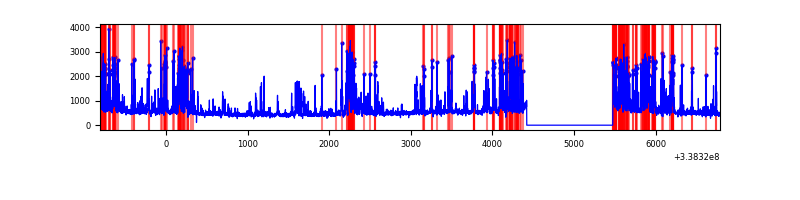 |
| B | 7599 | 6545 | 131 | 131 | 1.72% | 2.00% | 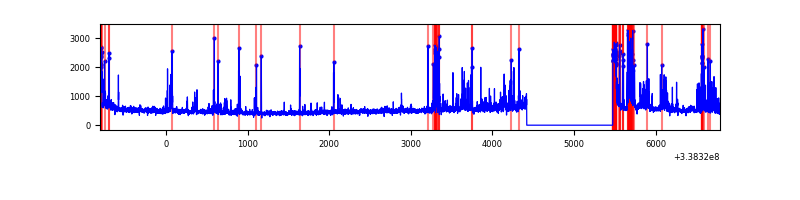 |
| C | 7599 | 6545 | 1 | 1 | 0.01% | 0.02% | 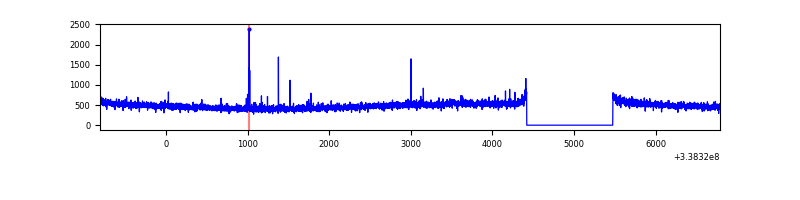 |
| D | 7599 | 6544 | 166 | 166 | 2.18% | 2.54% | 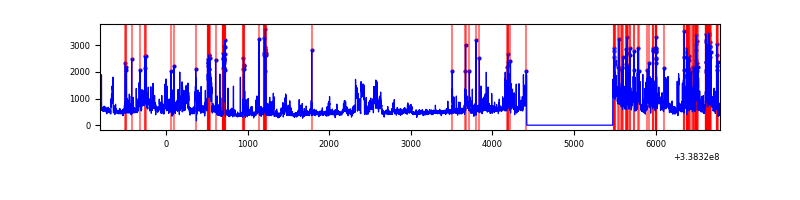 |
Top three noisy pixels from each quadrant. If the there are fewer than three noisy pixels in the level2.evt file, extra rows are filled as -1
| Pixel properties | Quadrant properties | ||||||
|---|---|---|---|---|---|---|---|
| Quadrant | DetID | PixID | Counts | Sigma | Mean | Median | Sigma |
| A | 14 | 235 | 1683744 | 10634.16 | 783 | 769 | 158.3 |
| A | 0 | 13 | 63052 | 393.55 | 783 | 769 | 158.3 |
| A | 8 | 192 | 43132 | 267.68 | 783 | 769 | 158.3 |
| B | 10 | 245 | 375352 | 2481.72 | 797 | 778 | 150.9 |
| B | 0 | 189 | 342005 | 2260.78 | 797 | 778 | 150.9 |
| B | 0 | 229 | 29220 | 188.44 | 797 | 778 | 150.9 |
| C | 14 | 238 | 121933 | 661.31 | 770 | 774 | 183.2 |
| C | 15 | 208 | 19330 | 101.28 | 770 | 774 | 183.2 |
| C | 13 | 61 | 5334 | 24.89 | 770 | 774 | 183.2 |
| D | 7 | 80 | 1011113 | 5244.01 | 759 | 740 | 192.7 |
| D | 2 | 250 | 323832 | 1676.9 | 759 | 740 | 192.7 |
| D | 1 | 52 | 263027 | 1361.31 | 759 | 740 | 192.7 |
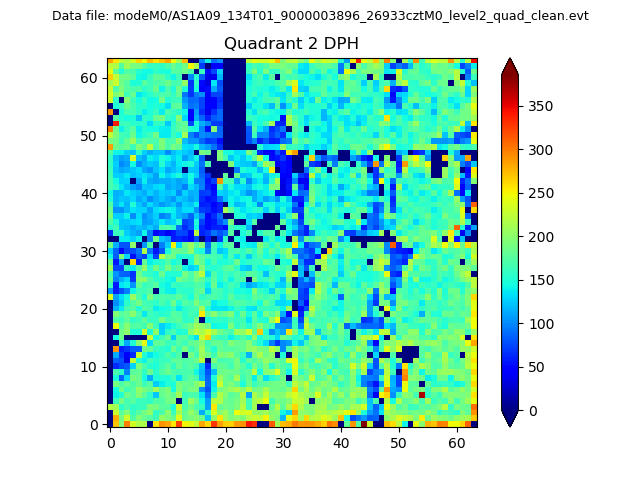
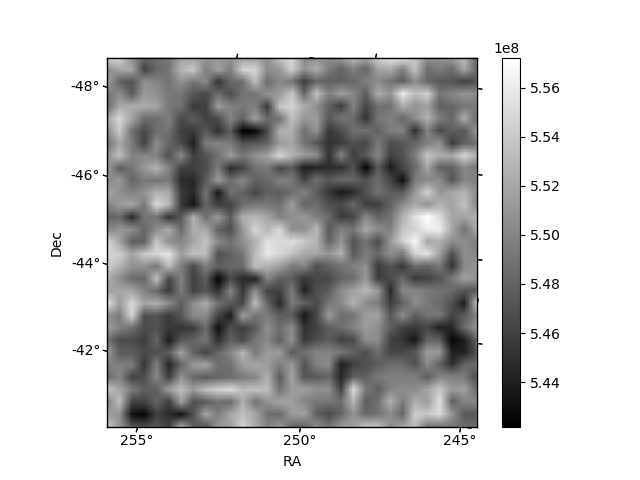
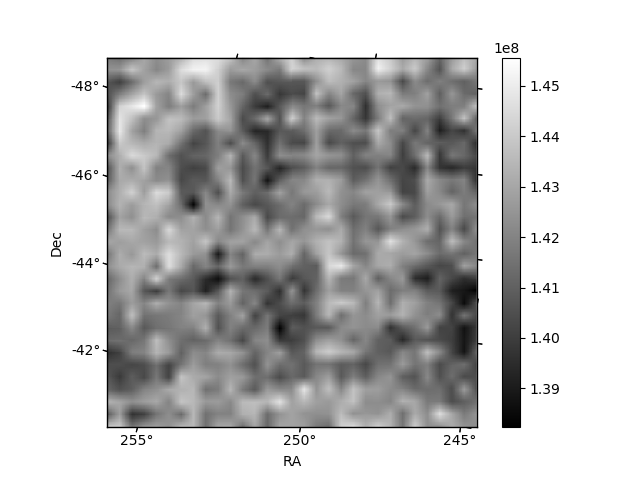
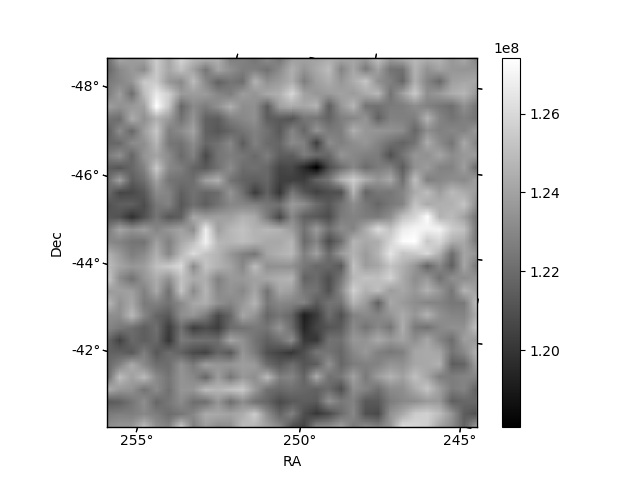
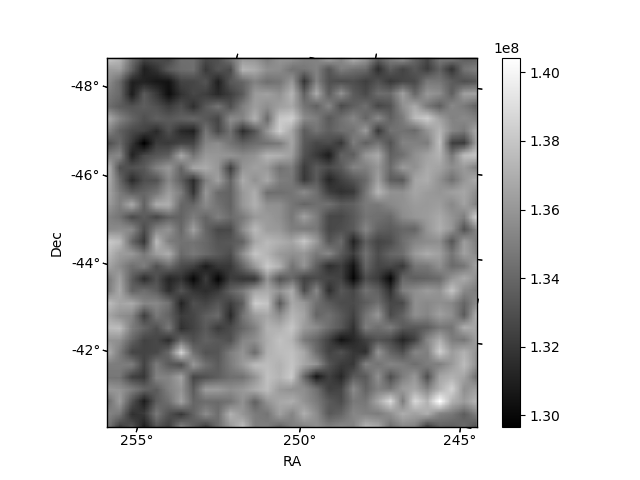
Histogram calculated using DETX and DETY for each event in the final _common_clean file
| Quadrant A | 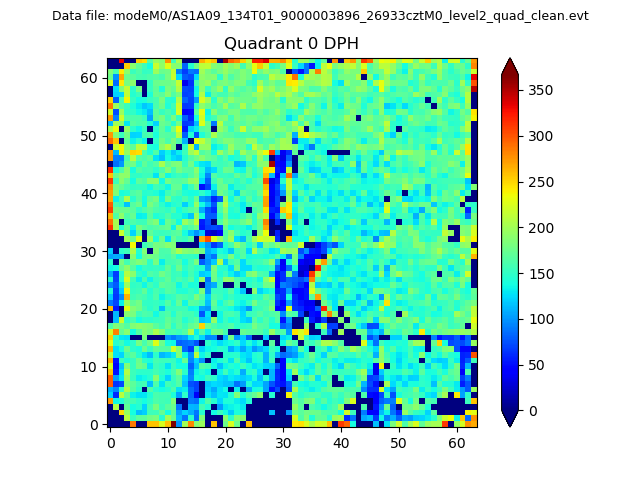 |
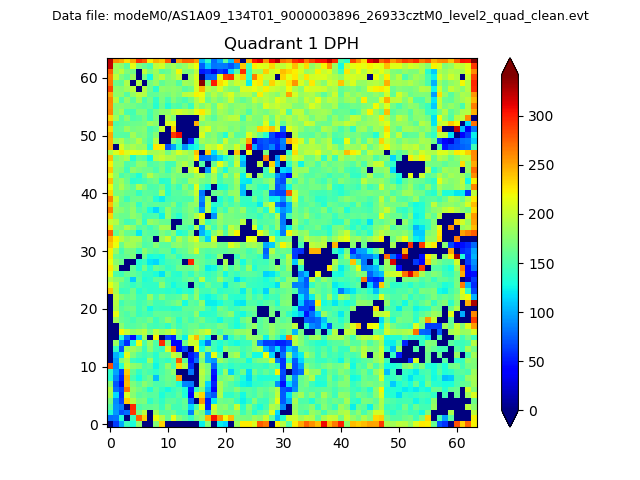 |
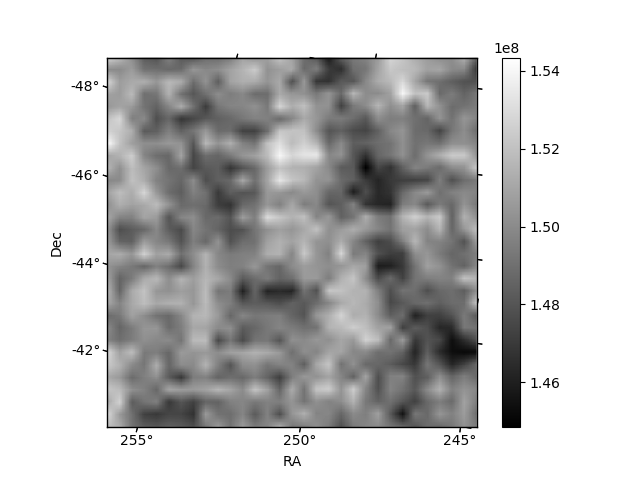
Quadrant B |
|---|---|---|---|
| Quadrant D | 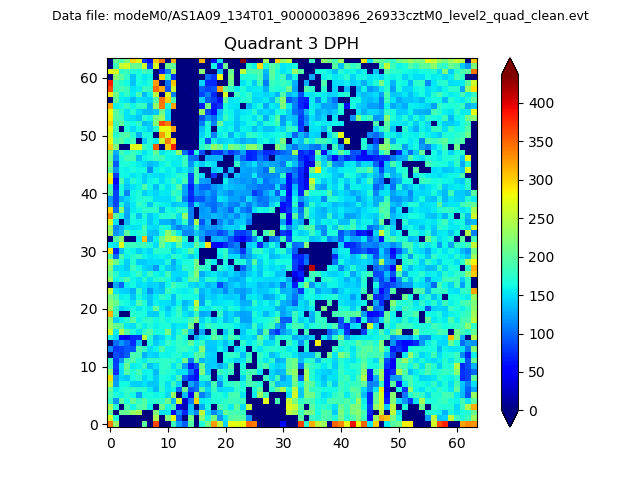 |
 |
Quadrant C |
| Plot type | Count rate plots | Images |
|---|---|---|
| Comparison with Poisson distribution Blue bars denote a histogram of data divided into 1 sec bins. Red curve is a Poisson curve with rate = median count rate of data. |
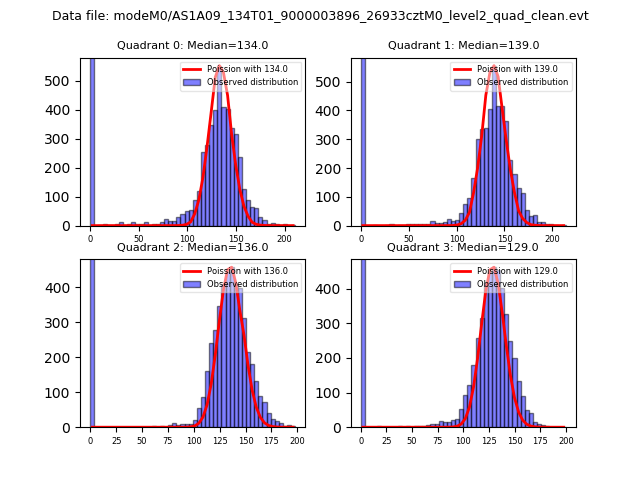 |
 |
| Quadrant-wise count rates Data is divided into 100 sec bins |
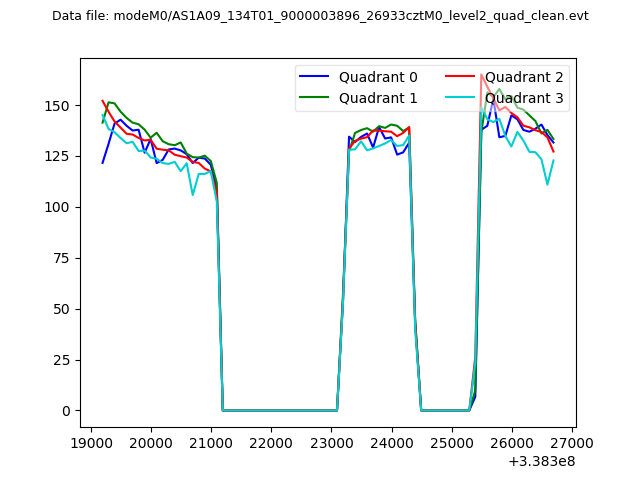 |
|
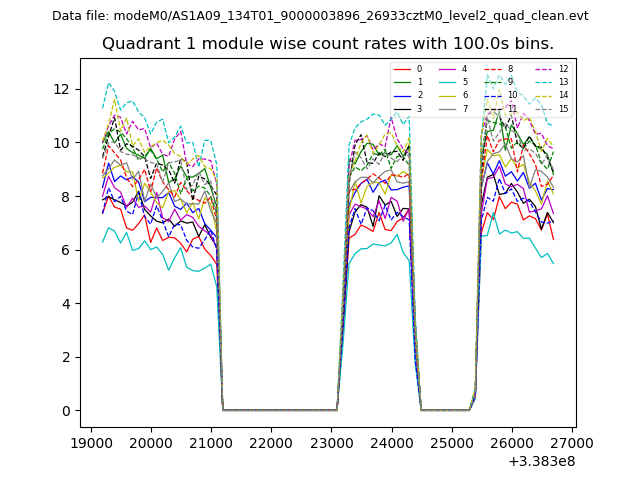
| Module-wise count rates for Quadrant A Data is divided into 100 sec bins |
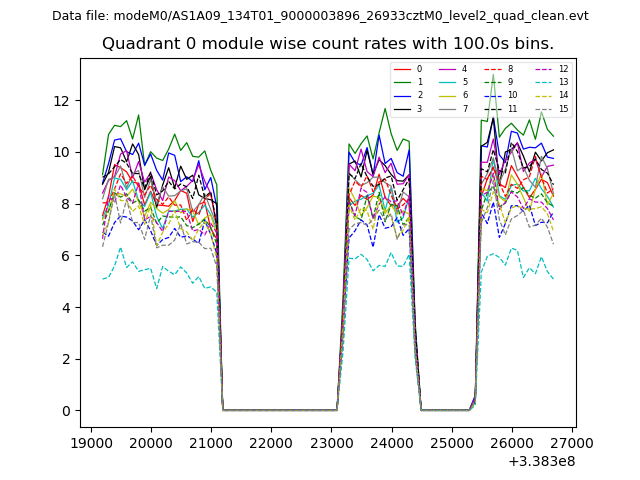 |
 |
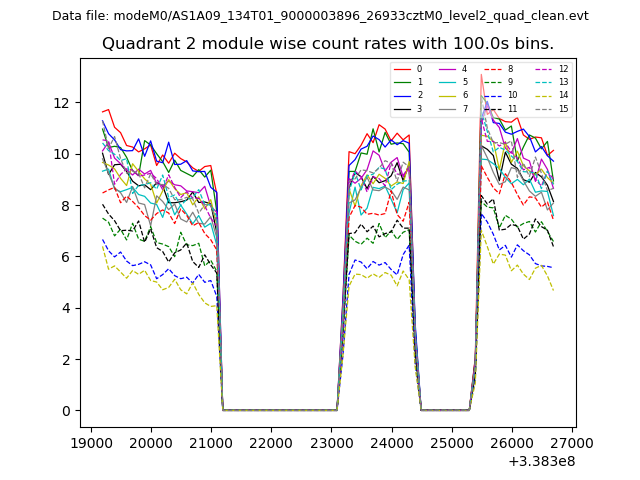
| Module-wise count rates for Quadrant B Data is divided into 100 sec bins |
 |
 |
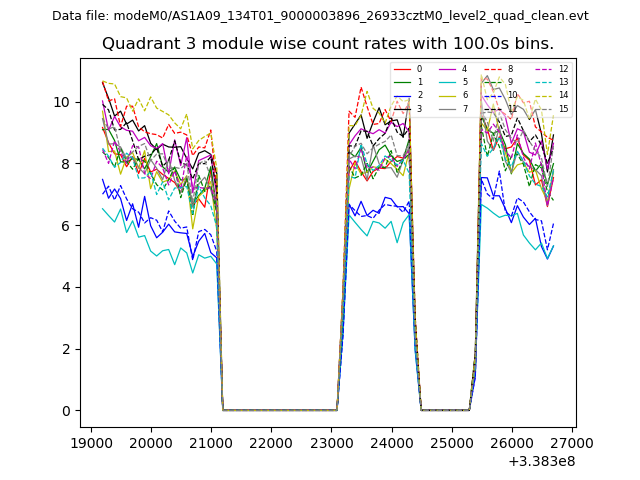
| Module-wise count rates for Quadrant C Data is divided into 100 sec bins |
 |
 |
| Module-wise count rates for Quadrant D Data is divided into 100 sec bins |
 |
 |
| Parameter | Plot |
|---|---|
| CZT HV Monitor | 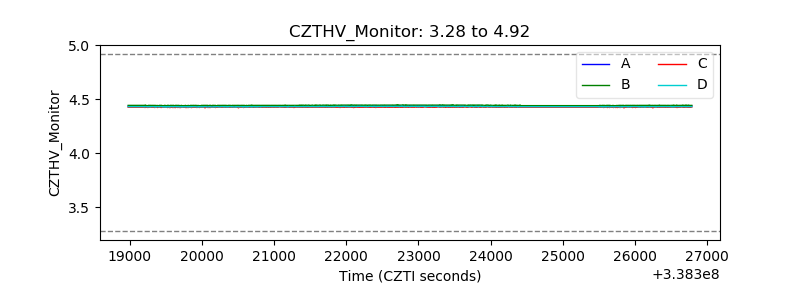 |
| D_VDD | 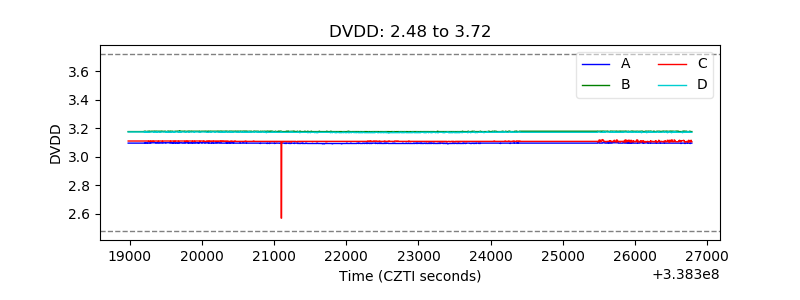 |
| Temperature 1 | 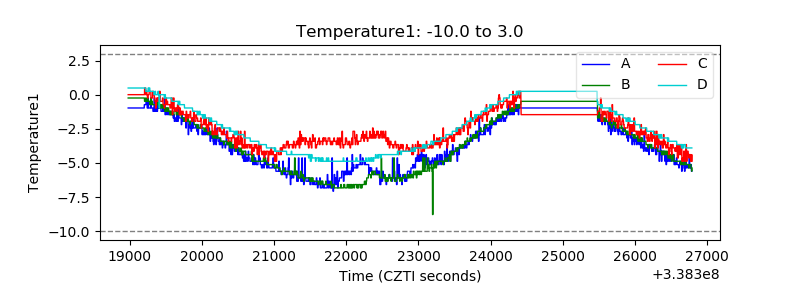 |
| Veto HV Monitor | 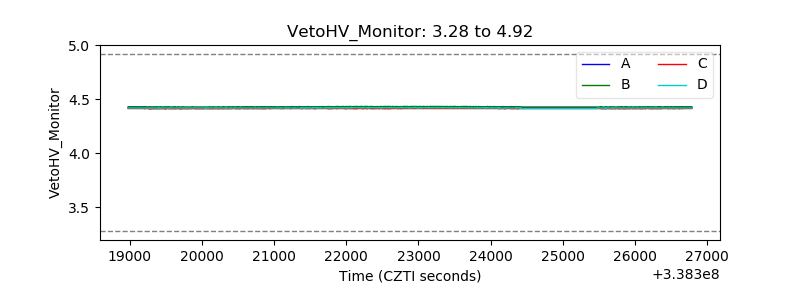 |
| Veto LLD | 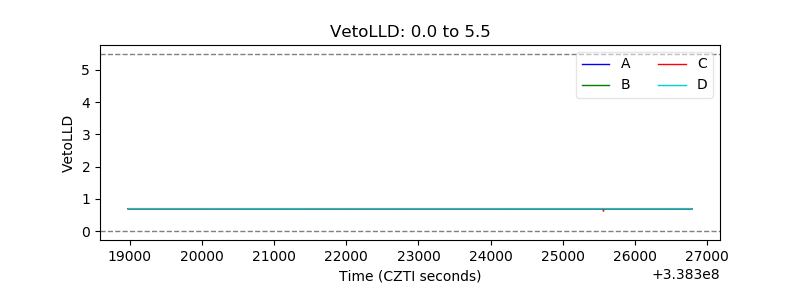 |
| Alpha Counter | 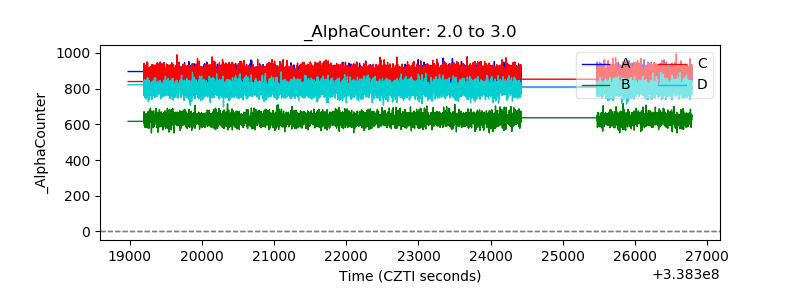 |
| _CPM_Rate | 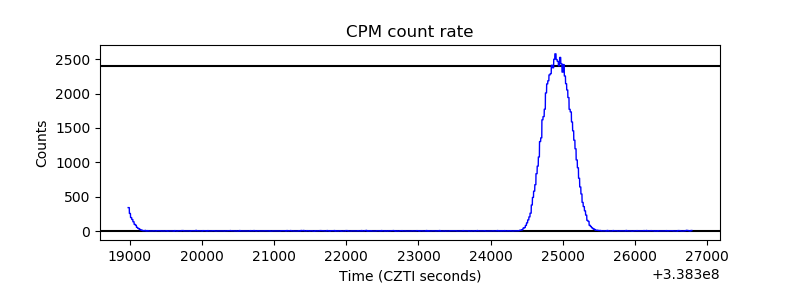 |
| CZT Counter | 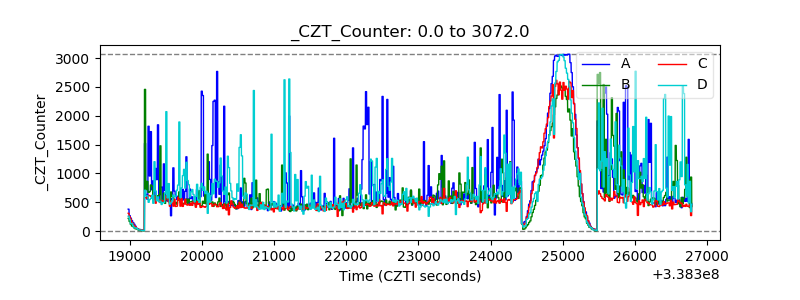 |
| +2.5 Volts monitor |  |
| +5 Volts monitor |  |
| _ROLL_ROT | 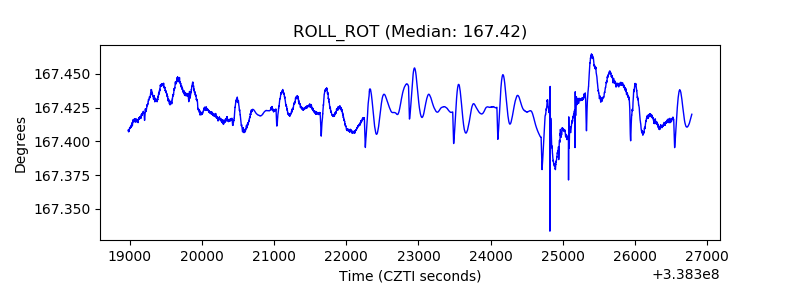 |
| _Roll_DEC | 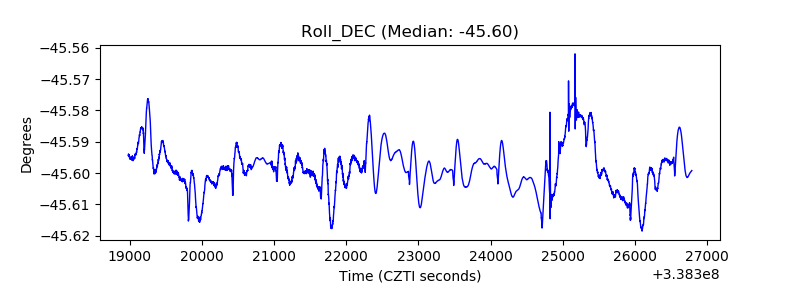 |
| _Roll_RA | 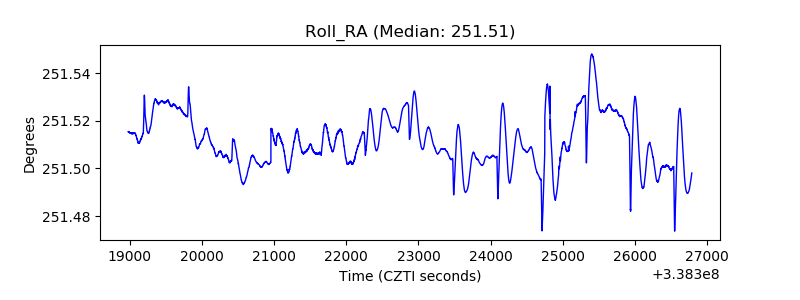 |
| Veto Counter | 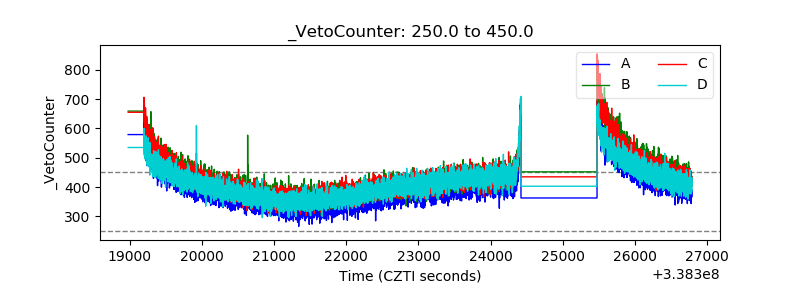 |