| Param | Original file | Final file |
|---|---|---|
| Filename | modeM0/AS1A09_134T01_9000003896_26935cztM0_level2.evt | modeM0/AS1A09_134T01_9000003896_26935cztM0_level2_quad_clean.evt |
| Size (bytes) | 599,751,360 | 89,631,360 |
| Size | 572.0 MB | 85.5 MB |
| Events in quadrant A | 4,618,232 | 560,450 |
| Events in quadrant B | 3,870,527 | 612,614 |
| Events in quadrant C | 3,242,986 | 589,060 |
| Events in quadrant D | 6,011,639 | 518,568 |
| Mode M9 | |||
|---|---|---|---|
| Quadrant | BADHDUFLAG | Total packets | Discarded packets |
| A | 0 | 12 | 0 |
| B | 0 | 12 | 0 |
| C | 0 | 12 | 0 |
| D | 0 | 12 | 0 |
| Mode M0 | |||
|---|---|---|---|
| Quadrant | BADHDUFLAG | Total packets | Discarded packets |
| A | 0 | 17734 | 0 |
| B | 0 | 15377 | 0 |
| C | 0 | 13409 | 0 |
| D | 0 | 22118 | 0 |
| Quadrant | Total seconds | Saturated seconds | Saturation percentage |
|---|---|---|---|
| A | 6208 | 541 | 8.714562% |
| B | 6208 | 136 | 2.190722% |
| C | 6208 | 108 | 1.739691% |
| D | 6209 | 592 | 9.534547% |
Noise dominated data is calculated using 1-second bins in cleaned event files. If a bin has >2000 counts, and if more than 50% of those come from <1% of pixels, then it is considered to be noise-dominated and hence unusable.
| Quadrant | # 1 sec bins | Bins with >0 counts | Bins with >2000 counts | High rate bins dominated by noise | Noise dominated (total time) | Noise dominated (detector-on time) | Marked lightcurve |
|---|---|---|---|---|---|---|---|
| A | 7387 | 6208 | 449 | 449 | 6.08% | 7.23% | 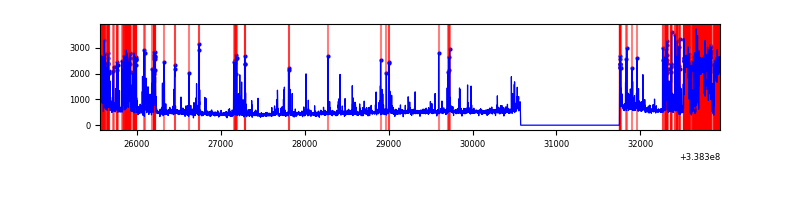 |
| B | 7388 | 6209 | 87 | 87 | 1.18% | 1.40% | 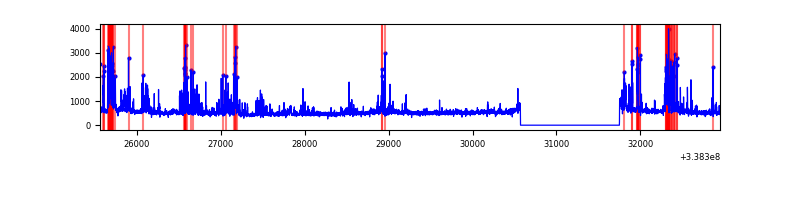 |
| C | 7388 | 6209 | 33 | 33 | 0.45% | 0.53% | 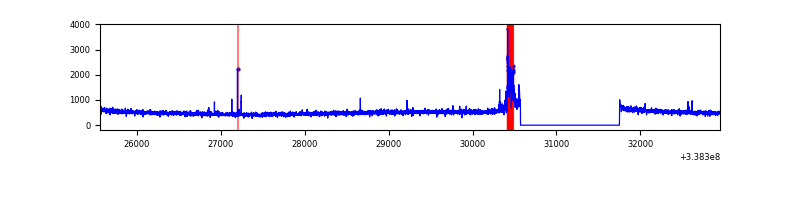 |
| D | 7389 | 6210 | 561 | 561 | 7.59% | 9.03% | 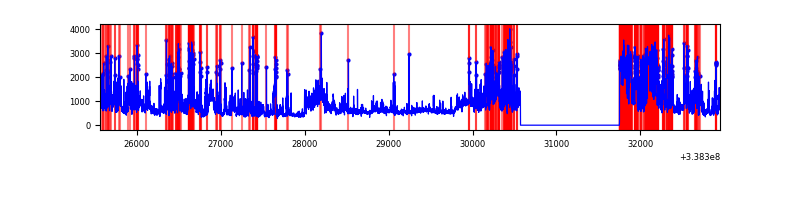 |
Top three noisy pixels from each quadrant. If the there are fewer than three noisy pixels in the level2.evt file, extra rows are filled as -1
| Pixel properties | Quadrant properties | ||||||
|---|---|---|---|---|---|---|---|
| Quadrant | DetID | PixID | Counts | Sigma | Mean | Median | Sigma |
| A | 14 | 235 | 1622397 | 10716.72 | 751 | 739 | 151.3 |
| A | 0 | 13 | 69278 | 452.94 | 751 | 739 | 151.3 |
| A | 8 | 192 | 22950 | 146.78 | 751 | 739 | 151.3 |
| B | 10 | 245 | 375780 | 2527.9 | 785 | 768 | 148.3 |
| B | 0 | 189 | 323620 | 2176.3 | 785 | 768 | 148.3 |
| B | 10 | 246 | 25636 | 167.63 | 785 | 768 | 148.3 |
| C | 0 | 207 | 160302 | 904.84 | 753 | 758 | 176.3 |
| C | 14 | 238 | 121547 | 685.04 | 753 | 758 | 176.3 |
| C | 15 | 208 | 12310 | 65.52 | 753 | 758 | 176.3 |
| D | 1 | 52 | 1465958 | 8560.6 | 718 | 698 | 171.2 |
| D | 7 | 80 | 1140717 | 6660.42 | 718 | 698 | 171.2 |
| D | 2 | 250 | 461254 | 2690.74 | 718 | 698 | 171.2 |
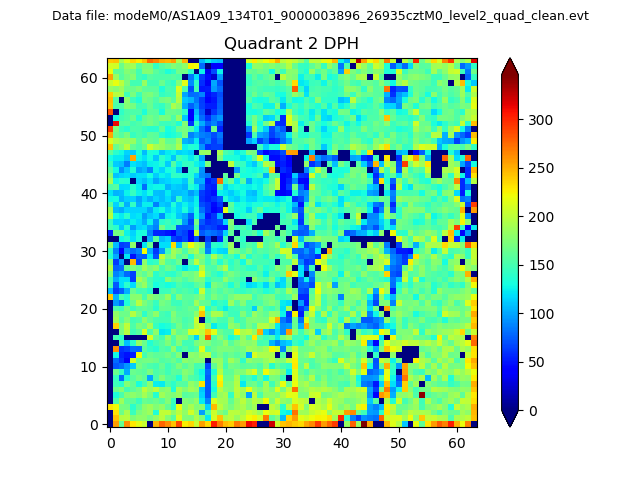
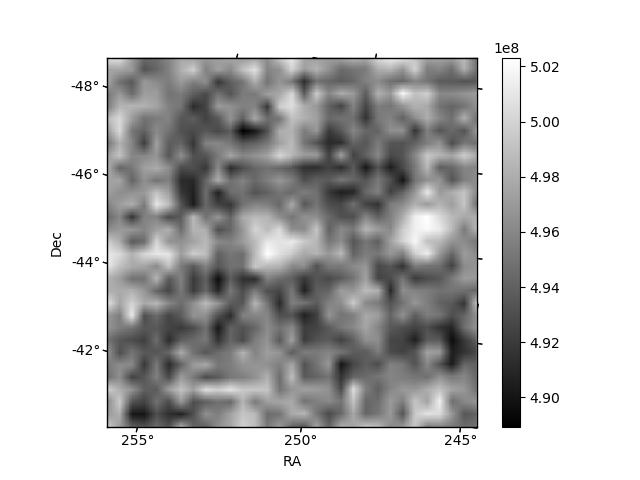
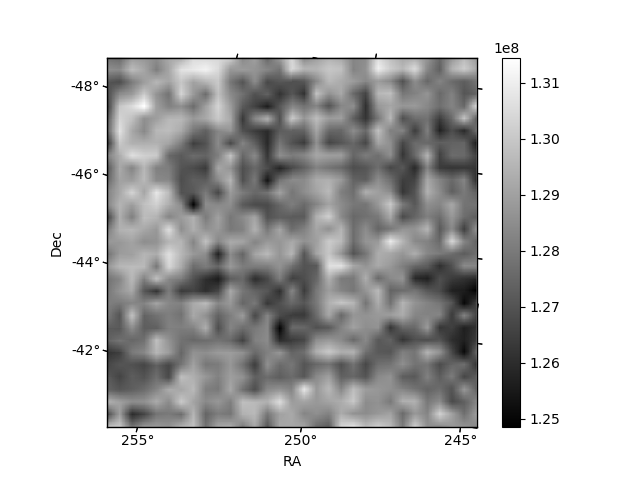
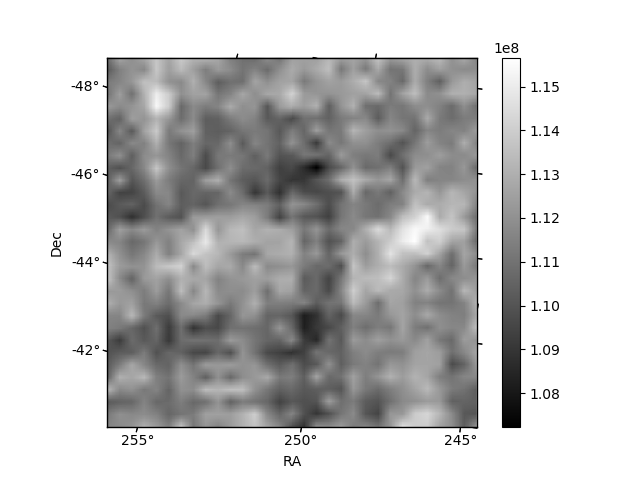
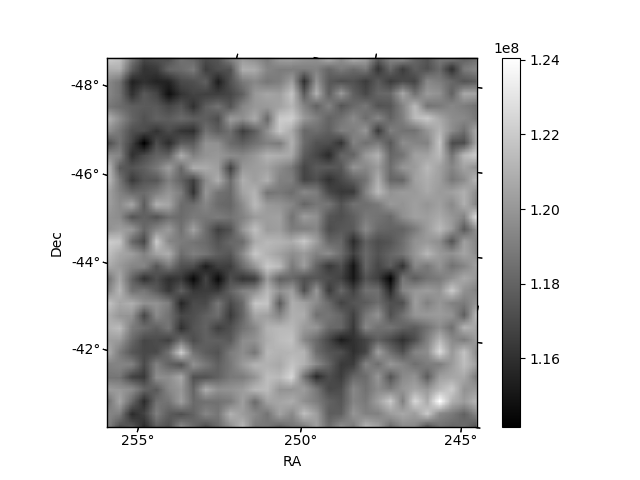
Histogram calculated using DETX and DETY for each event in the final _common_clean file
| Quadrant A | 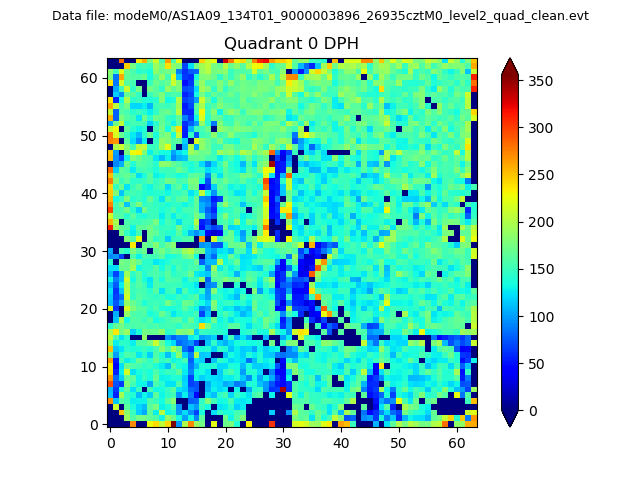 |
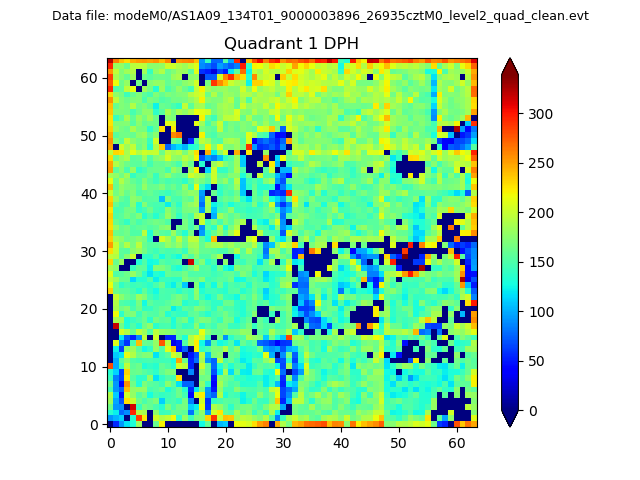 |
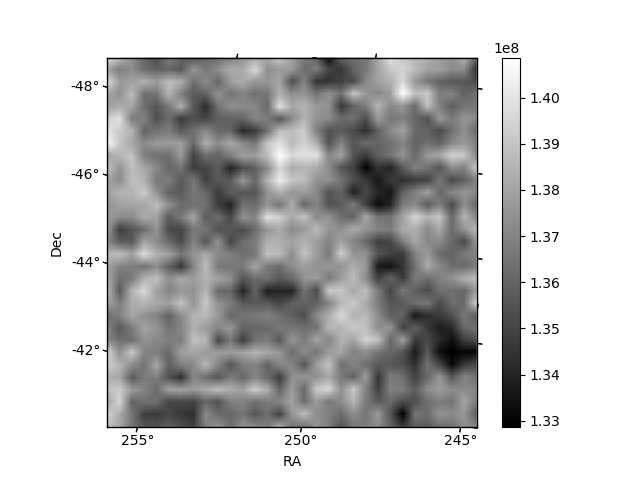
Quadrant B |
|---|---|---|---|
| Quadrant D | 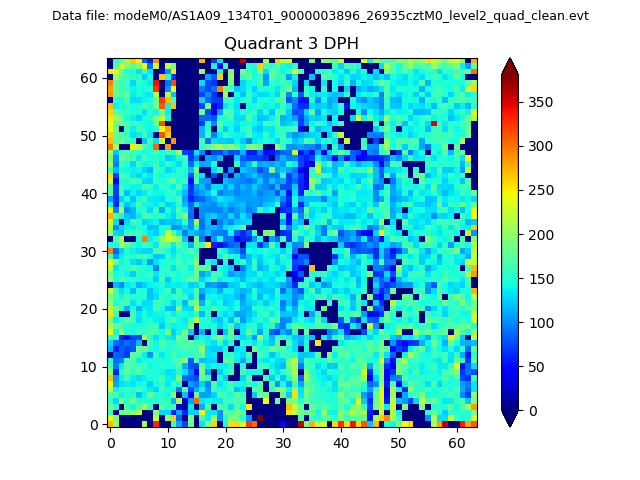 |
 |
Quadrant C |
| Plot type | Count rate plots | Images |
|---|---|---|
| Comparison with Poisson distribution Blue bars denote a histogram of data divided into 1 sec bins. Red curve is a Poisson curve with rate = median count rate of data. |
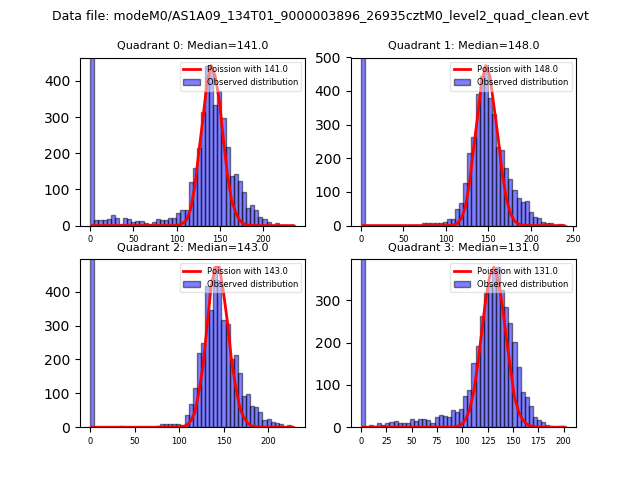 |
 |
| Quadrant-wise count rates Data is divided into 100 sec bins |
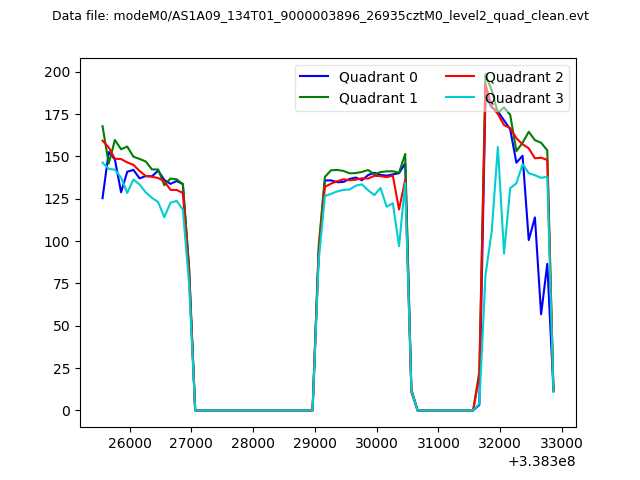 |
|
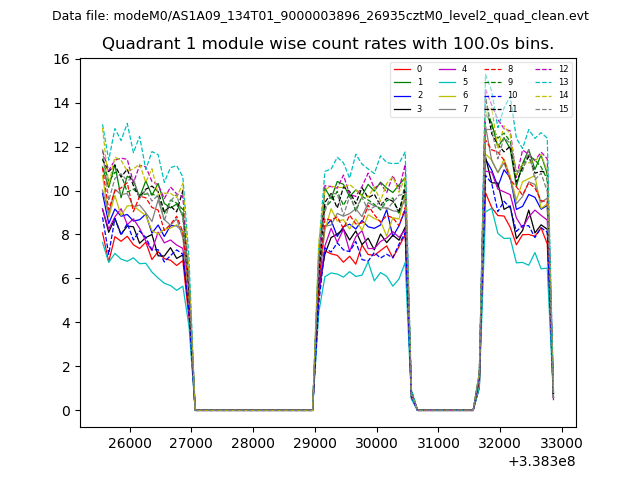
| Module-wise count rates for Quadrant A Data is divided into 100 sec bins |
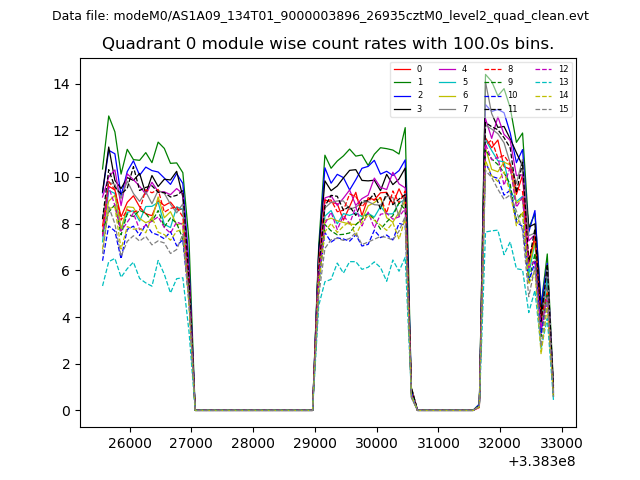 |
 |
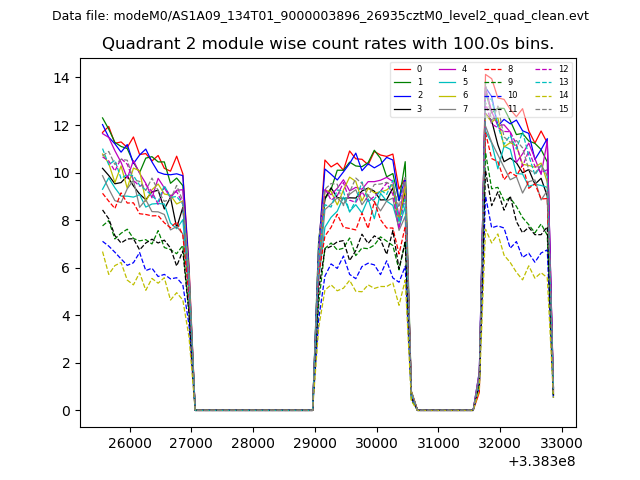
| Module-wise count rates for Quadrant B Data is divided into 100 sec bins |
 |
 |
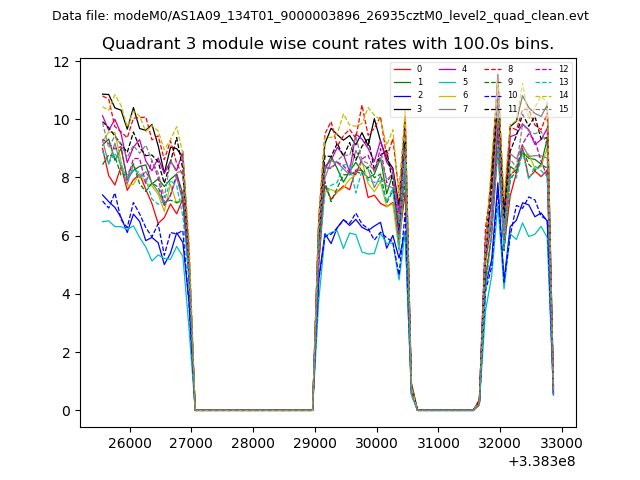
| Module-wise count rates for Quadrant C Data is divided into 100 sec bins |
 |
 |
| Module-wise count rates for Quadrant D Data is divided into 100 sec bins |
 |
 |
| Parameter | Plot |
|---|---|
| CZT HV Monitor | 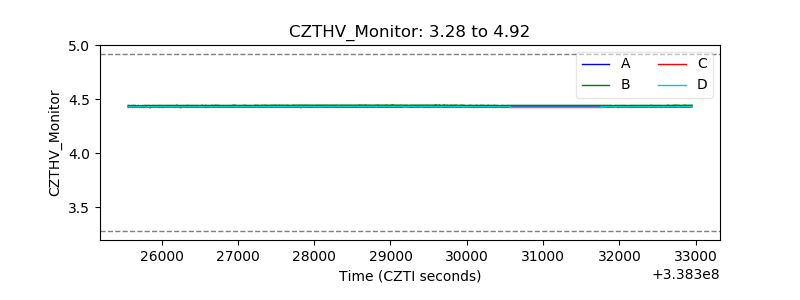 |
| D_VDD | 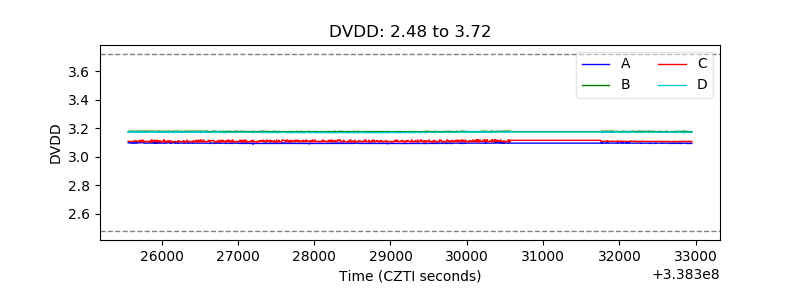 |
| Temperature 1 | 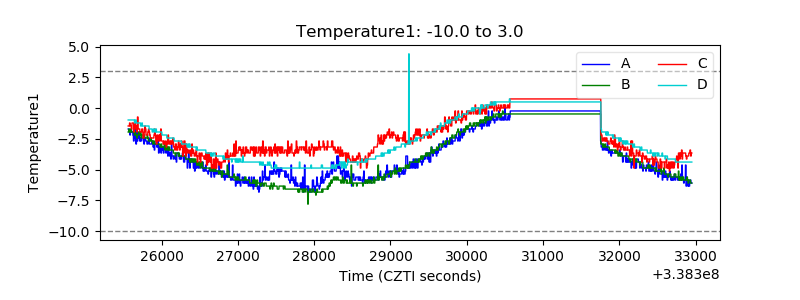 |
| Veto HV Monitor | 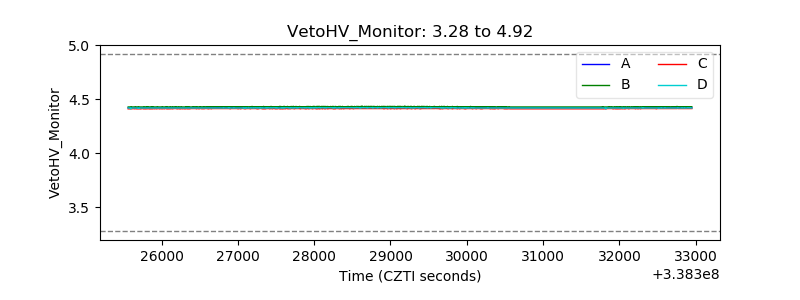 |
| Veto LLD | 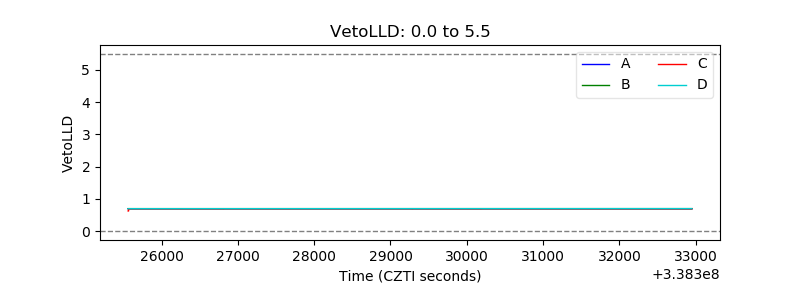 |
| Alpha Counter | 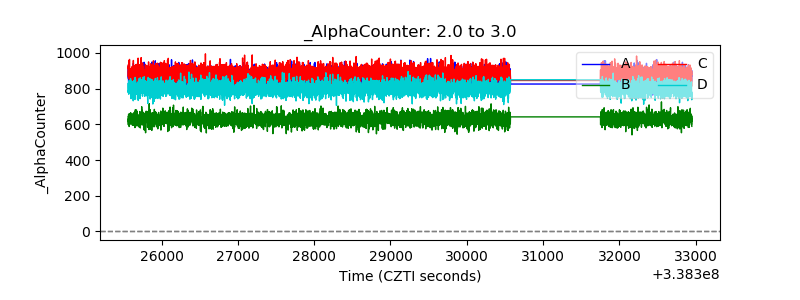 |
| _CPM_Rate | 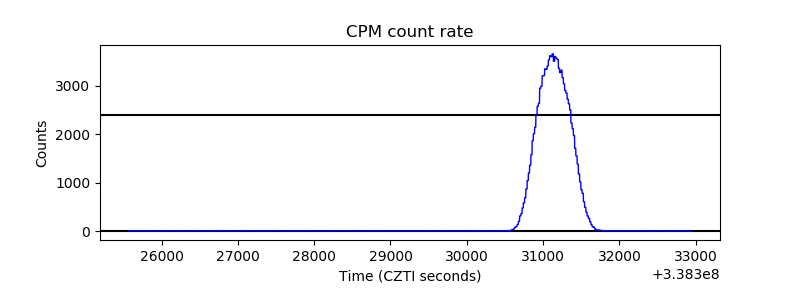 |
| CZT Counter | 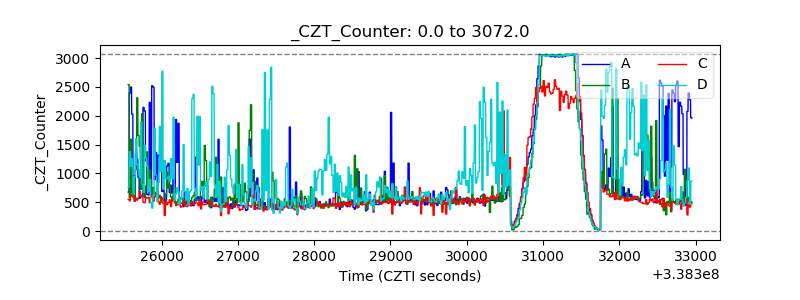 |
| +2.5 Volts monitor | 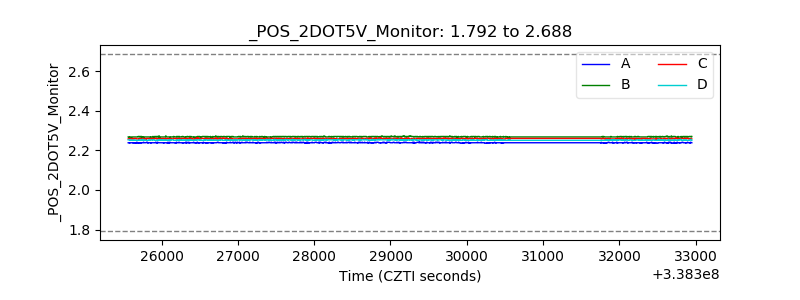 |
| +5 Volts monitor | 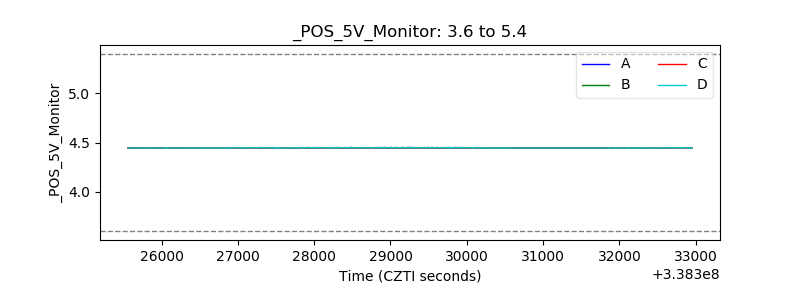 |
| _ROLL_ROT |  |
| _Roll_DEC | 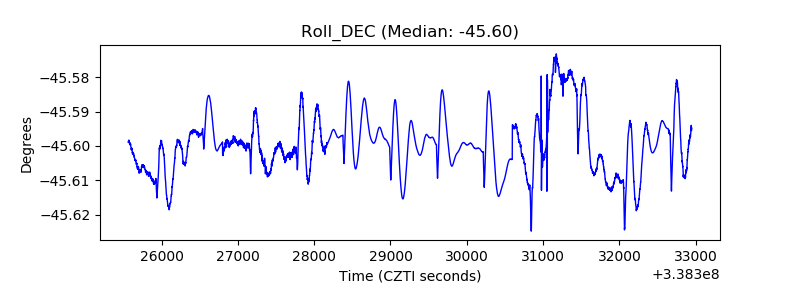 |
| _Roll_RA | 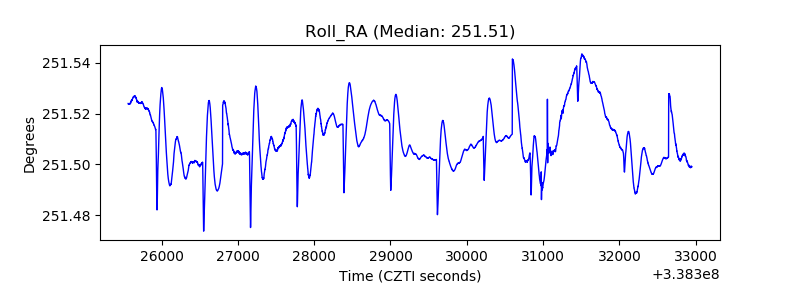 |
| Veto Counter |  |