| Param | Original file | Final file |
|---|---|---|
| Filename | modeM0/AS1A09_134T01_9000003896_26936cztM0_level2.evt | modeM0/AS1A09_134T01_9000003896_26936cztM0_level2_quad_clean.evt |
| Size (bytes) | 818,265,600 | 79,130,880 |
| Size | 780.4 MB | 75.5 MB |
| Events in quadrant A | 11,330,860 | 310,348 |
| Events in quadrant B | 4,345,542 | 583,592 |
| Events in quadrant C | 3,288,820 | 567,706 |
| Events in quadrant D | 5,396,129 | 499,490 |
| Mode M9 | |||
|---|---|---|---|
| Quadrant | BADHDUFLAG | Total packets | Discarded packets |
| A | 0 | 17 | 0 |
| B | 0 | 18 | 0 |
| C | 0 | 18 | 0 |
| D | 0 | 18 | 0 |
| Mode M0 | |||
|---|---|---|---|
| Quadrant | BADHDUFLAG | Total packets | Discarded packets |
| A | 0 | 37901 | 0 |
| B | 0 | 16887 | 0 |
| C | 0 | 13430 | 0 |
| D | 0 | 20178 | 0 |
| Quadrant | Total seconds | Saturated seconds | Saturation percentage |
|---|---|---|---|
| A | 6212 | 4325 | 69.623310% |
| B | 6212 | 274 | 4.410818% |
| C | 6212 | 62 | 0.998068% |
| D | 6212 | 640 | 10.302640% |
Noise dominated data is calculated using 1-second bins in cleaned event files. If a bin has >2000 counts, and if more than 50% of those come from <1% of pixels, then it is considered to be noise-dominated and hence unusable.
| Quadrant | # 1 sec bins | Bins with >0 counts | Bins with >2000 counts | High rate bins dominated by noise | Noise dominated (total time) | Noise dominated (detector-on time) | Marked lightcurve |
|---|---|---|---|---|---|---|---|
| A | 7491 | 6211 | 3382 | 3382 | 45.15% | 54.45% | 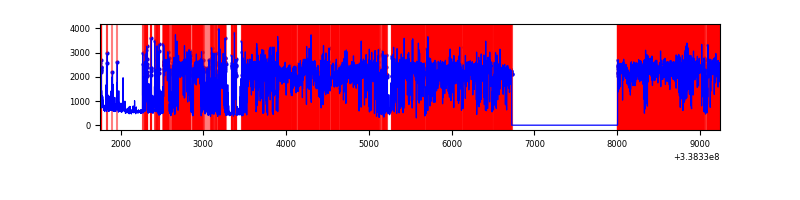 |
| B | 7492 | 6213 | 175 | 175 | 2.34% | 2.82% | 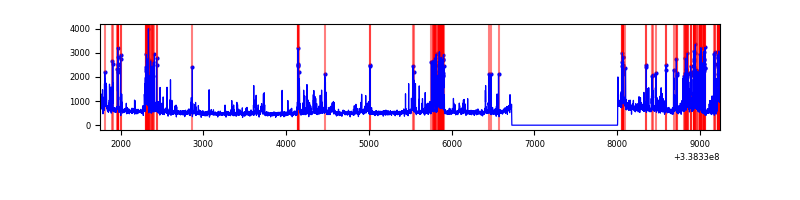 |
| C | 7492 | 6213 | 3 | 3 | 0.04% | 0.05% | 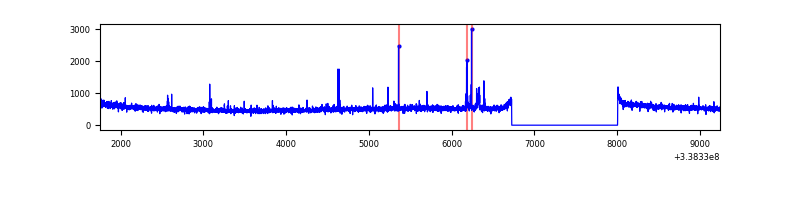 |
| D | 7492 | 6213 | 578 | 578 | 7.71% | 9.30% | 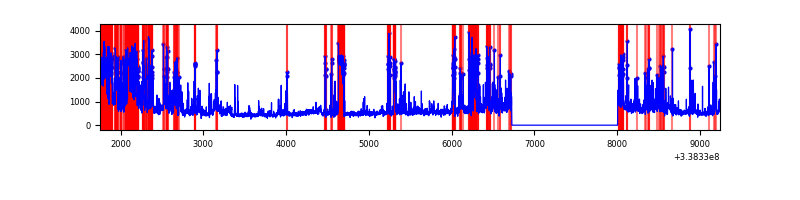 |
Top three noisy pixels from each quadrant. If the there are fewer than three noisy pixels in the level2.evt file, extra rows are filled as -1
| Pixel properties | Quadrant properties | ||||||
|---|---|---|---|---|---|---|---|
| Quadrant | DetID | PixID | Counts | Sigma | Mean | Median | Sigma |
| A | 14 | 235 | 9500247 | 106838.84 | 448 | 441 | 88.9 |
| A | 0 | 13 | 55538 | 619.64 | 448 | 441 | 88.9 |
| A | 8 | 192 | 34258 | 380.32 | 448 | 441 | 88.9 |
| B | 0 | 189 | 830068 | 5445.29 | 817 | 800 | 152.3 |
| B | 10 | 245 | 243264 | 1592.11 | 817 | 800 | 152.3 |
| B | 0 | 219 | 37361 | 240.07 | 817 | 800 | 152.3 |
| C | 14 | 238 | 131277 | 711.79 | 795 | 803 | 183.3 |
| C | 0 | 207 | 36587 | 195.22 | 795 | 803 | 183.3 |
| C | 15 | 208 | 22581 | 118.81 | 795 | 803 | 183.3 |
| D | 1 | 52 | 1468375 | 7885.79 | 747 | 732 | 186.1 |
| D | 2 | 250 | 401775 | 2154.84 | 747 | 732 | 186.1 |
| D | 7 | 80 | 255817 | 1370.6 | 747 | 732 | 186.1 |
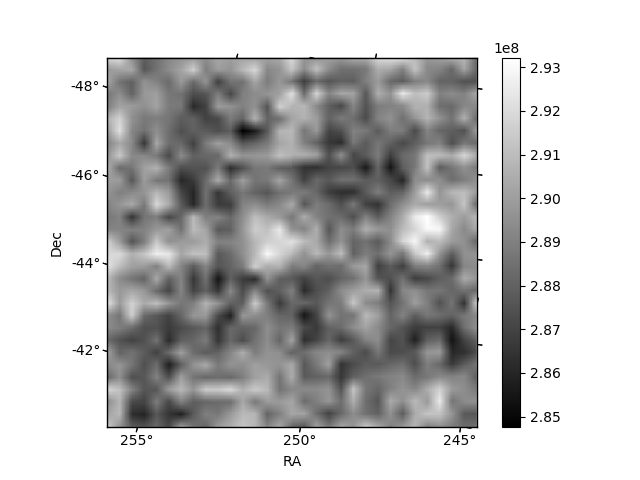
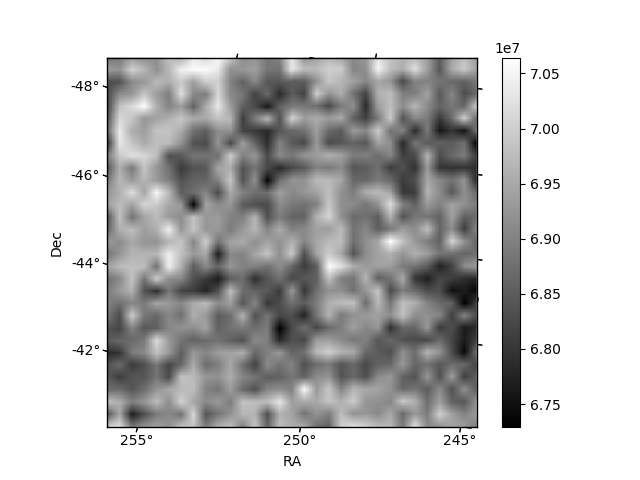
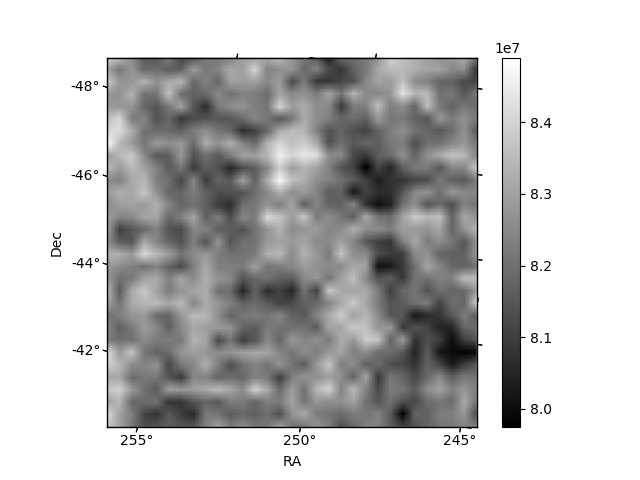
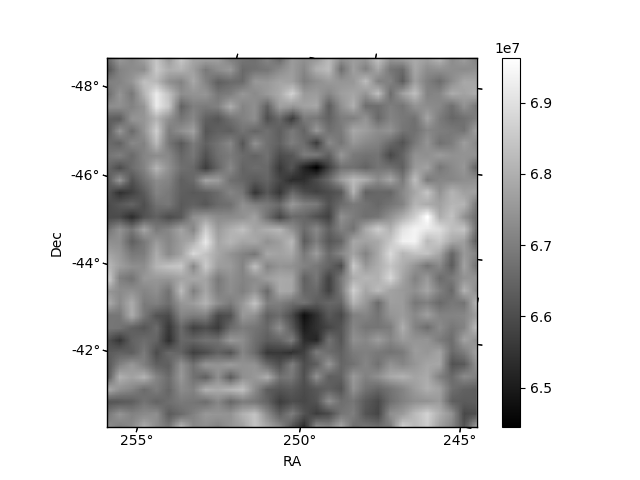
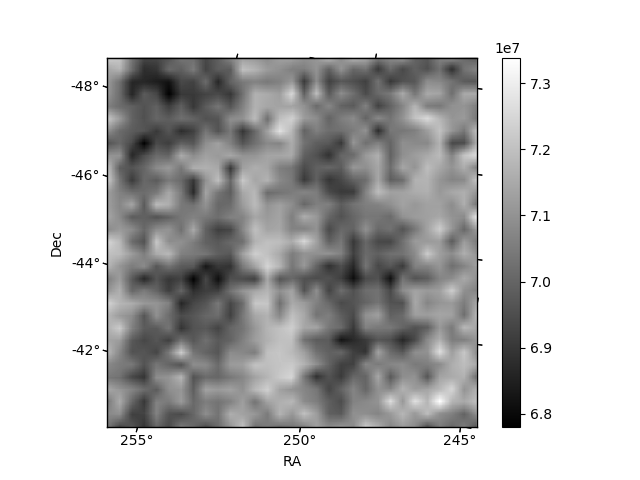
Histogram calculated using DETX and DETY for each event in the final _common_clean file
| Quadrant A | 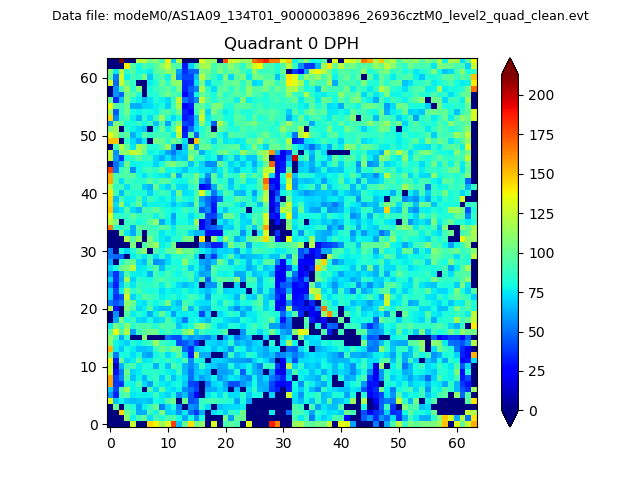 |
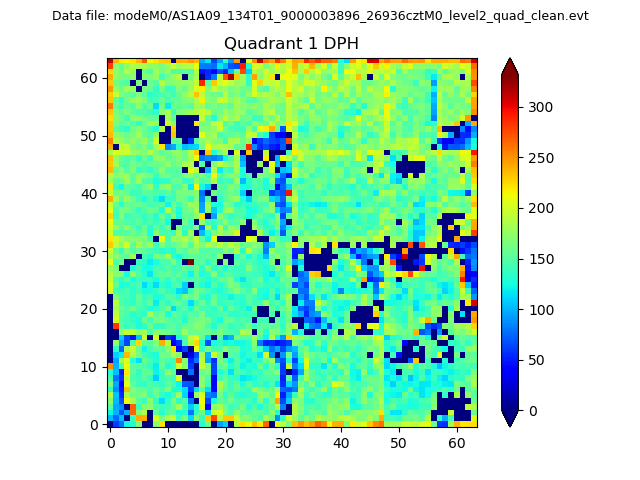 |
Quadrant B |
|---|---|---|---|
| Quadrant D | 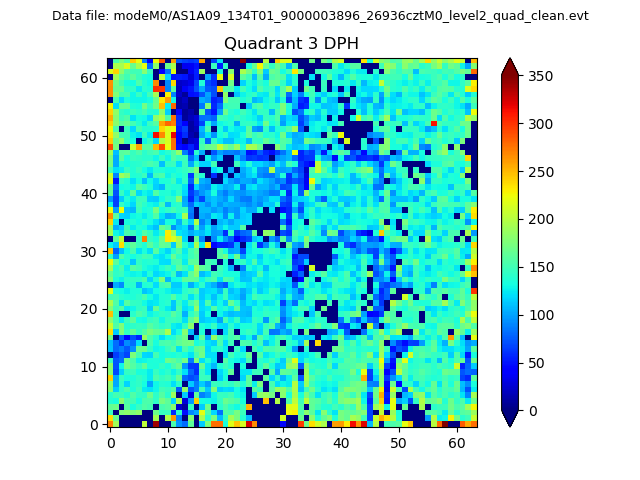 |
 |
Quadrant C |
| Plot type | Count rate plots | Images |
|---|---|---|
| Comparison with Poisson distribution Blue bars denote a histogram of data divided into 1 sec bins. Red curve is a Poisson curve with rate = median count rate of data. |
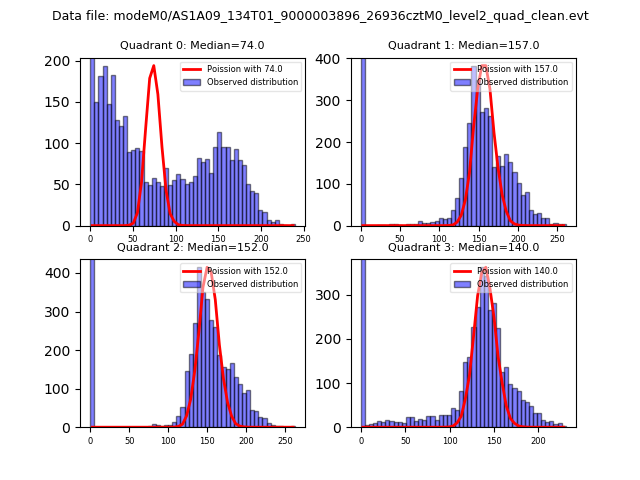 |
 |
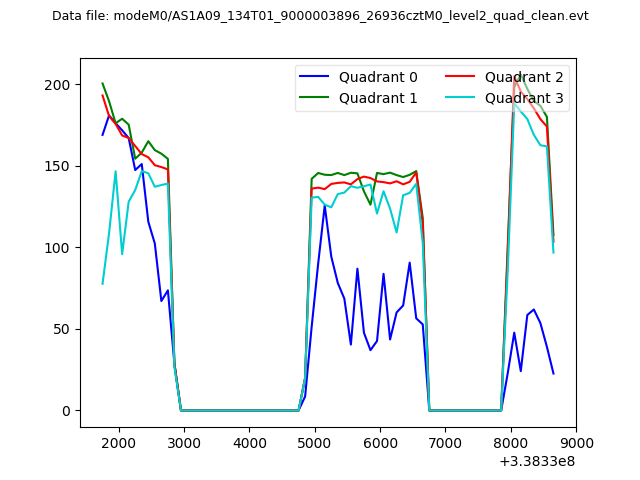
| Quadrant-wise count rates Data is divided into 100 sec bins |
 |
|
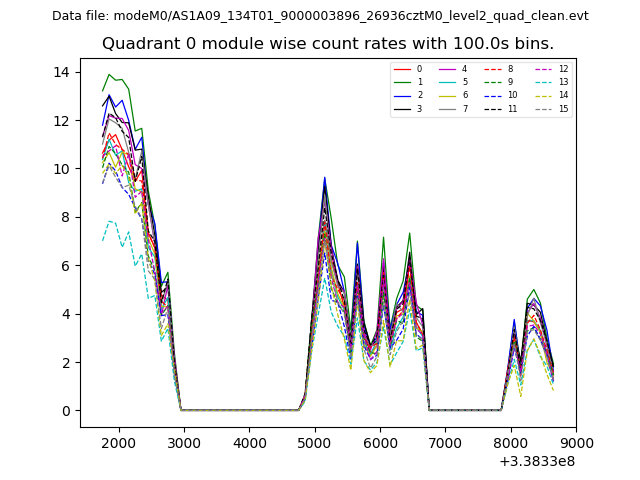
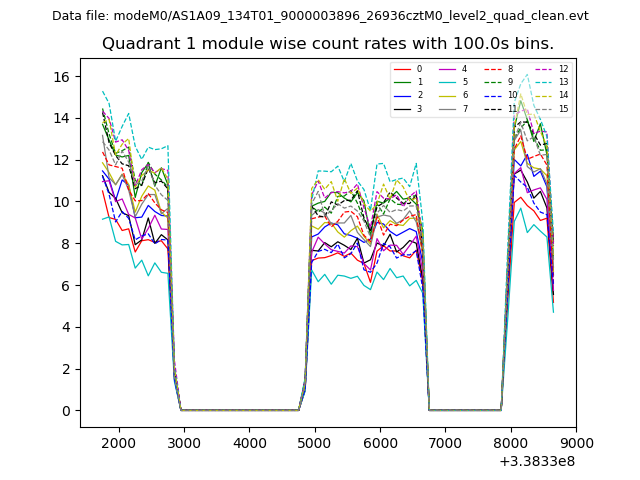
| Module-wise count rates for Quadrant A Data is divided into 100 sec bins |
 |
 |
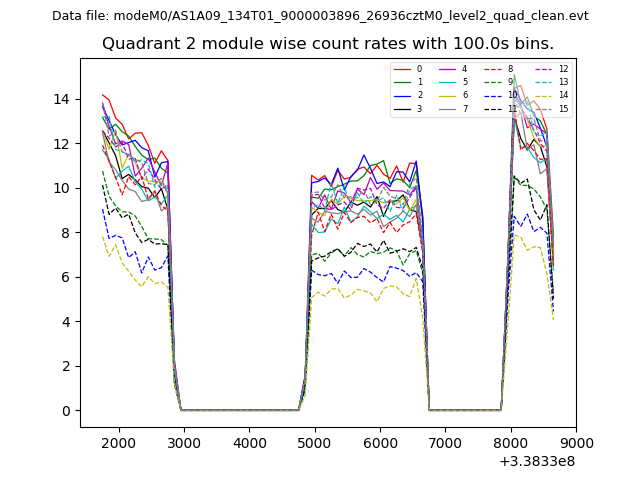
| Module-wise count rates for Quadrant B Data is divided into 100 sec bins |
 |
 |
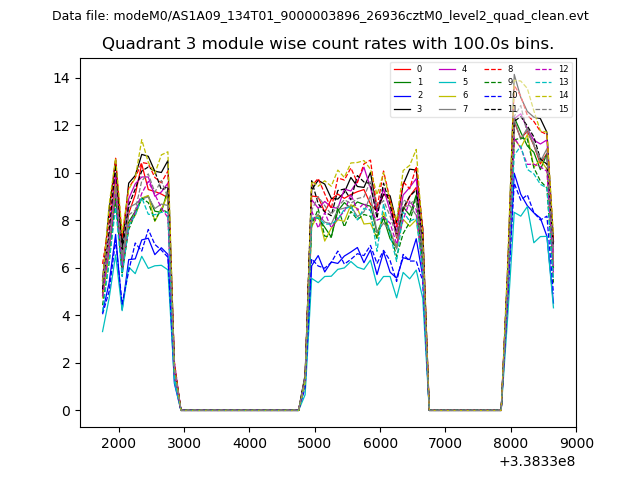
| Module-wise count rates for Quadrant C Data is divided into 100 sec bins |
 |
 |
| Module-wise count rates for Quadrant D Data is divided into 100 sec bins |
 |
 |
| Parameter | Plot |
|---|---|
| CZT HV Monitor | 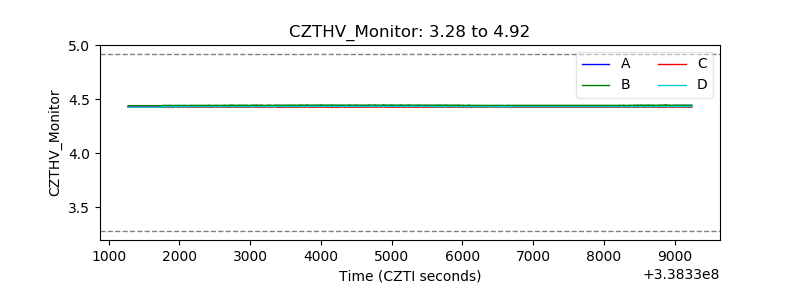 |
| D_VDD | 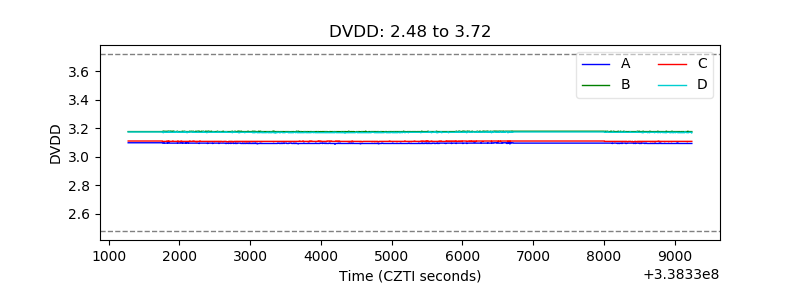 |
| Temperature 1 | 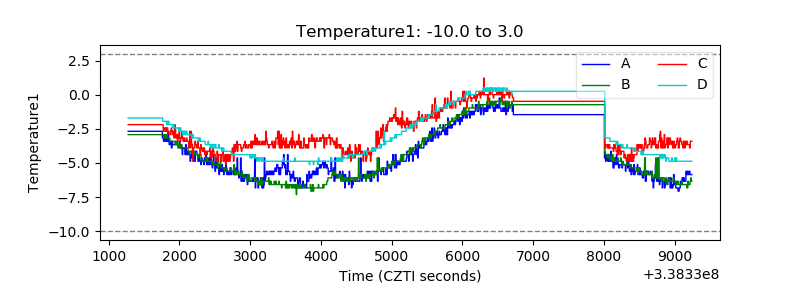 |
| Veto HV Monitor | 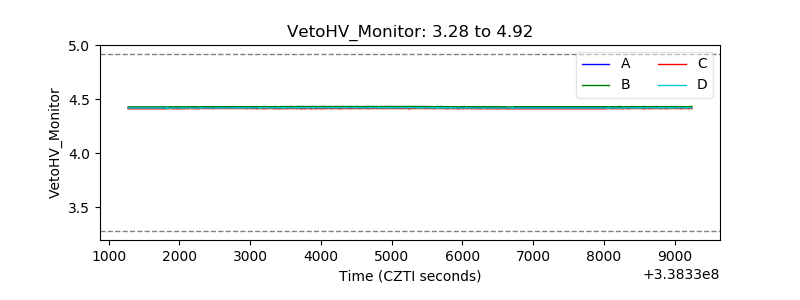 |
| Veto LLD | 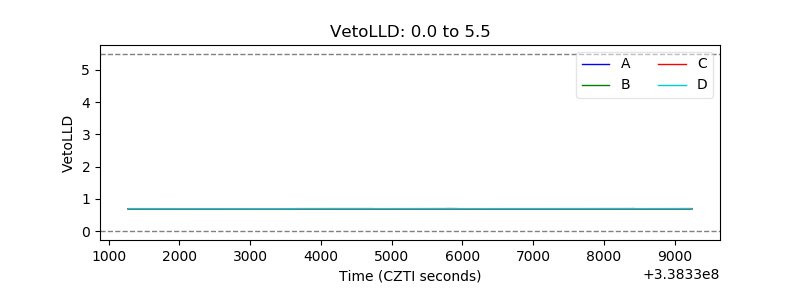 |
| Alpha Counter | 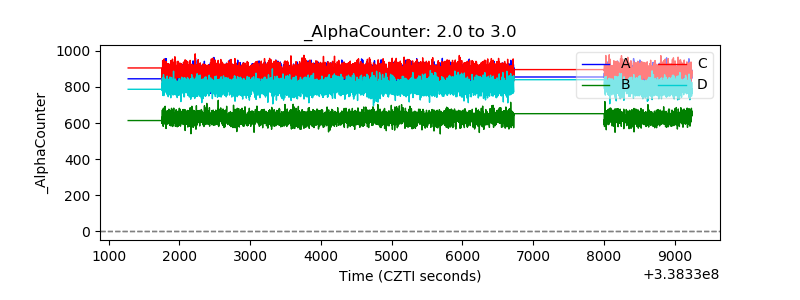 |
| _CPM_Rate | 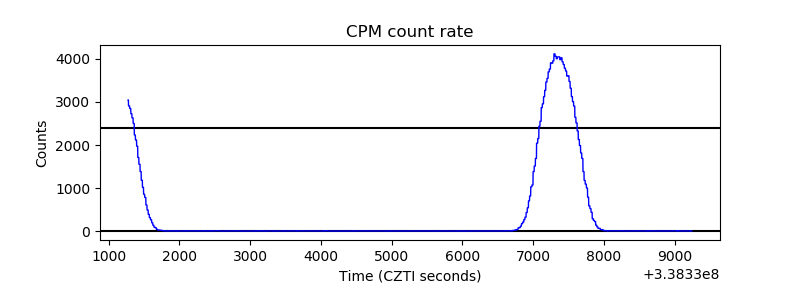 |
| CZT Counter | 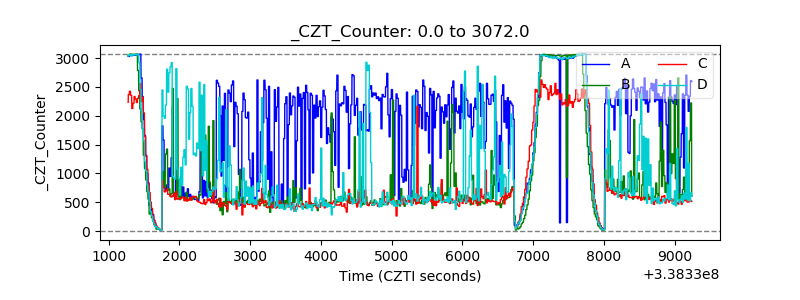 |
| +2.5 Volts monitor | 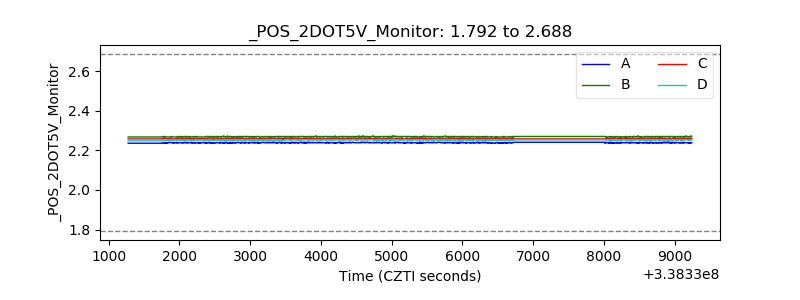 |
| +5 Volts monitor |  |
| _ROLL_ROT | 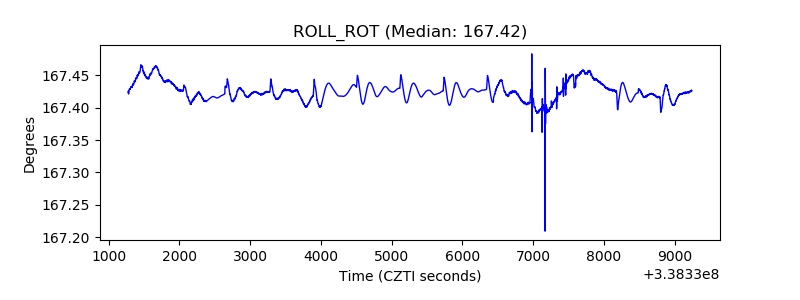 |
| _Roll_DEC |  |
| _Roll_RA | 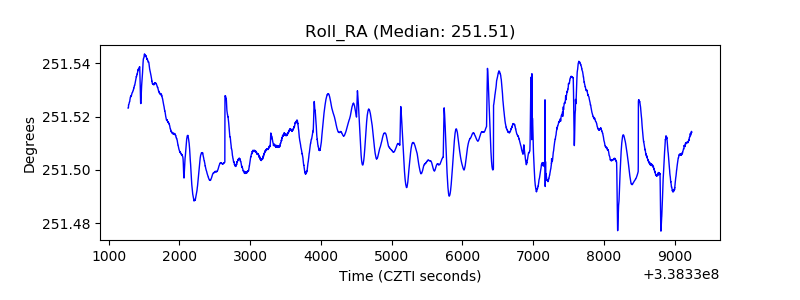 |
| Veto Counter | 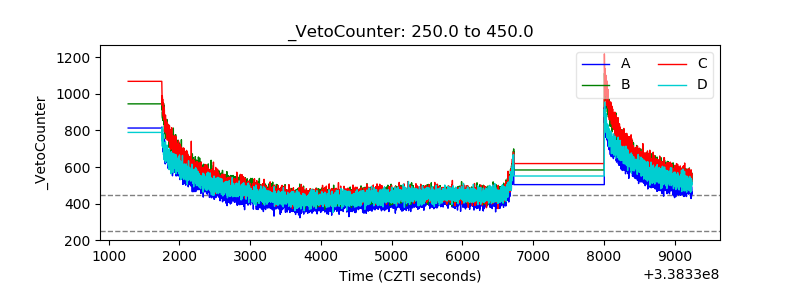 |